| Param | Original file | Final file |
|---|---|---|
| Filename | modeM0/AS1A10_058T05_9000004918_34440cztM0_level2.evt | modeM0/AS1A10_058T05_9000004918_34440cztM0_level2_quad_clean.evt |
| Size (bytes) | 558,230,400 | 82,330,560 |
| Size | 532.4 MB | 78.5 MB |
| Events in quadrant A | 2,455,740 | 571,829 |
| Events in quadrant B | 3,465,285 | 569,771 |
| Events in quadrant C | 3,055,712 | 556,589 |
| Events in quadrant D | 7,571,355 | 424,403 |
| Mode M9 | |||
|---|---|---|---|
| Quadrant | BADHDUFLAG | Total packets | Discarded packets |
| A | 0 | 21 | 0 |
| B | 0 | 21 | 0 |
| C | 0 | 21 | 0 |
| D | 0 | 22 | 0 |
| Mode M0 | |||
|---|---|---|---|
| Quadrant | BADHDUFLAG | Total packets | Discarded packets |
| A | 0 | 10767 | 3 |
| B | 0 | 13750 | 2 |
| C | 0 | 12249 | 2 |
| D | 0 | 26223 | 2 |
| Mode SS | |||
|---|---|---|---|
| Quadrant | BADHDUFLAG | Total packets | Discarded packets |
| A | 0 | 108 | 0 |
| B | 0 | 108 | 0 |
| C | 0 | 108 | 0 |
| D | 0 | 108 | 0 |
| Quadrant | Total seconds | Saturated seconds | Saturation percentage |
|---|---|---|---|
| A | 5281 | 10 | 0.189358% |
| B | 5281 | 238 | 4.506722% |
| C | 5281 | 125 | 2.366976% |
| D | 5281 | 1650 | 31.244083% |
Noise dominated data is calculated using 1-second bins in cleaned event files. If a bin has >2000 counts, and if more than 50% of those come from <1% of pixels, then it is considered to be noise-dominated and hence unusable.
| Quadrant | # 1 sec bins | Bins with >0 counts | Bins with >2000 counts | High rate bins dominated by noise | Noise dominated (total time) | Noise dominated (detector-on time) | Marked lightcurve |
|---|---|---|---|---|---|---|---|
| A | 6984 | 5282 | 0 | 0 | 0.00% | 0.00% | 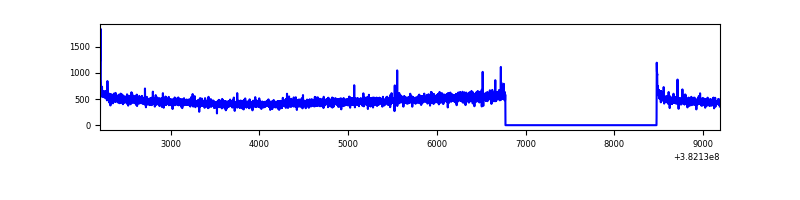 |
| B | 6984 | 5282 | 141 | 141 | 2.02% | 2.67% | 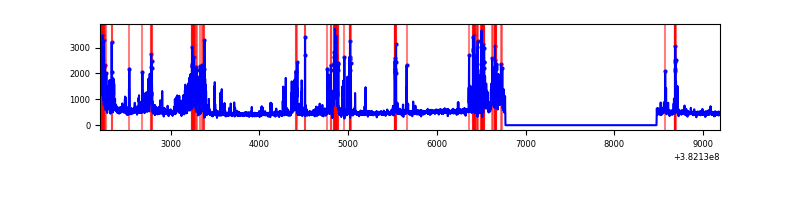 |
| C | 6984 | 5282 | 103 | 103 | 1.47% | 1.95% | 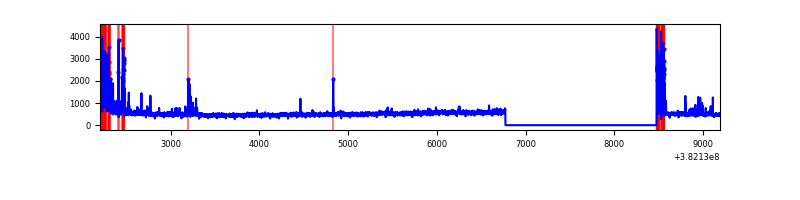 |
| D | 6984 | 5282 | 1408 | 1408 | 20.16% | 26.66% | 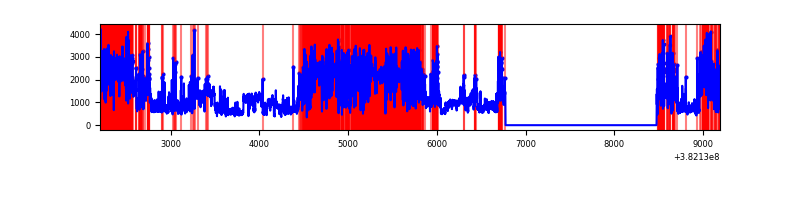 |
Top three noisy pixels from each quadrant. If the there are fewer than three noisy pixels in the level2.evt file, extra rows are filled as -1
| Pixel properties | Quadrant properties | ||||||
|---|---|---|---|---|---|---|---|
| Quadrant | DetID | PixID | Counts | Sigma | Mean | Median | Sigma |
| A | 10 | 83 | 36140 | 280.77 | 623 | 611 | 126.5 |
| A | 13 | 254 | 8555 | 62.78 | 623 | 611 | 126.5 |
| A | 3 | 137 | 6351 | 45.36 | 623 | 611 | 126.5 |
| B | 5 | 172 | 510238 | 4305.6 | 613 | 596 | 118.4 |
| B | 4 | 171 | 414161 | 3493.92 | 613 | 596 | 118.4 |
| B | 15 | 222 | 52897 | 441.85 | 613 | 596 | 118.4 |
| C | 0 | 10 | 226547 | 1623.05 | 601 | 607 | 139.2 |
| C | 15 | 214 | 220322 | 1578.33 | 601 | 607 | 139.2 |
| C | 4 | 254 | 192709 | 1379.97 | 601 | 607 | 139.2 |
| D | 10 | 118 | 2389373 | 18881.31 | 516 | 501 | 126.5 |
| D | 8 | 195 | 1743482 | 13776.28 | 516 | 501 | 126.5 |
| D | 7 | 80 | 514622 | 4063.54 | 516 | 501 | 126.5 |
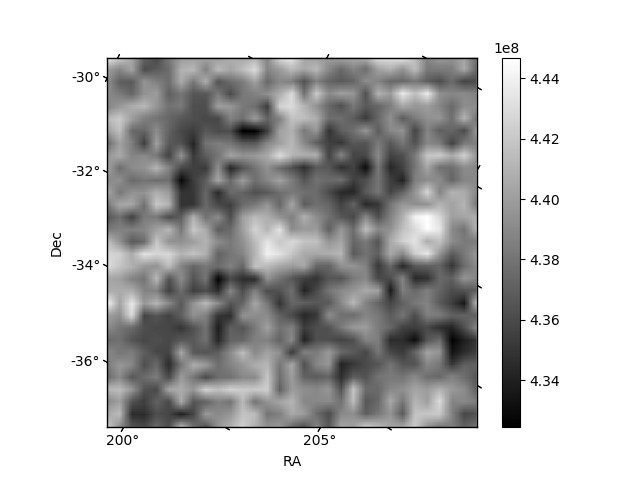
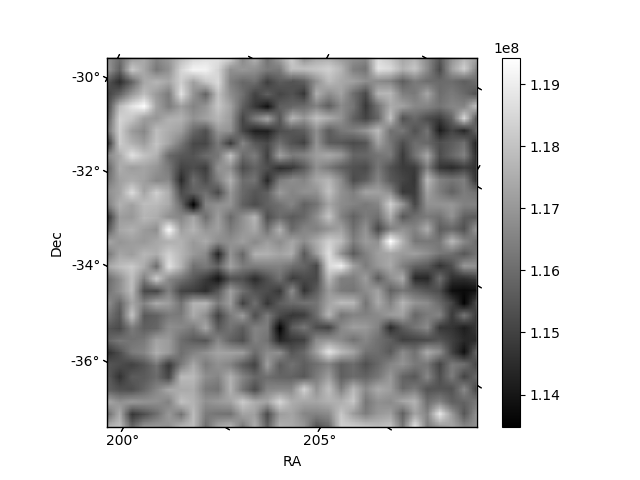
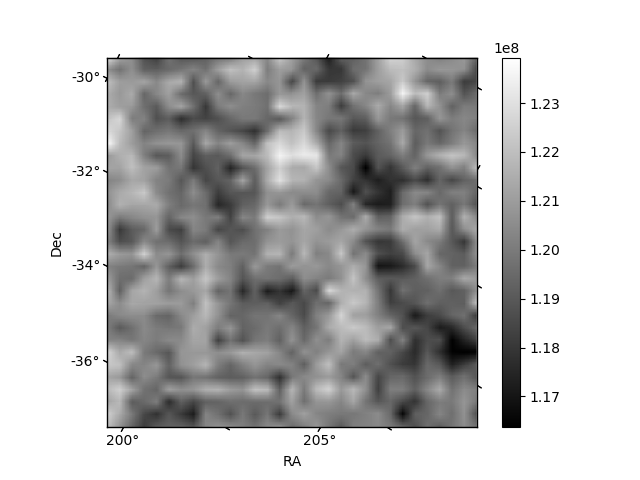
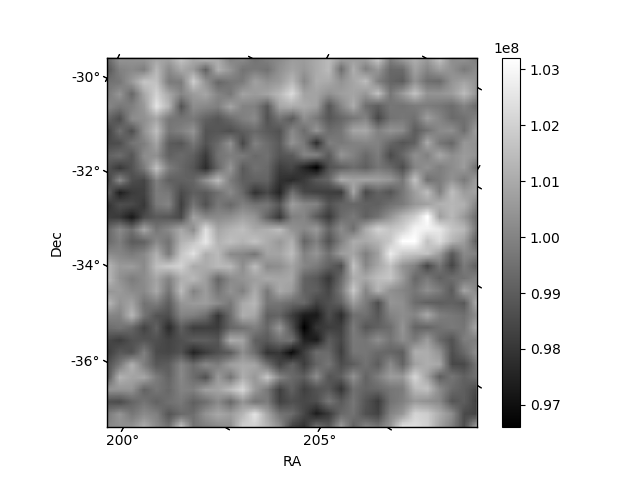
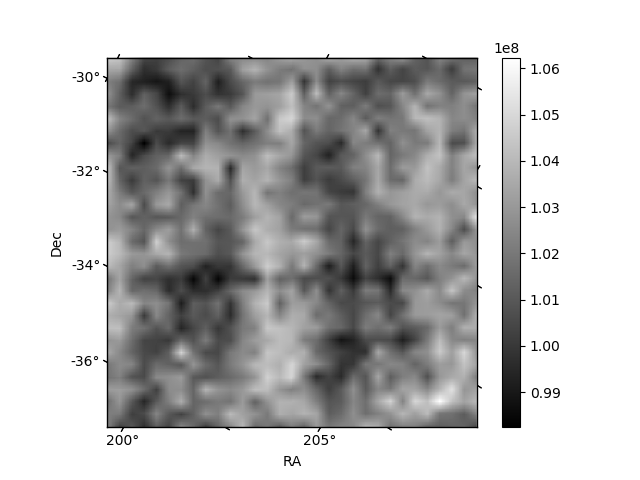
Histogram calculated using DETX and DETY for each event in the final _common_clean file
| Quadrant A | 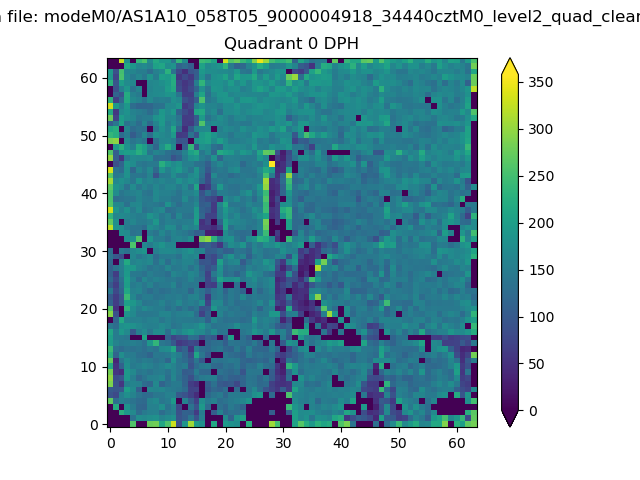 |
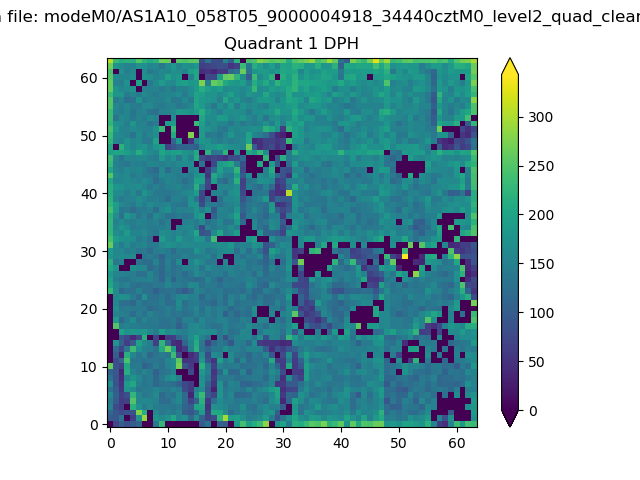 |
Quadrant B |
|---|---|---|---|
| Quadrant D | 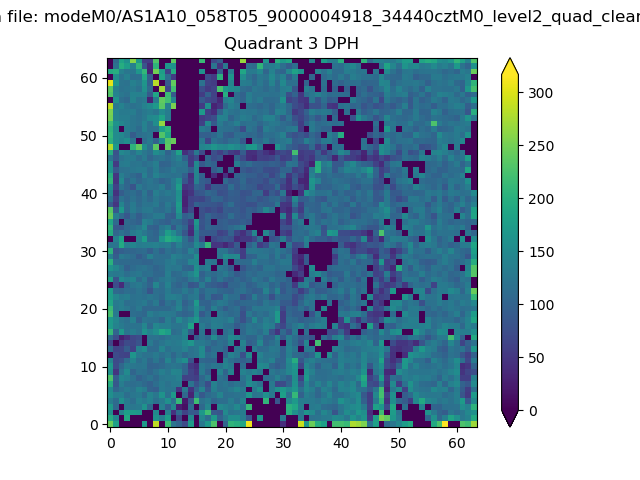 |
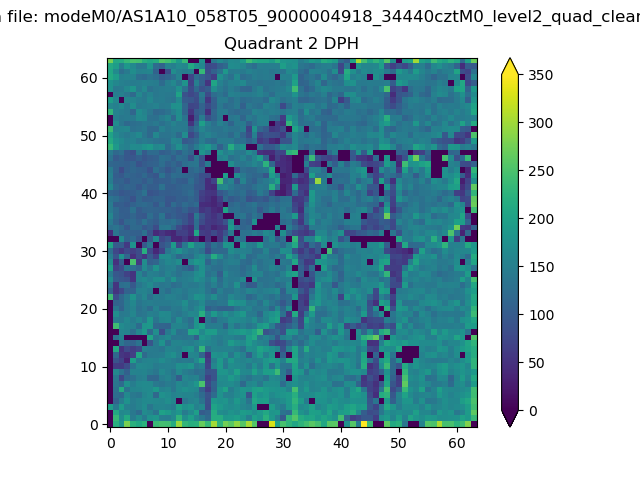 |
Quadrant C |
| Plot type | Count rate plots | Images |
|---|---|---|
| Comparison with Poisson distribution Blue bars denote a histogram of data divided into 1 sec bins. Red curve is a Poisson curve with rate = median count rate of data. |
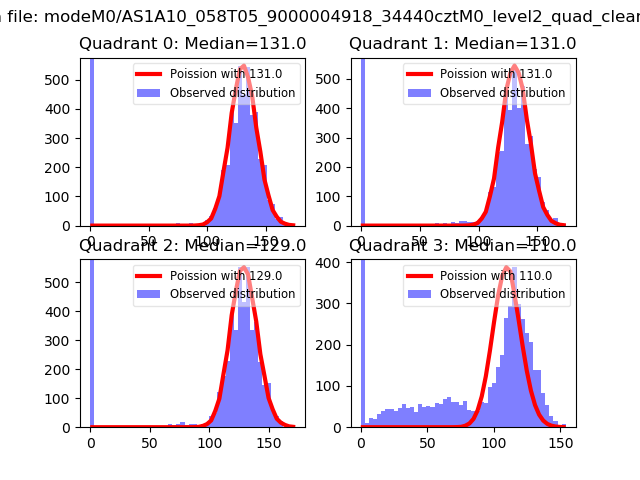 |
 |
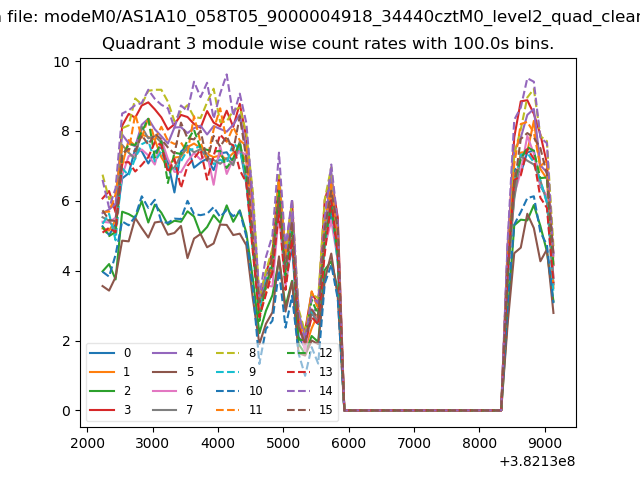
| Quadrant-wise count rates Data is divided into 100 sec bins |
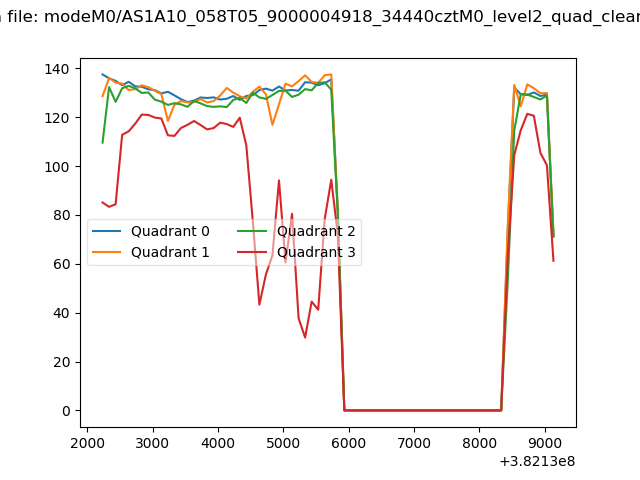 |
|
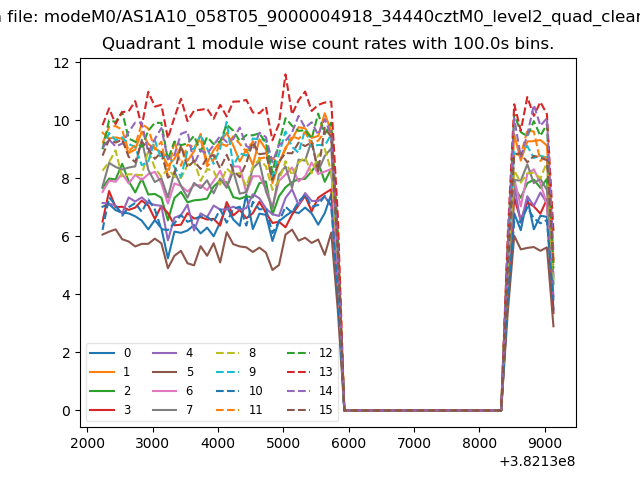
| Module-wise count rates for Quadrant A Data is divided into 100 sec bins |
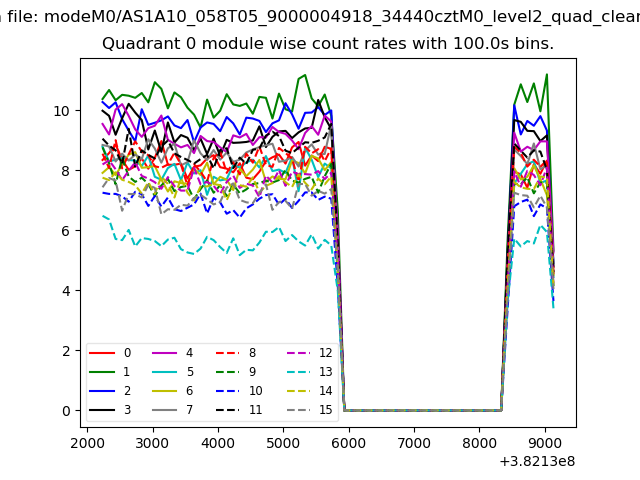 |
 |
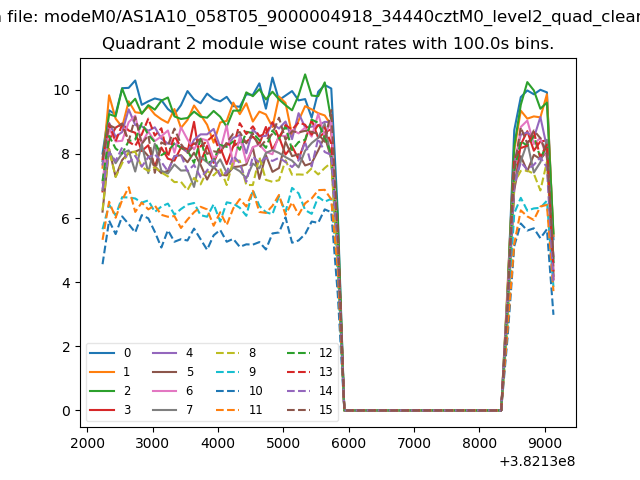
| Module-wise count rates for Quadrant B Data is divided into 100 sec bins |
 |
 |
| Module-wise count rates for Quadrant C Data is divided into 100 sec bins |
 |
 |
| Module-wise count rates for Quadrant D Data is divided into 100 sec bins |
 |
 |
| Parameter | Plot |
|---|---|
| CZT HV Monitor | 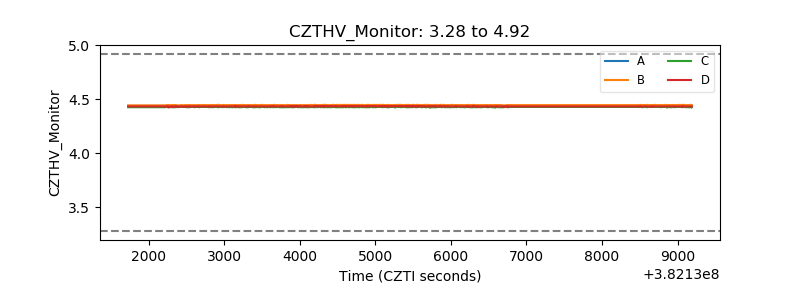 |
| D_VDD | 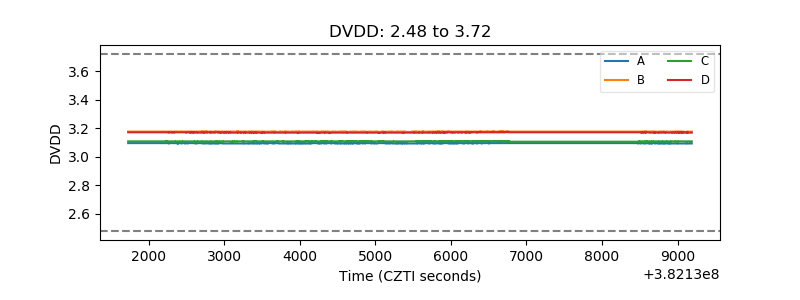 |
| Temperature 1 | 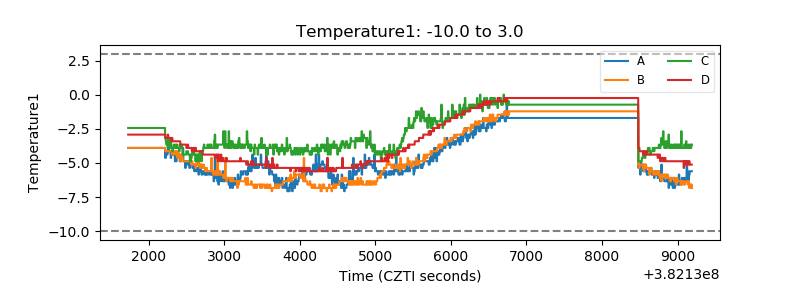 |
| Veto HV Monitor |  |
| Veto LLD | 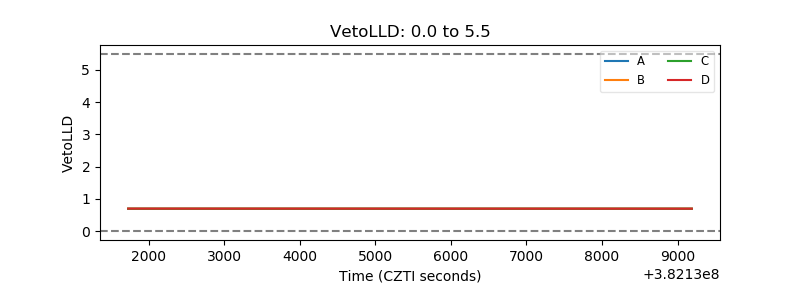 |
| Alpha Counter | 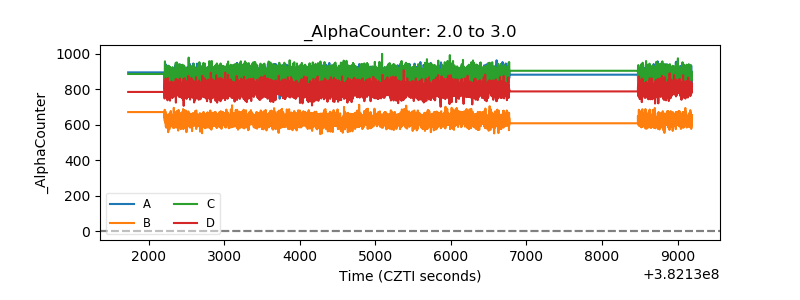 |
| _CPM_Rate | 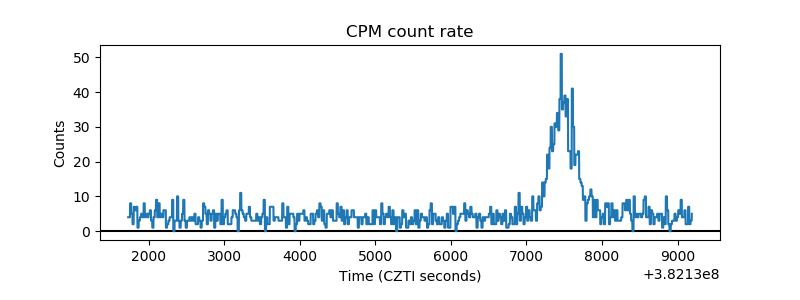 |
| CZT Counter | 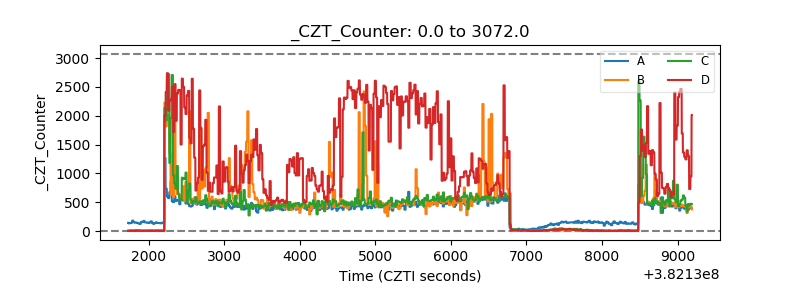 |
| +2.5 Volts monitor | 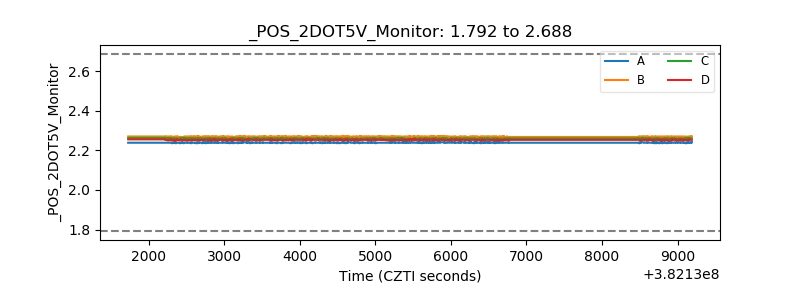 |
| +5 Volts monitor | 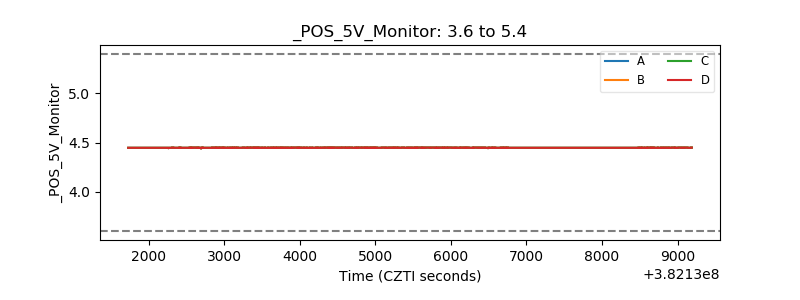 |
| _ROLL_ROT | 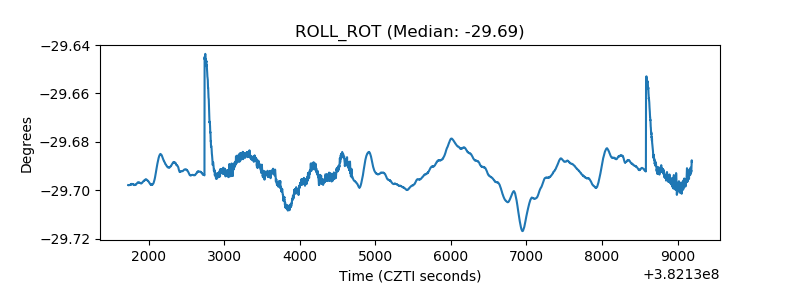 |
| _Roll_DEC | 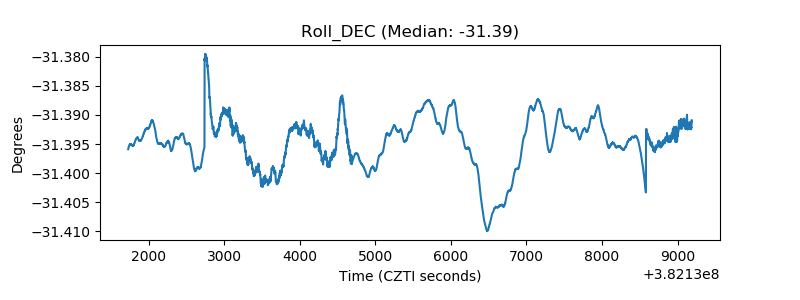 |
| _Roll_RA | 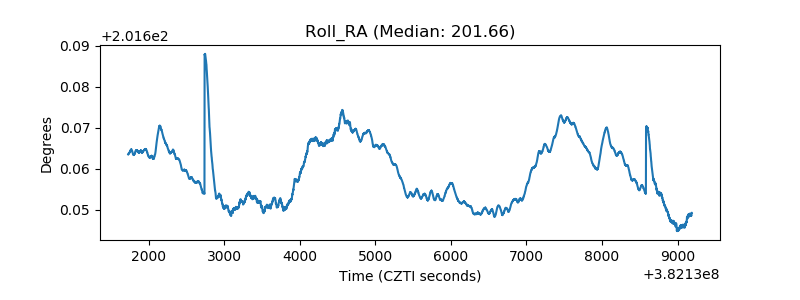 |
| Veto Counter | 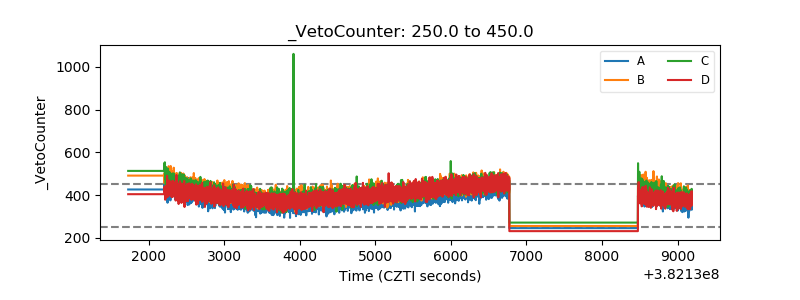 |