| Param | Original file | Final file |
|---|---|---|
| Filename | modeM0/AS1A10_058T05_9000004918_34439cztM0_level2.evt | modeM0/AS1A10_058T05_9000004918_34439cztM0_level2_quad_clean.evt |
| Size (bytes) | 542,649,600 | 87,793,920 |
| Size | 517.5 MB | 83.7 MB |
| Events in quadrant A | 2,388,351 | 606,174 |
| Events in quadrant B | 4,209,579 | 596,530 |
| Events in quadrant C | 2,914,687 | 589,184 |
| Events in quadrant D | 6,585,061 | 517,395 |
| Mode M9 | |||
|---|---|---|---|
| Quadrant | BADHDUFLAG | Total packets | Discarded packets |
| A | 0 | 21 | 0 |
| B | 0 | 21 | 0 |
| C | 0 | 21 | 0 |
| D | 0 | 22 | 0 |
| Mode M0 | |||
|---|---|---|---|
| Quadrant | BADHDUFLAG | Total packets | Discarded packets |
| A | 0 | 10223 | 3 |
| B | 0 | 15939 | 2 |
| C | 0 | 11498 | 2 |
| D | 0 | 23103 | 2 |
| Mode SS | |||
|---|---|---|---|
| Quadrant | BADHDUFLAG | Total packets | Discarded packets |
| A | 0 | 102 | 0 |
| B | 0 | 102 | 0 |
| C | 0 | 102 | 0 |
| D | 0 | 102 | 0 |
| Quadrant | Total seconds | Saturated seconds | Saturation percentage |
|---|---|---|---|
| A | 4976 | 5 | 0.100482% |
| B | 4976 | 307 | 6.169614% |
| C | 4976 | 143 | 2.873794% |
| D | 4976 | 820 | 16.479100% |
Noise dominated data is calculated using 1-second bins in cleaned event files. If a bin has >2000 counts, and if more than 50% of those come from <1% of pixels, then it is considered to be noise-dominated and hence unusable.
| Quadrant | # 1 sec bins | Bins with >0 counts | Bins with >2000 counts | High rate bins dominated by noise | Noise dominated (total time) | Noise dominated (detector-on time) | Marked lightcurve |
|---|---|---|---|---|---|---|---|
| A | 7009 | 4977 | 0 | 0 | 0.00% | 0.00% | 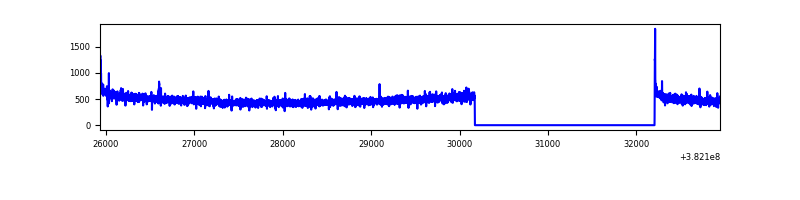 |
| B | 7009 | 4977 | 206 | 206 | 2.94% | 4.14% | 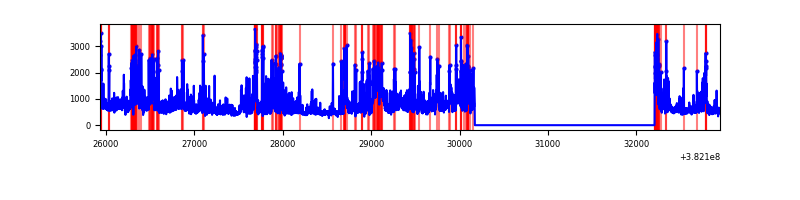 |
| C | 7009 | 4977 | 116 | 116 | 1.66% | 2.33% | 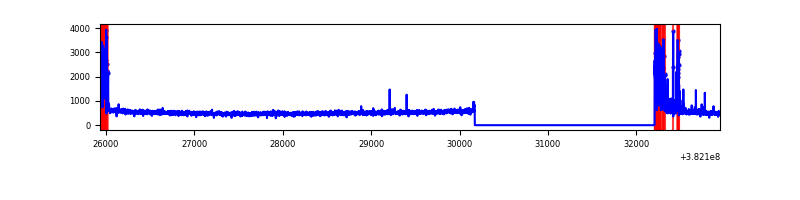 |
| D | 7009 | 4977 | 781 | 781 | 11.14% | 15.69% | 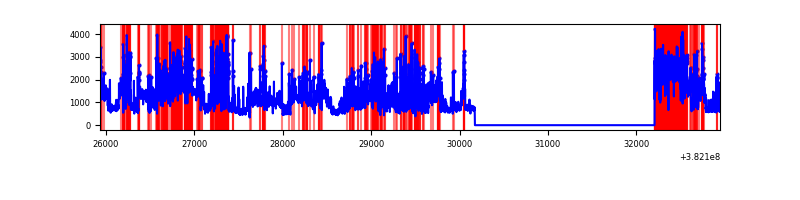 |
Top three noisy pixels from each quadrant. If the there are fewer than three noisy pixels in the level2.evt file, extra rows are filled as -1
| Pixel properties | Quadrant properties | ||||||
|---|---|---|---|---|---|---|---|
| Quadrant | DetID | PixID | Counts | Sigma | Mean | Median | Sigma |
| A | 10 | 83 | 36837 | 301.34 | 605 | 595 | 120.3 |
| A | 13 | 254 | 8204 | 63.27 | 605 | 595 | 120.3 |
| A | 3 | 137 | 5927 | 44.33 | 605 | 595 | 120.3 |
| B | 4 | 171 | 1697884 | 14886.68 | 594 | 580 | 114.0 |
| B | 5 | 172 | 105134 | 917.02 | 594 | 580 | 114.0 |
| B | 5 | 255 | 20233 | 172.37 | 594 | 580 | 114.0 |
| C | 0 | 10 | 262607 | 1957.2 | 578 | 585 | 133.9 |
| C | 15 | 214 | 207308 | 1544.14 | 578 | 585 | 133.9 |
| C | 4 | 254 | 152328 | 1133.46 | 578 | 585 | 133.9 |
| D | 8 | 195 | 1786398 | 13075.28 | 552 | 537 | 136.6 |
| D | 12 | 79 | 946289 | 6924.38 | 552 | 537 | 136.6 |
| D | 10 | 118 | 683434 | 4999.87 | 552 | 537 | 136.6 |
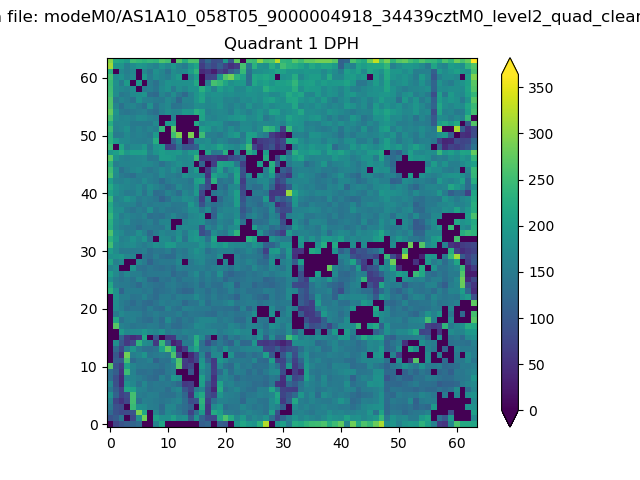
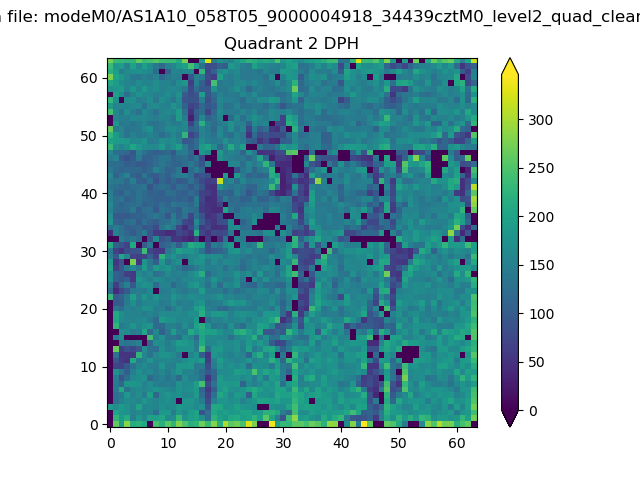
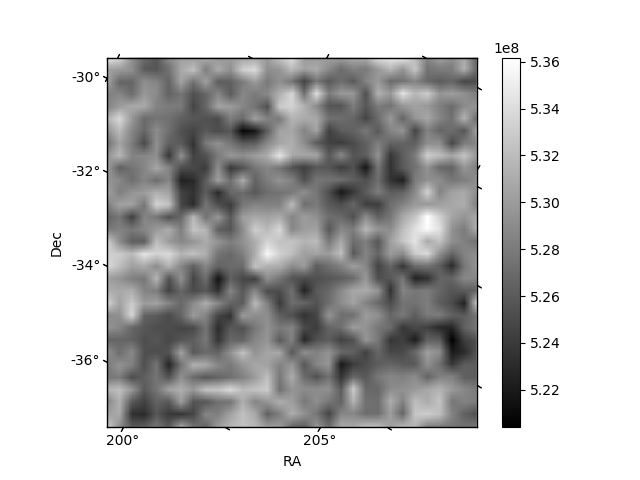
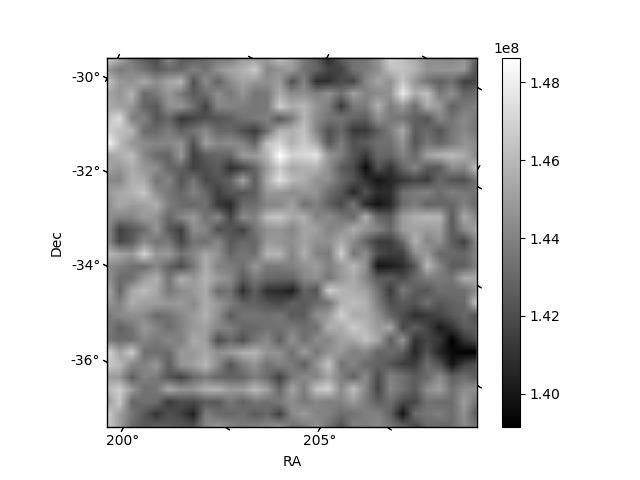
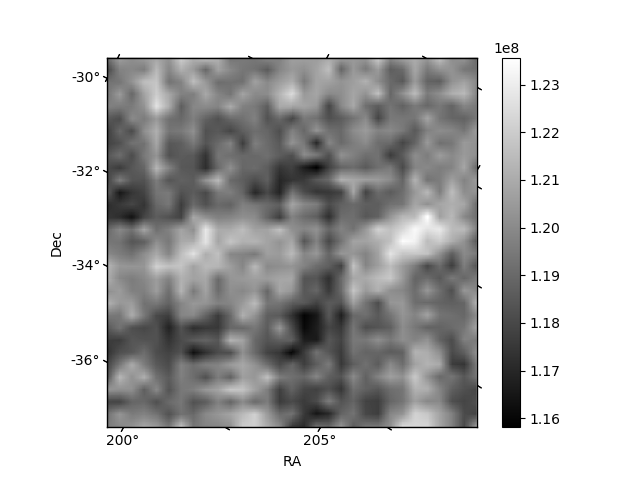
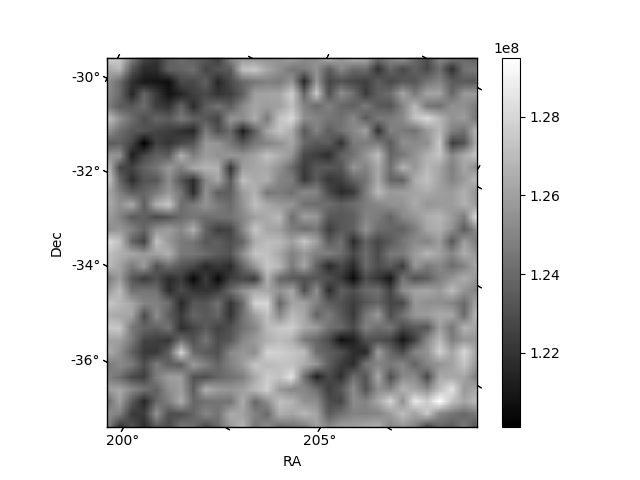
Histogram calculated using DETX and DETY for each event in the final _common_clean file
| Quadrant A |  |
 |
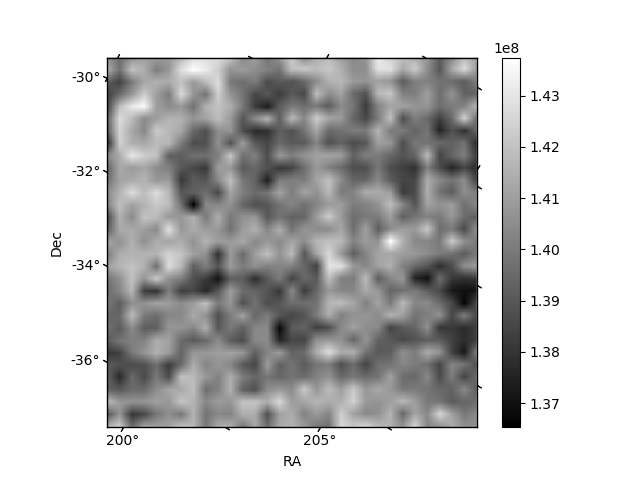
Quadrant B |
|---|---|---|---|
| Quadrant D | 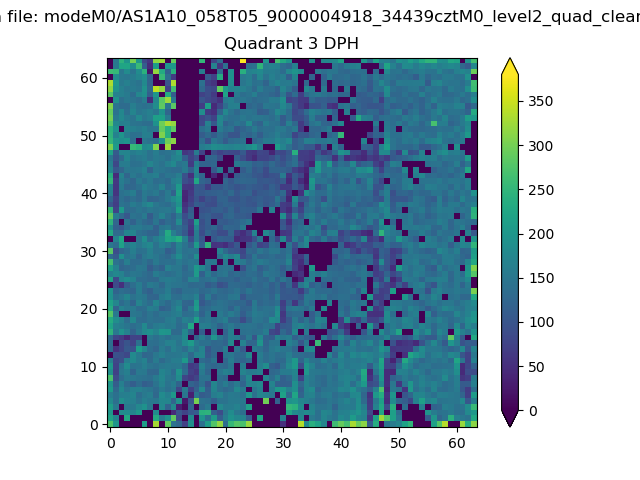 |
 |
Quadrant C |
| Plot type | Count rate plots | Images |
|---|---|---|
| Comparison with Poisson distribution Blue bars denote a histogram of data divided into 1 sec bins. Red curve is a Poisson curve with rate = median count rate of data. |
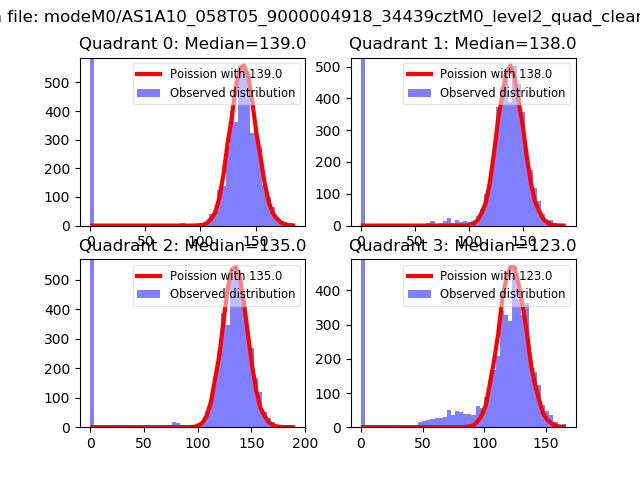 |
 |
| Quadrant-wise count rates Data is divided into 100 sec bins |
 |
|
| Module-wise count rates for Quadrant A Data is divided into 100 sec bins |
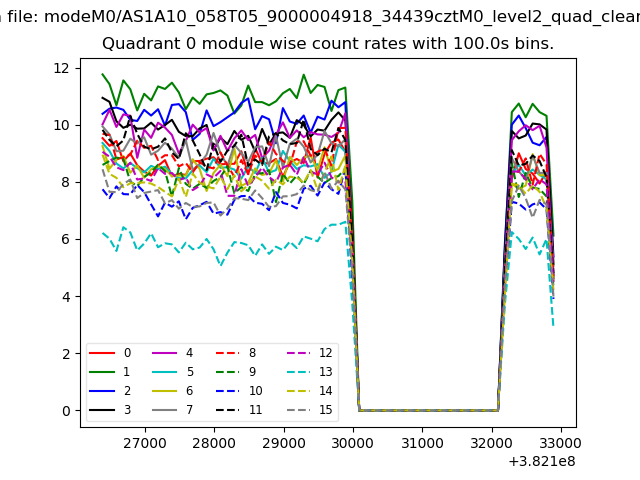 |
 |
| Module-wise count rates for Quadrant B Data is divided into 100 sec bins |
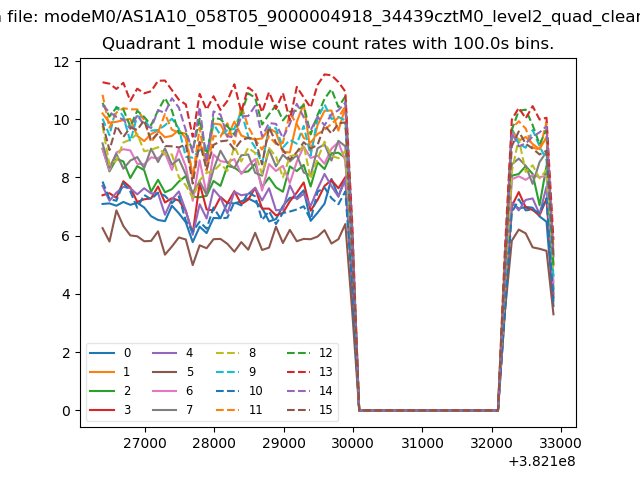 |
 |
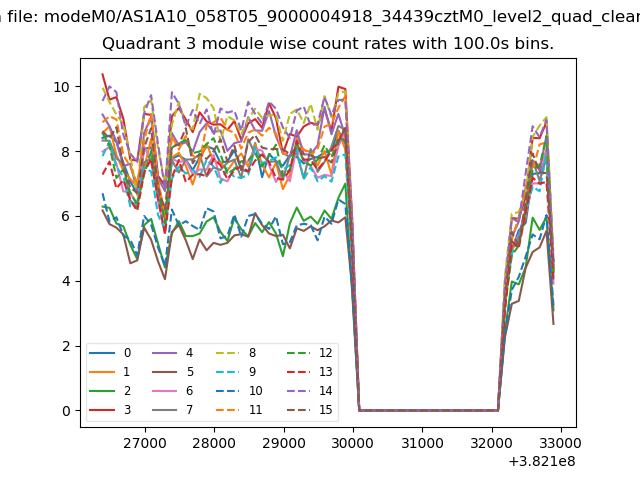
| Module-wise count rates for Quadrant C Data is divided into 100 sec bins |
 |
 |
| Module-wise count rates for Quadrant D Data is divided into 100 sec bins |
 |
 |
| Parameter | Plot |
|---|---|
| CZT HV Monitor | 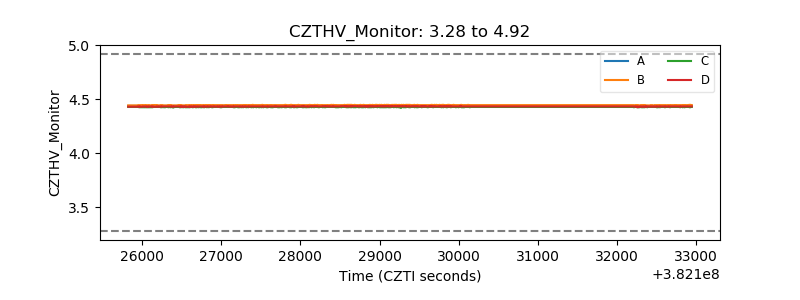 |
| D_VDD | 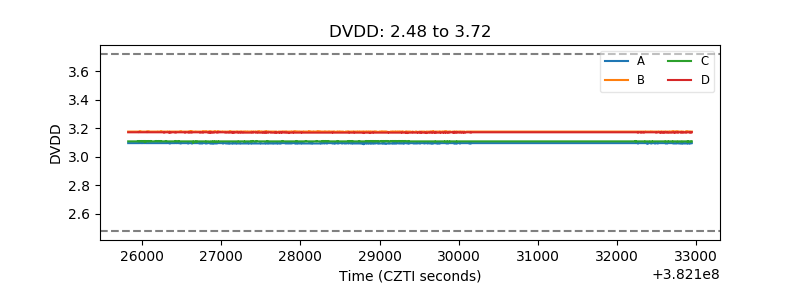 |
| Temperature 1 |  |
| Veto HV Monitor | 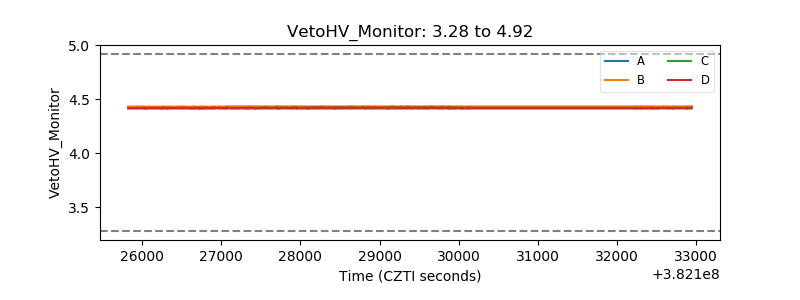 |
| Veto LLD | 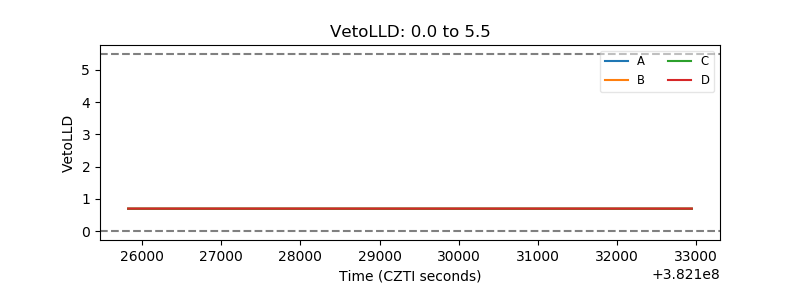 |
| Alpha Counter | 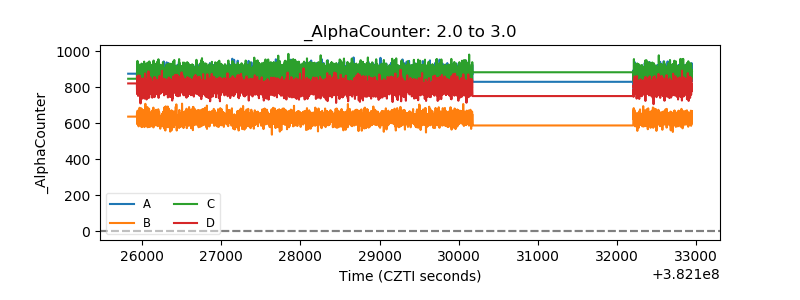 |
| _CPM_Rate | 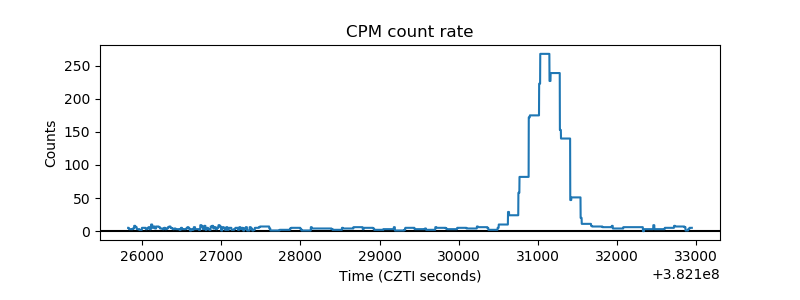 |
| CZT Counter | 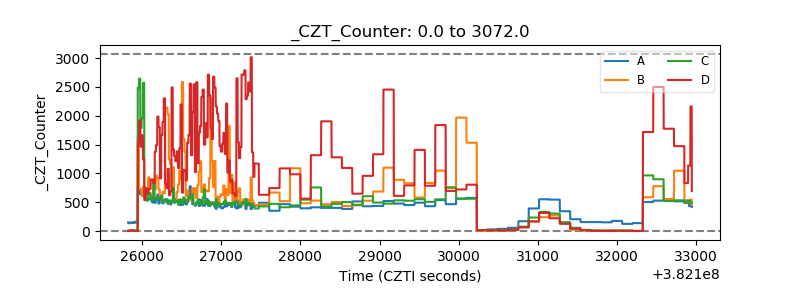 |
| +2.5 Volts monitor | 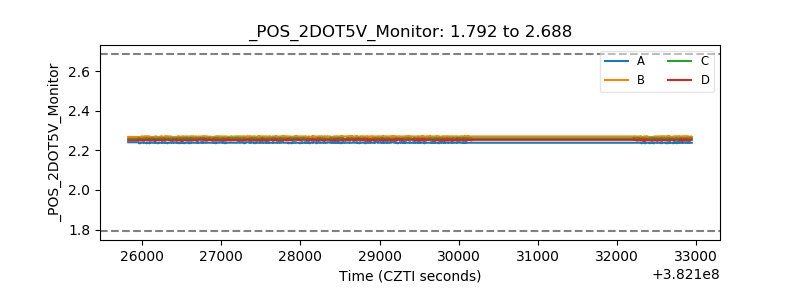 |
| +5 Volts monitor | 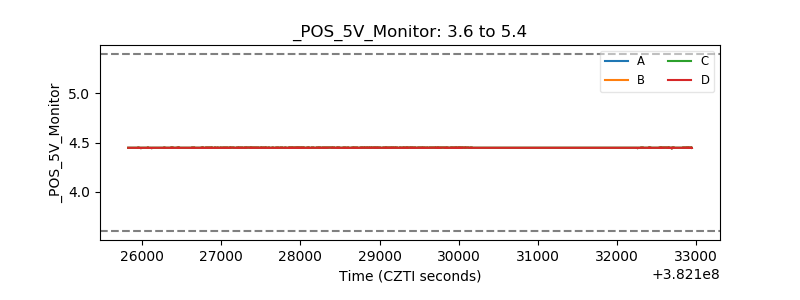 |
| _ROLL_ROT | 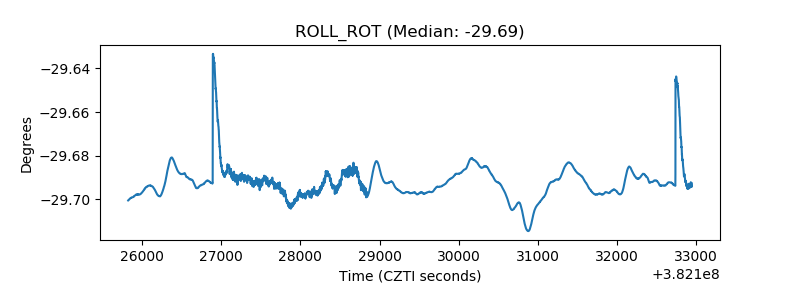 |
| _Roll_DEC | 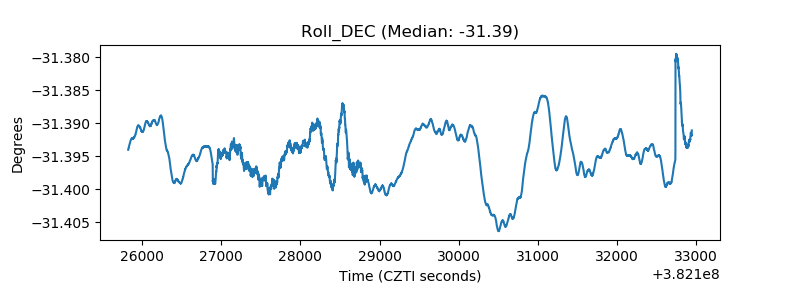 |
| _Roll_RA | 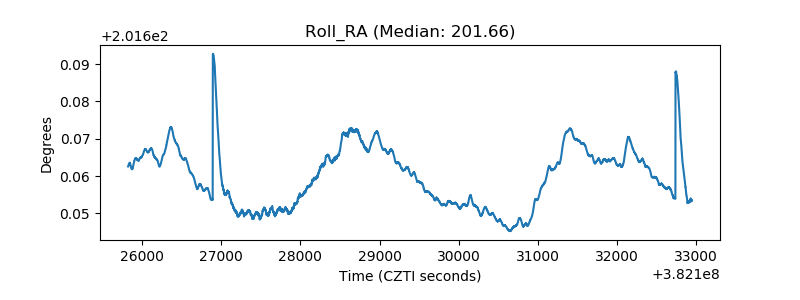 |
| Veto Counter | 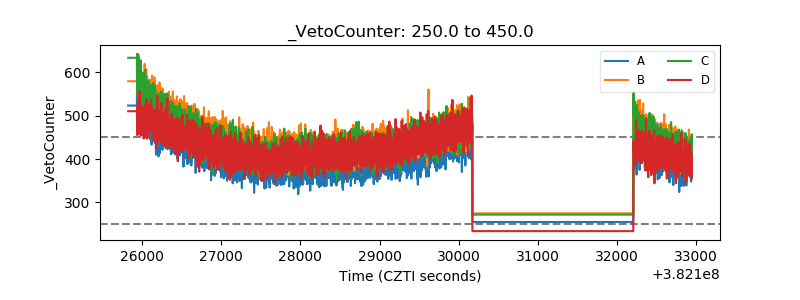 |