| Param | Original file | Final file |
|---|---|---|
| Filename | modeM0/AS1A10_058T05_9000004918_34438cztM0_level2.evt | modeM0/AS1A10_058T05_9000004918_34438cztM0_level2_quad_clean.evt |
| Size (bytes) | 476,945,280 | 77,679,360 |
| Size | 454.9 MB | 74.1 MB |
| Events in quadrant A | 2,491,917 | 521,608 |
| Events in quadrant B | 3,721,111 | 517,012 |
| Events in quadrant C | 2,801,170 | 506,020 |
| Events in quadrant D | 5,101,239 | 466,719 |
| Mode M9 | |||
|---|---|---|---|
| Quadrant | BADHDUFLAG | Total packets | Discarded packets |
| A | 0 | 22 | 0 |
| B | 0 | 22 | 0 |
| C | 0 | 22 | 0 |
| D | 0 | 22 | 0 |
| Mode M0 | |||
|---|---|---|---|
| Quadrant | BADHDUFLAG | Total packets | Discarded packets |
| A | 0 | 10311 | 3 |
| B | 0 | 14292 | 2 |
| C | 0 | 11062 | 2 |
| D | 0 | 18558 | 2 |
| Mode SS | |||
|---|---|---|---|
| Quadrant | BADHDUFLAG | Total packets | Discarded packets |
| A | 0 | 98 | 0 |
| B | 0 | 98 | 0 |
| C | 0 | 98 | 0 |
| D | 0 | 98 | 0 |
| Quadrant | Total seconds | Saturated seconds | Saturation percentage |
|---|---|---|---|
| A | 4863 | 7 | 0.143944% |
| B | 4863 | 258 | 5.305367% |
| C | 4863 | 91 | 1.871273% |
| D | 4863 | 193 | 3.968744% |
Noise dominated data is calculated using 1-second bins in cleaned event files. If a bin has >2000 counts, and if more than 50% of those come from <1% of pixels, then it is considered to be noise-dominated and hence unusable.
| Quadrant | # 1 sec bins | Bins with >0 counts | Bins with >2000 counts | High rate bins dominated by noise | Noise dominated (total time) | Noise dominated (detector-on time) | Marked lightcurve |
|---|---|---|---|---|---|---|---|
| A | 7016 | 4864 | 0 | 0 | 0.00% | 0.00% | 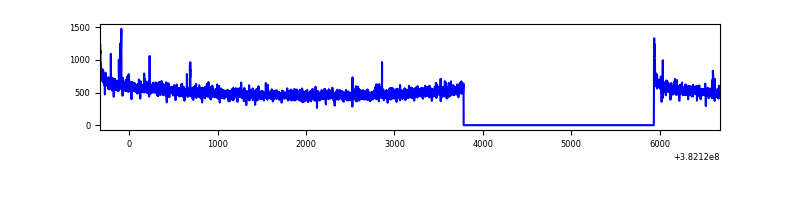 |
| B | 7016 | 4864 | 177 | 177 | 2.52% | 3.64% | 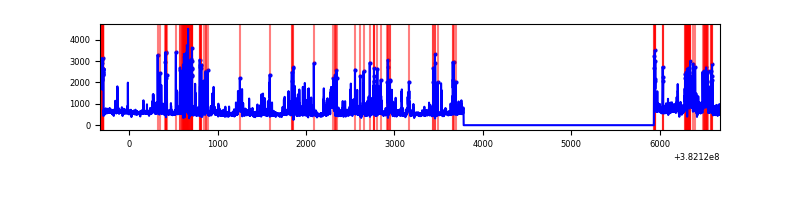 |
| C | 7016 | 4864 | 77 | 77 | 1.10% | 1.58% | 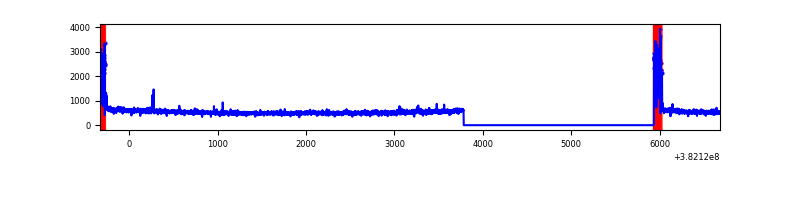 |
| D | 7016 | 4864 | 178 | 178 | 2.54% | 3.66% | 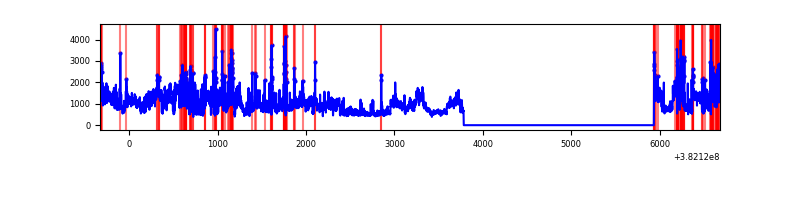 |
Top three noisy pixels from each quadrant. If the there are fewer than three noisy pixels in the level2.evt file, extra rows are filled as -1
| Pixel properties | Quadrant properties | ||||||
|---|---|---|---|---|---|---|---|
| Quadrant | DetID | PixID | Counts | Sigma | Mean | Median | Sigma |
| A | 10 | 83 | 37294 | 294.61 | 628 | 620 | 124.5 |
| A | 9 | 143 | 20115 | 156.61 | 628 | 620 | 124.5 |
| A | 13 | 6 | 9188 | 68.83 | 628 | 620 | 124.5 |
| B | 4 | 171 | 1013451 | 8844.46 | 612 | 599 | 114.5 |
| B | 5 | 172 | 216838 | 1888.25 | 612 | 599 | 114.5 |
| B | 15 | 85 | 27328 | 233.4 | 612 | 599 | 114.5 |
| C | 0 | 10 | 238464 | 1726.46 | 596 | 605 | 137.8 |
| C | 15 | 214 | 203630 | 1473.62 | 596 | 605 | 137.8 |
| C | 14 | 67 | 12853 | 88.9 | 596 | 605 | 137.8 |
| D | 8 | 195 | 1356149 | 9506.03 | 588 | 575 | 142.6 |
| D | 7 | 223 | 737582 | 5168.3 | 588 | 575 | 142.6 |
| D | 12 | 79 | 437586 | 3064.56 | 588 | 575 | 142.6 |
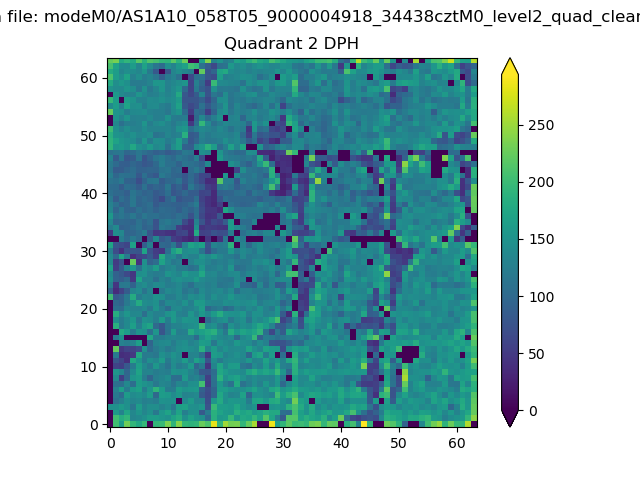
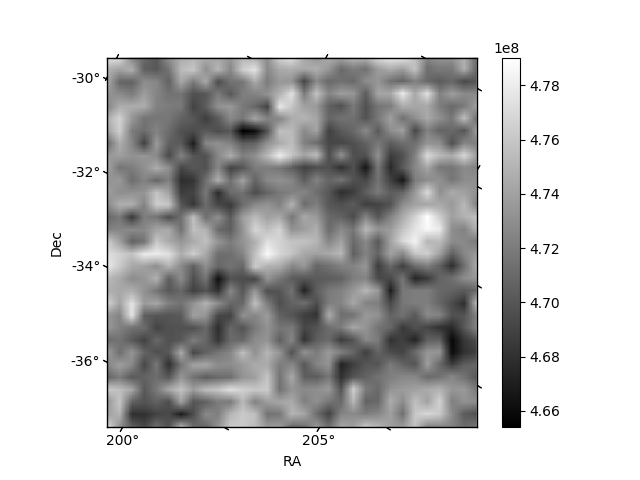
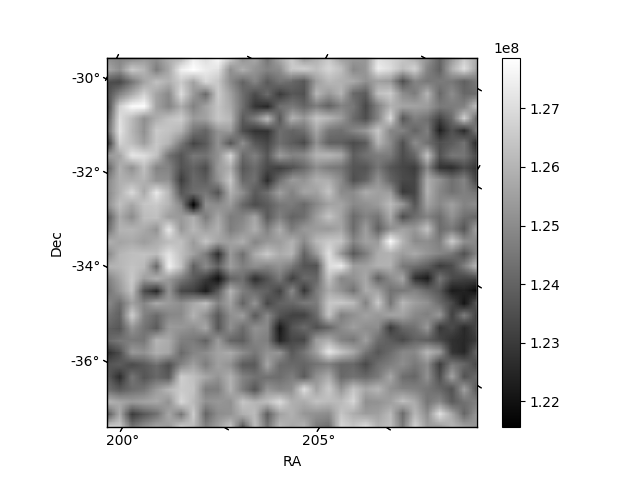
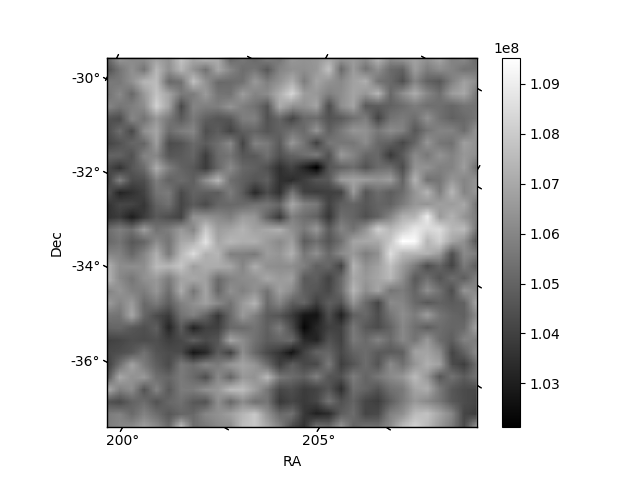
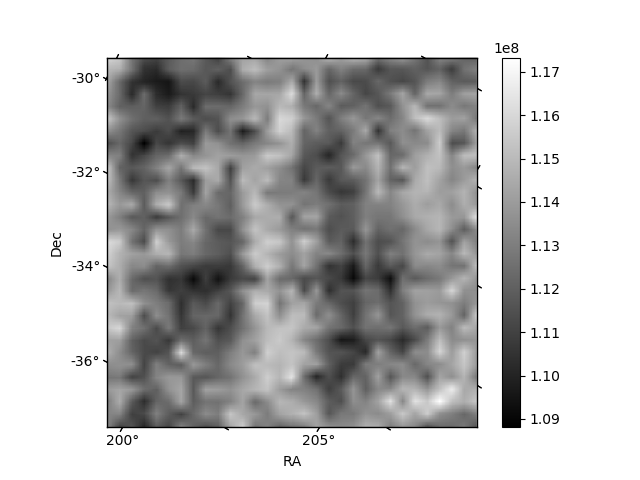
Histogram calculated using DETX and DETY for each event in the final _common_clean file
| Quadrant A | 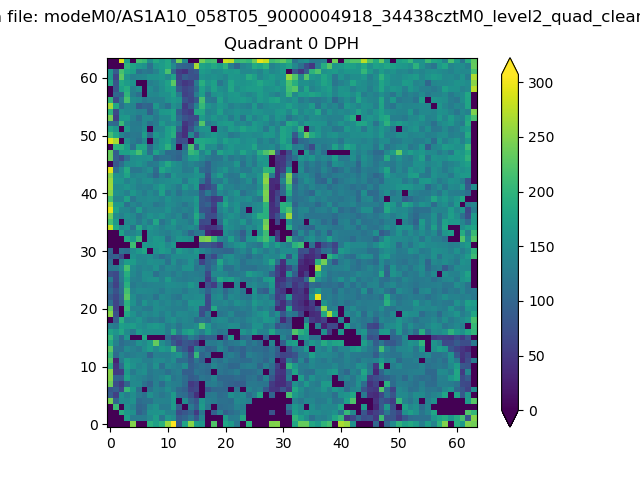 |
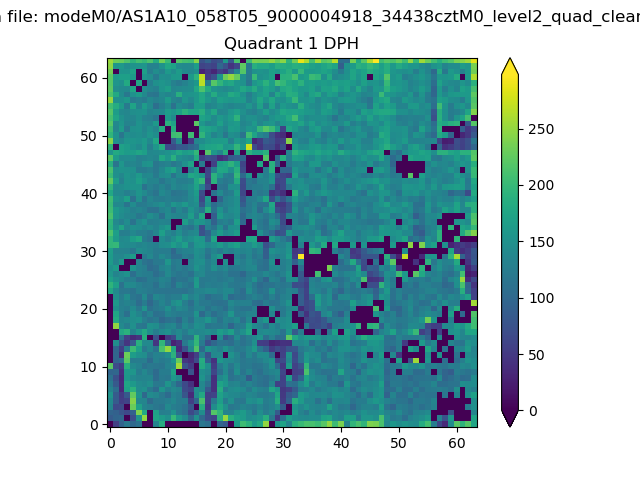 |
Quadrant B |
|---|---|---|---|
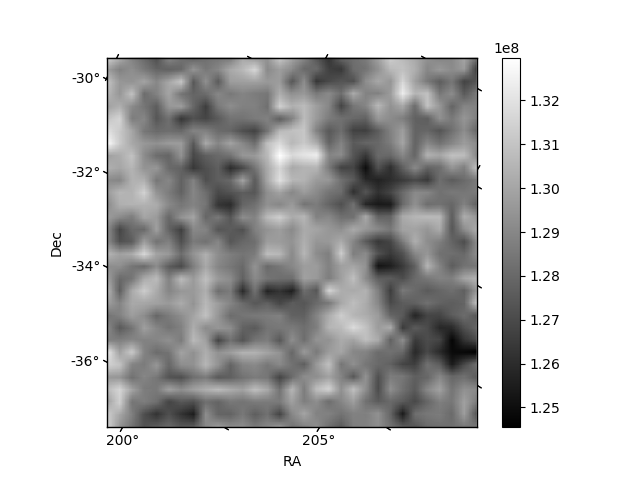
| Quadrant D | 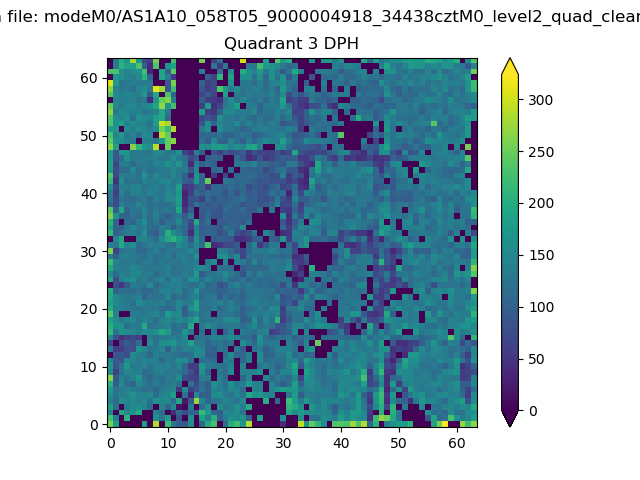 |
 |
Quadrant C |
| Plot type | Count rate plots | Images |
|---|---|---|
| Comparison with Poisson distribution Blue bars denote a histogram of data divided into 1 sec bins. Red curve is a Poisson curve with rate = median count rate of data. |
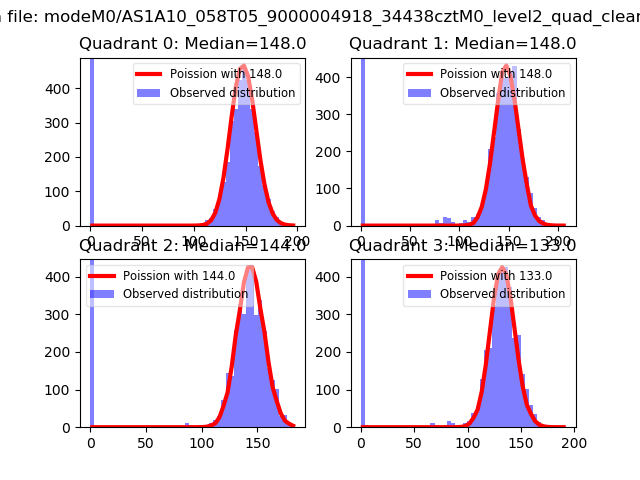 |
 |
| Quadrant-wise count rates Data is divided into 100 sec bins |
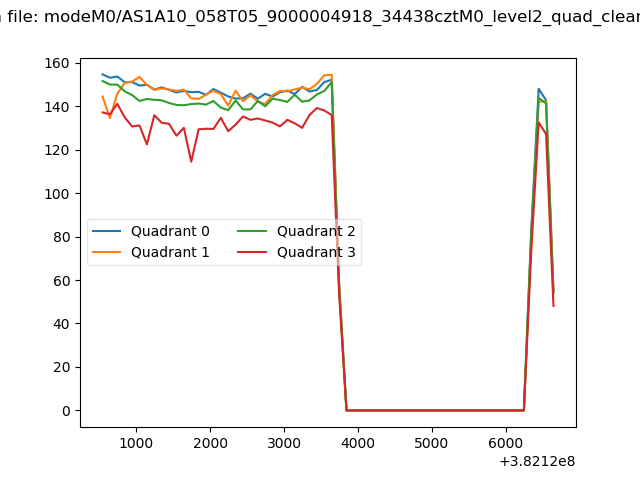 |
|
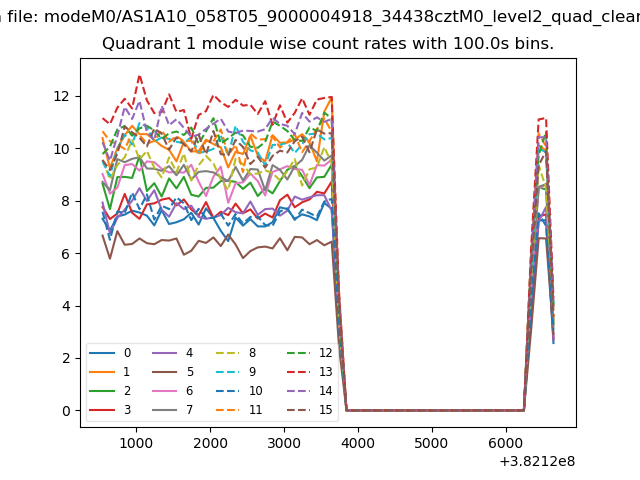
| Module-wise count rates for Quadrant A Data is divided into 100 sec bins |
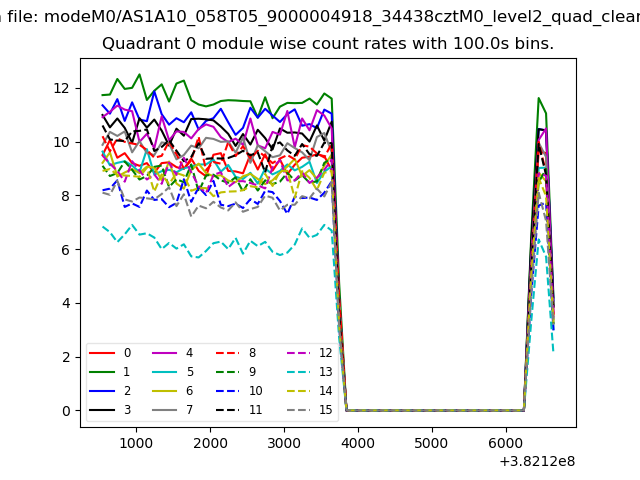 |
 |
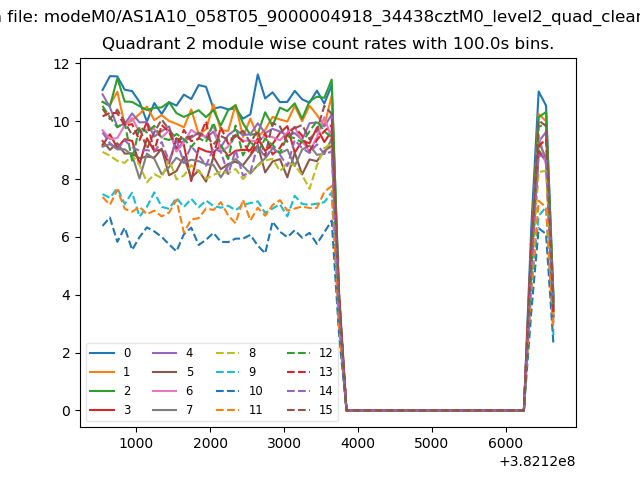
| Module-wise count rates for Quadrant B Data is divided into 100 sec bins |
 |
 |
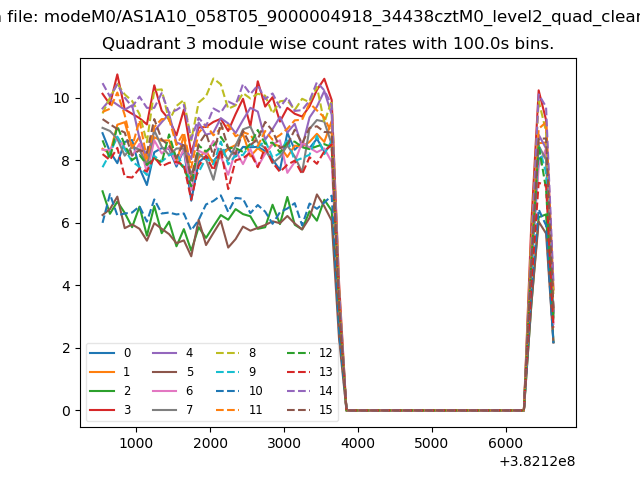
| Module-wise count rates for Quadrant C Data is divided into 100 sec bins |
 |
 |
| Module-wise count rates for Quadrant D Data is divided into 100 sec bins |
 |
 |
| Parameter | Plot |
|---|---|
| CZT HV Monitor | 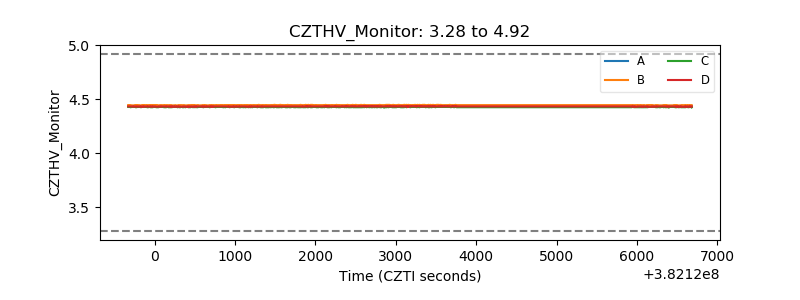 |
| D_VDD | 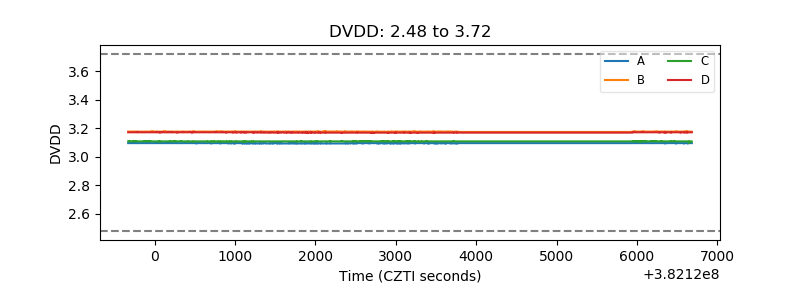 |
| Temperature 1 | 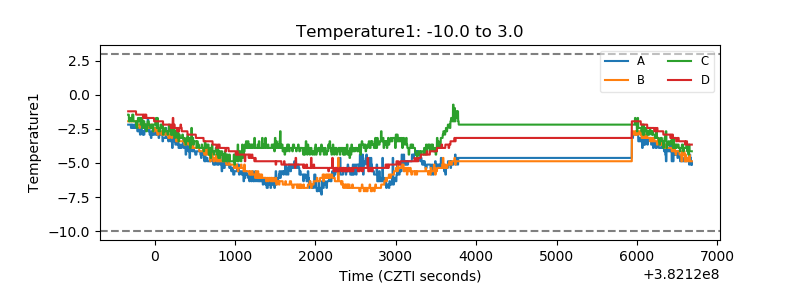 |
| Veto HV Monitor | 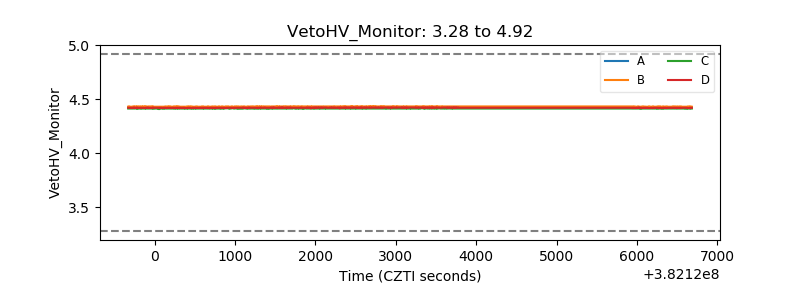 |
| Veto LLD | 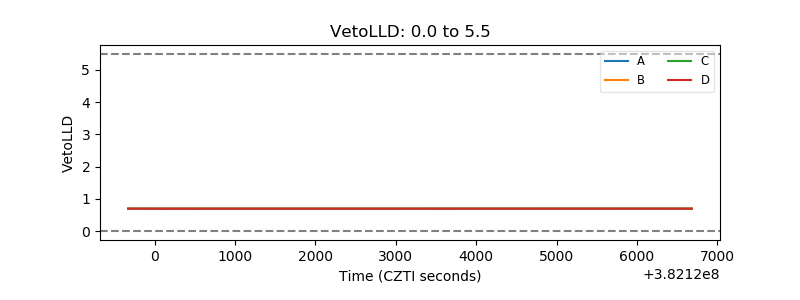 |
| Alpha Counter | 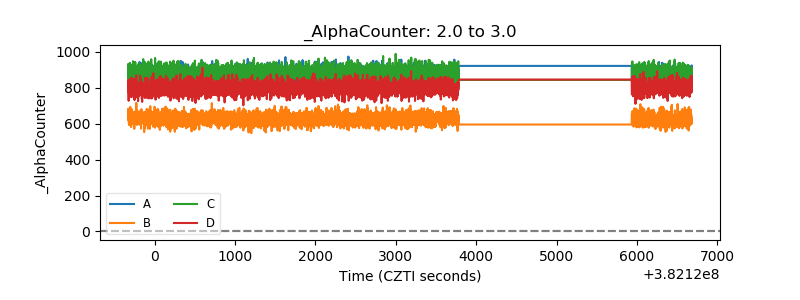 |
| _CPM_Rate | 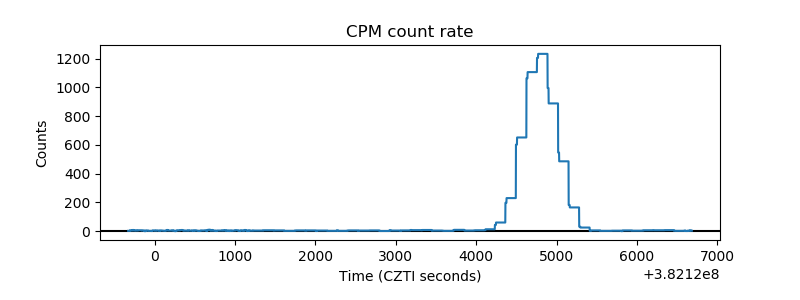 |
| CZT Counter | 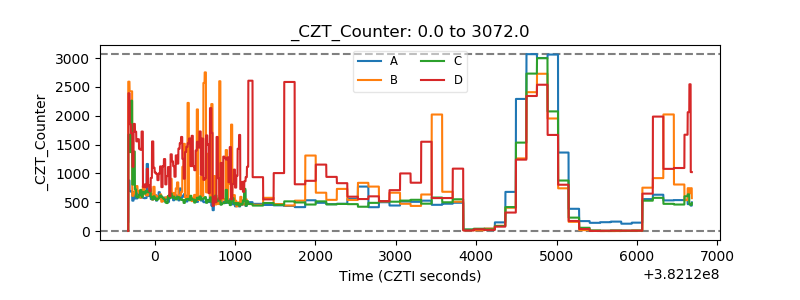 |
| +2.5 Volts monitor | 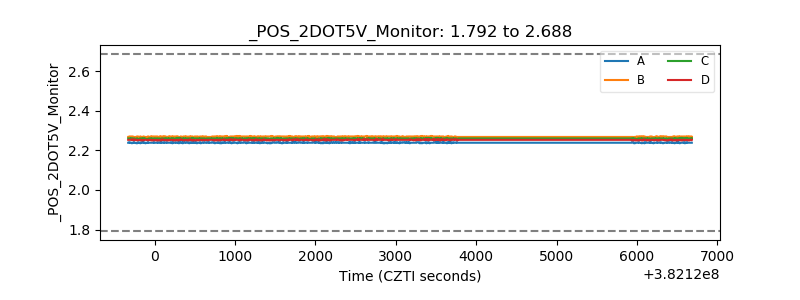 |
| +5 Volts monitor | 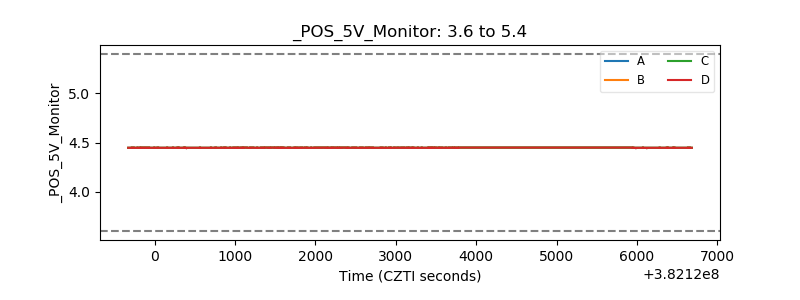 |
| _ROLL_ROT | 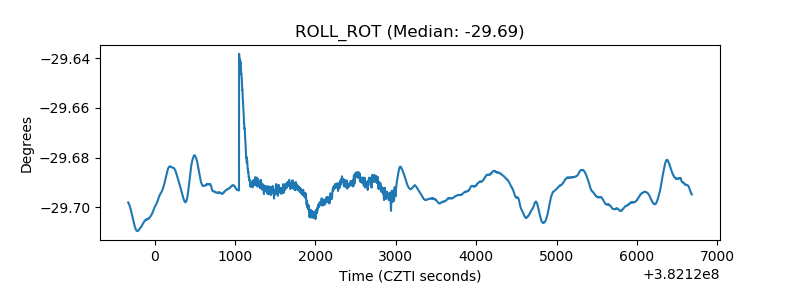 |
| _Roll_DEC | 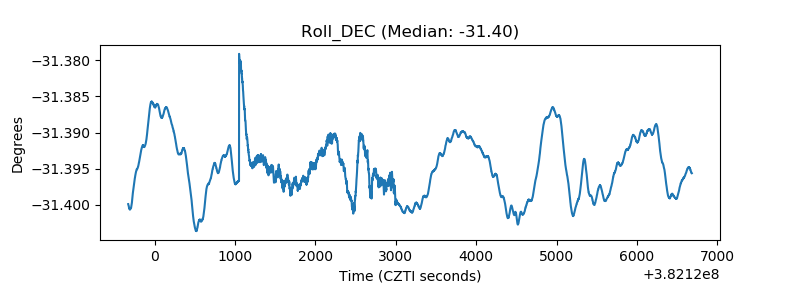 |
| _Roll_RA | 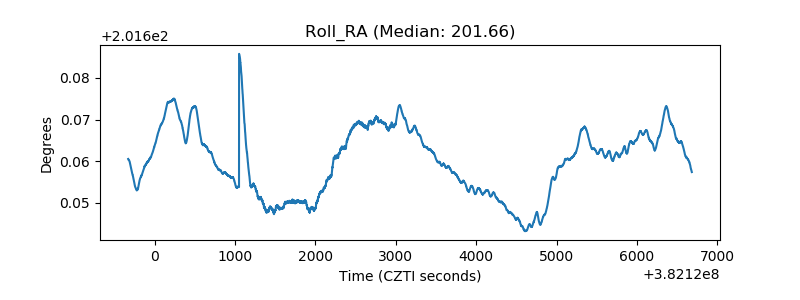 |
| Veto Counter | 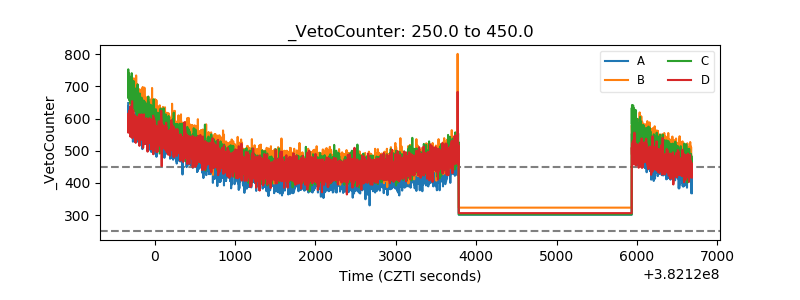 |