| Param | Original file | Final file |
|---|---|---|
| Filename | modeM0/AS1A10_058T05_9000004918_34435cztM0_level2.evt | modeM0/AS1A10_058T05_9000004918_34435cztM0_level2_quad_clean.evt |
| Size (bytes) | 683,933,760 | 49,746,240 |
| Size | 652.3 MB | 47.4 MB |
| Events in quadrant A | 2,886,076 | 304,502 |
| Events in quadrant B | 4,740,553 | 299,378 |
| Events in quadrant C | 3,289,890 | 298,560 |
| Events in quadrant D | 9,425,213 | 218,651 |
| Mode M9 | |||
|---|---|---|---|
| Quadrant | BADHDUFLAG | Total packets | Discarded packets |
| A | 0 | 23 | 0 |
| B | 0 | 23 | 0 |
| C | 0 | 23 | 0 |
| D | 0 | 24 | 0 |
| Mode M0 | |||
|---|---|---|---|
| Quadrant | BADHDUFLAG | Total packets | Discarded packets |
| A | 0 | 11961 | 3 |
| B | 0 | 17636 | 2 |
| C | 0 | 13113 | 2 |
| D | 0 | 31829 | 2 |
| Mode SS | |||
|---|---|---|---|
| Quadrant | BADHDUFLAG | Total packets | Discarded packets |
| A | 0 | 110 | 0 |
| B | 0 | 110 | 0 |
| C | 0 | 110 | 0 |
| D | 0 | 110 | 0 |
| Quadrant | Total seconds | Saturated seconds | Saturation percentage |
|---|---|---|---|
| A | 5496 | 13 | 0.236536% |
| B | 5496 | 669 | 12.172489% |
| C | 5496 | 75 | 1.364629% |
| D | 5496 | 2730 | 49.672489% |
Noise dominated data is calculated using 1-second bins in cleaned event files. If a bin has >2000 counts, and if more than 50% of those come from <1% of pixels, then it is considered to be noise-dominated and hence unusable.
| Quadrant | # 1 sec bins | Bins with >0 counts | Bins with >2000 counts | High rate bins dominated by noise | Noise dominated (total time) | Noise dominated (detector-on time) | Marked lightcurve |
|---|---|---|---|---|---|---|---|
| A | 7439 | 5497 | 1 | 1 | 0.01% | 0.02% | 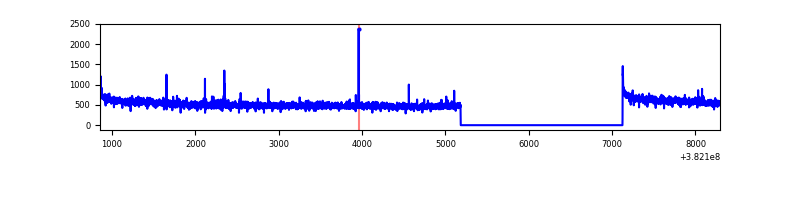 |
| B | 7439 | 5497 | 469 | 469 | 6.30% | 8.53% | 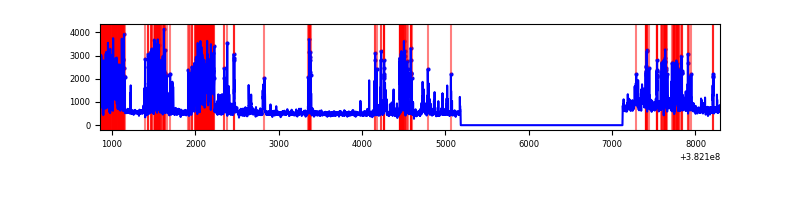 |
| C | 7439 | 5497 | 52 | 52 | 0.70% | 0.95% | 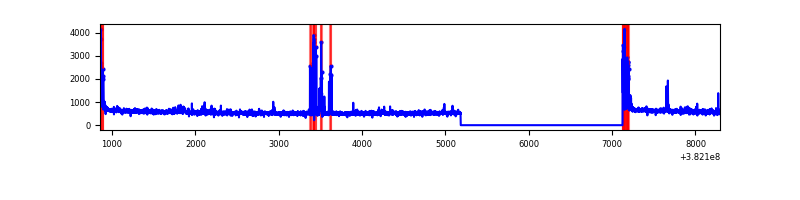 |
| D | 7439 | 5497 | 2181 | 2181 | 29.32% | 39.68% | 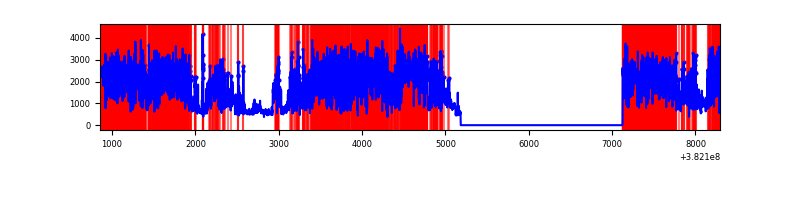 |
Top three noisy pixels from each quadrant. If the there are fewer than three noisy pixels in the level2.evt file, extra rows are filled as -1
| Pixel properties | Quadrant properties | ||||||
|---|---|---|---|---|---|---|---|
| Quadrant | DetID | PixID | Counts | Sigma | Mean | Median | Sigma |
| A | 10 | 83 | 37698 | 256.58 | 730 | 718 | 144.1 |
| A | 13 | 6 | 14876 | 98.23 | 730 | 718 | 144.1 |
| A | 13 | 254 | 8783 | 55.96 | 730 | 718 | 144.1 |
| B | 5 | 172 | 1620975 | 12781.6 | 683 | 668 | 126.8 |
| B | 0 | 190 | 249859 | 1965.71 | 683 | 668 | 126.8 |
| B | 15 | 222 | 70420 | 550.23 | 683 | 668 | 126.8 |
| C | 15 | 214 | 229966 | 1428.97 | 699 | 707 | 160.4 |
| C | 0 | 10 | 142296 | 882.52 | 699 | 707 | 160.4 |
| C | 14 | 254 | 98225 | 607.83 | 699 | 707 | 160.4 |
| D | 10 | 118 | 5555656 | 40060.44 | 562 | 546 | 138.7 |
| D | 8 | 195 | 951902 | 6860.66 | 562 | 546 | 138.7 |
| D | 13 | 249 | 122633 | 880.43 | 562 | 546 | 138.7 |
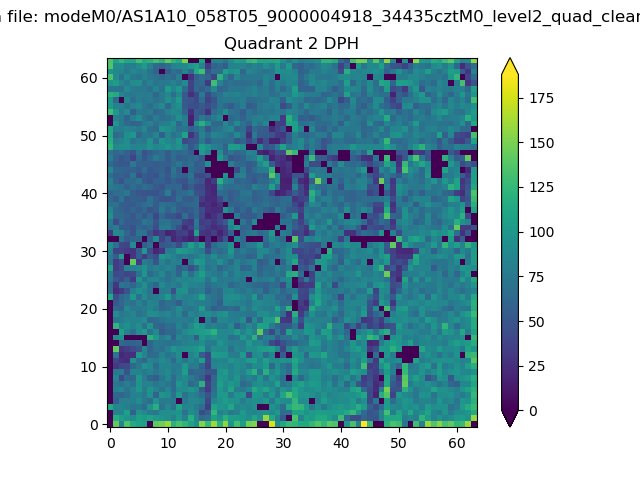
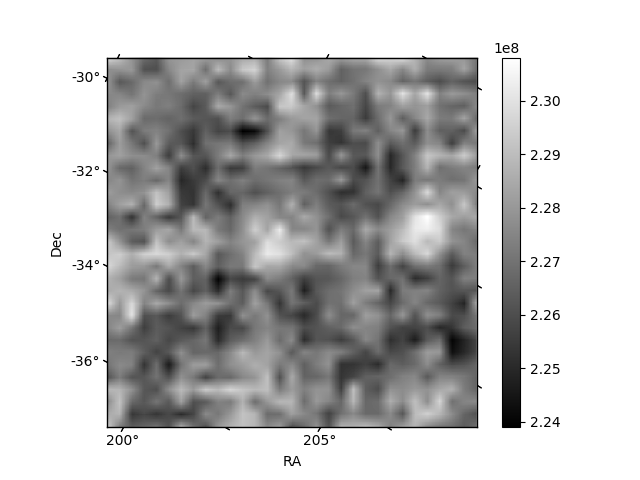
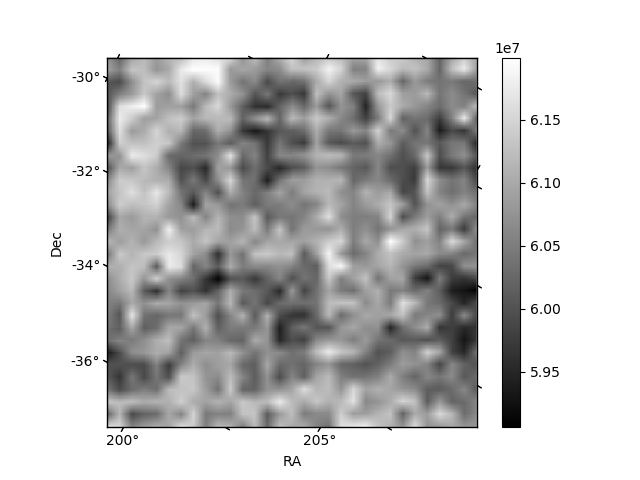
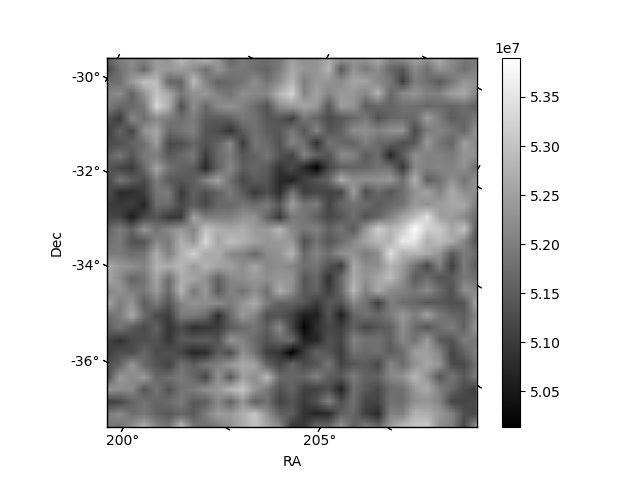
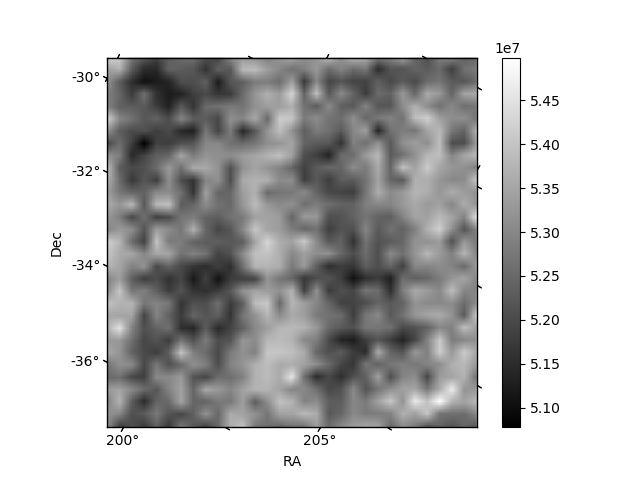
Histogram calculated using DETX and DETY for each event in the final _common_clean file
| Quadrant A | 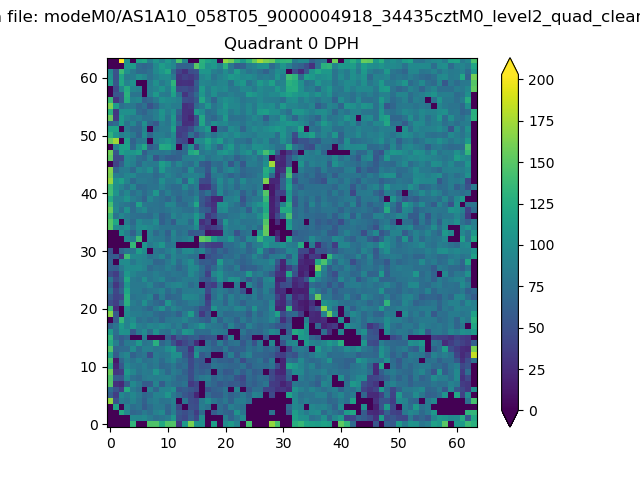 |
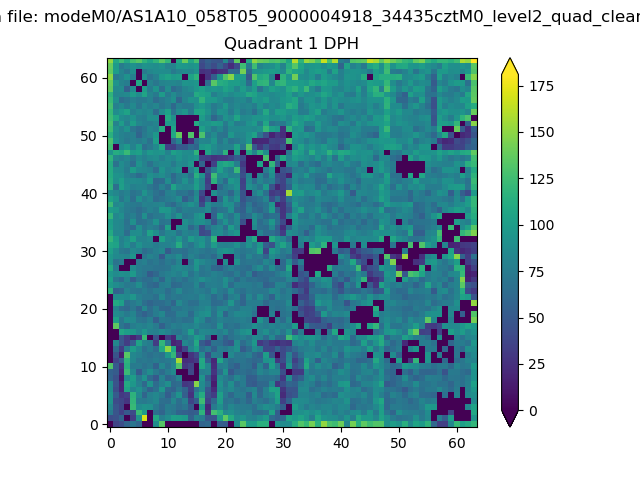 |
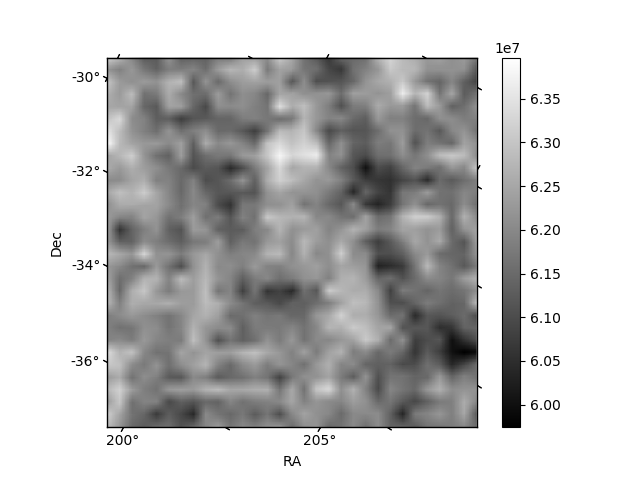
Quadrant B |
|---|---|---|---|
| Quadrant D | 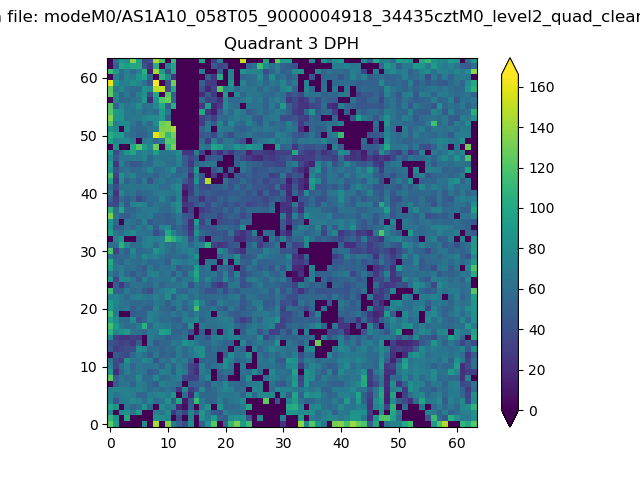 |
 |
Quadrant C |
| Plot type | Count rate plots | Images |
|---|---|---|
| Comparison with Poisson distribution Blue bars denote a histogram of data divided into 1 sec bins. Red curve is a Poisson curve with rate = median count rate of data. |
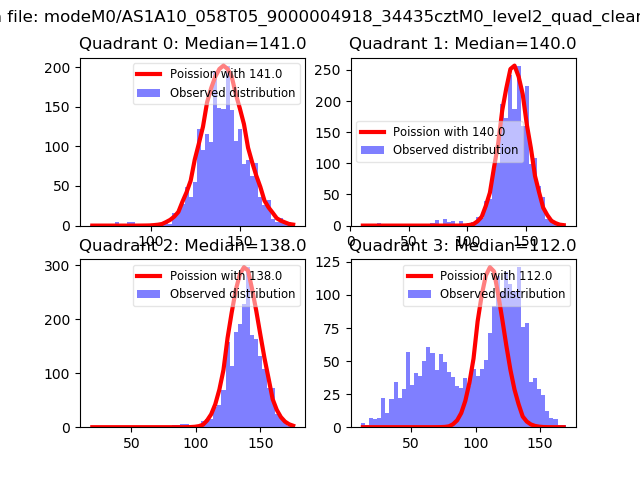 |
 |
| Quadrant-wise count rates Data is divided into 100 sec bins |
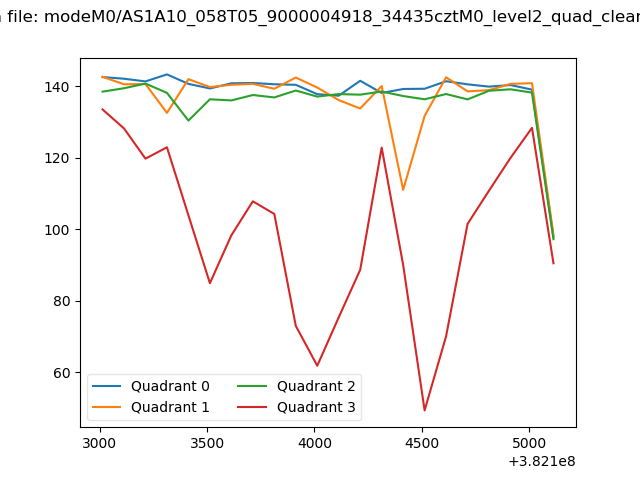 |
|
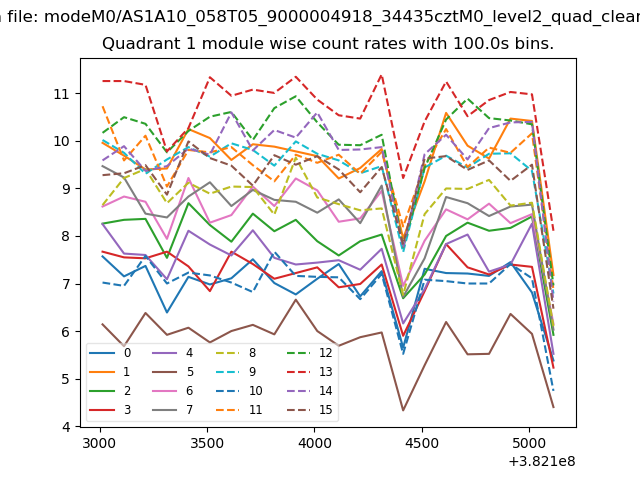
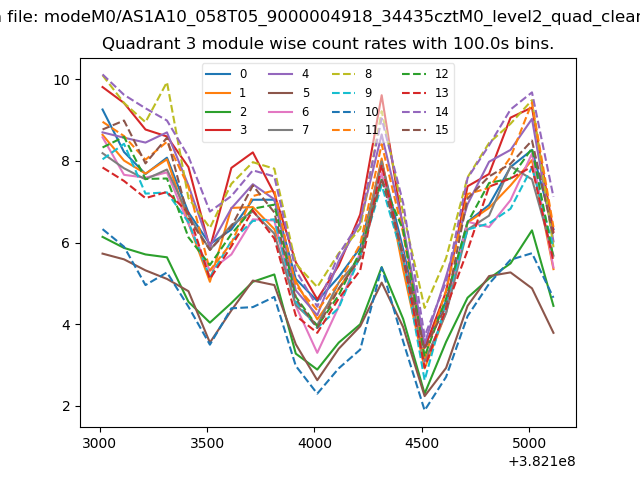
| Module-wise count rates for Quadrant A Data is divided into 100 sec bins |
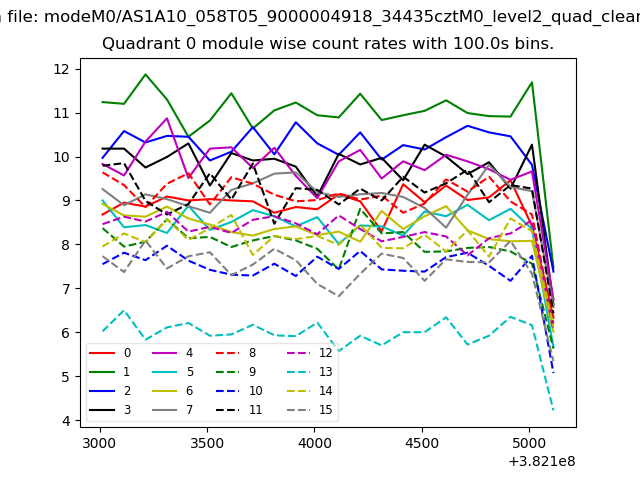 |
 |
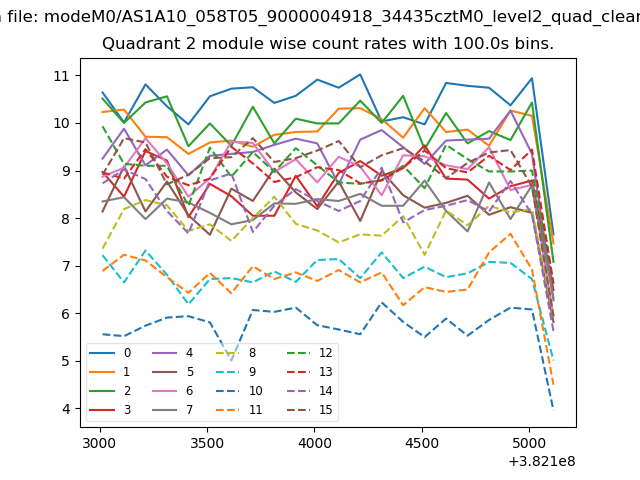
| Module-wise count rates for Quadrant B Data is divided into 100 sec bins |
 |
 |
| Module-wise count rates for Quadrant C Data is divided into 100 sec bins |
 |
 |
| Module-wise count rates for Quadrant D Data is divided into 100 sec bins |
 |
 |
| Parameter | Plot |
|---|---|
| CZT HV Monitor | 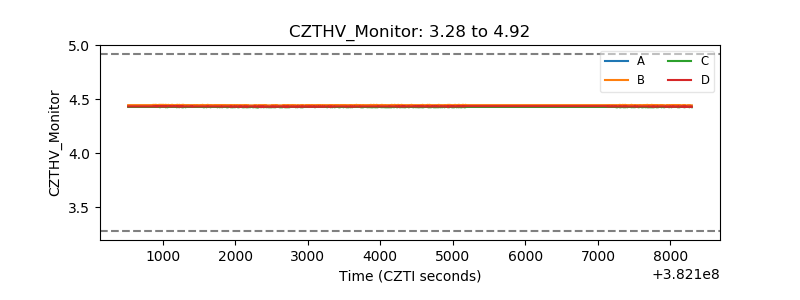 |
| D_VDD | 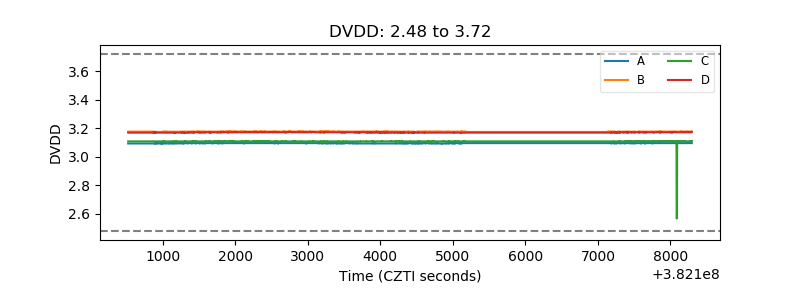 |
| Temperature 1 | 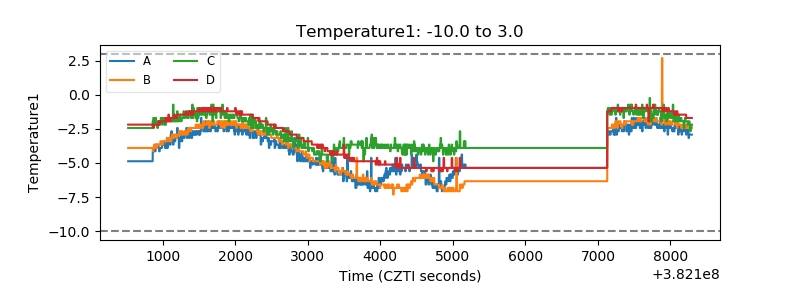 |
| Veto HV Monitor | 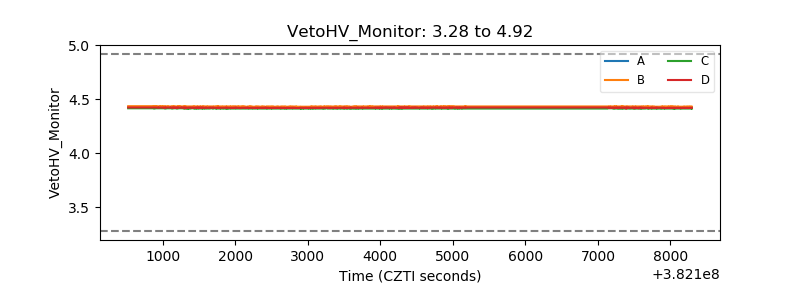 |
| Veto LLD | 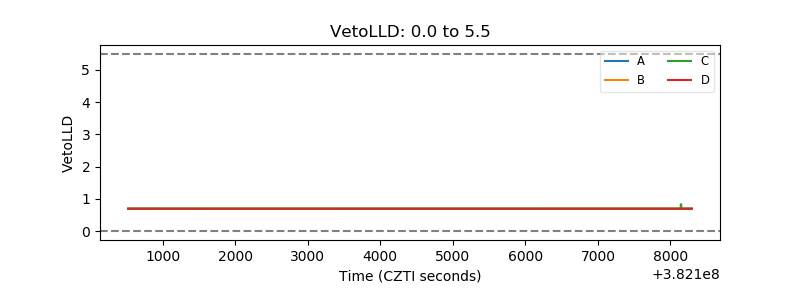 |
| Alpha Counter | 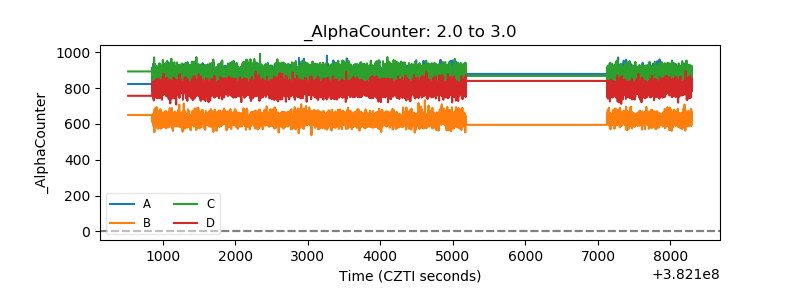 |
| _CPM_Rate | 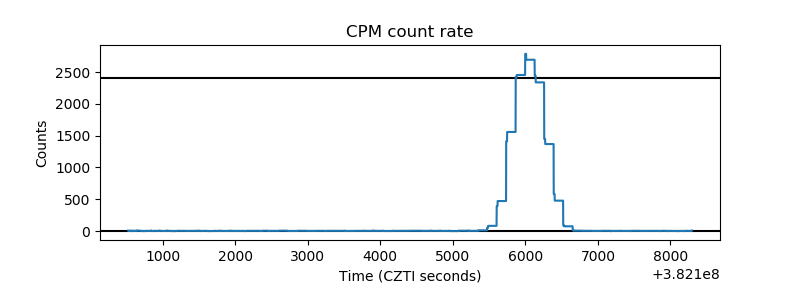 |
| CZT Counter | 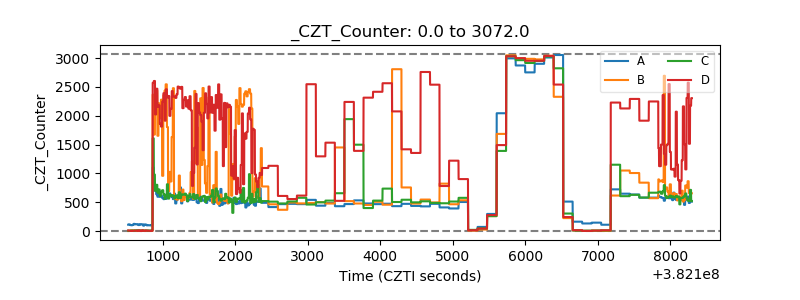 |
| +2.5 Volts monitor | 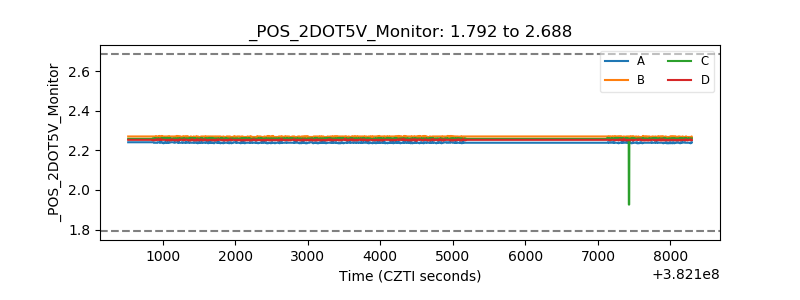 |
| +5 Volts monitor | 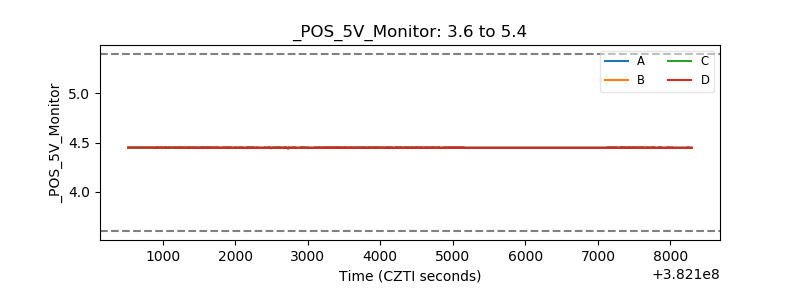 |
| _ROLL_ROT | 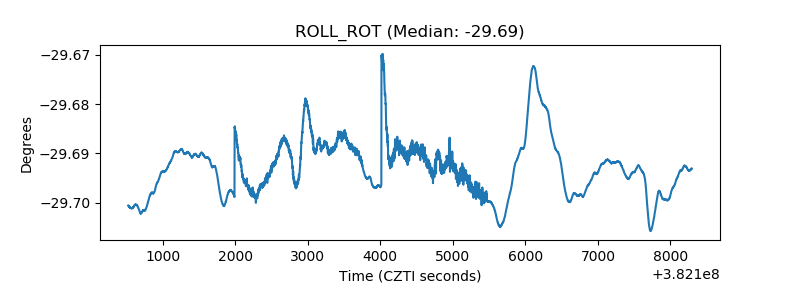 |
| _Roll_DEC | 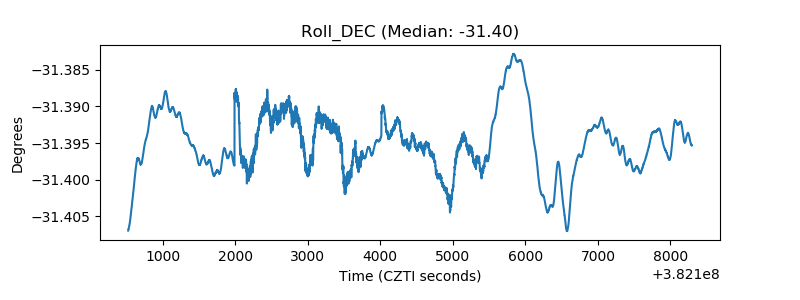 |
| _Roll_RA | 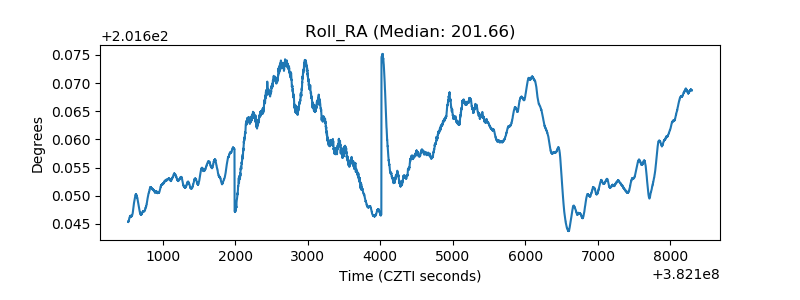 |
| Veto Counter | 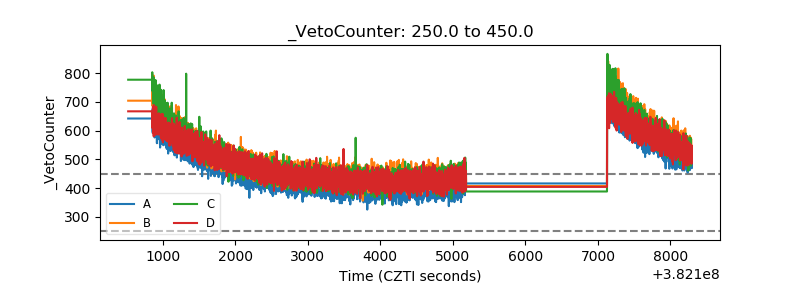 |