| Param | Original file | Final file |
|---|---|---|
| Filename | modeM0/AS1A10_058T05_9000004918_34434cztM0_level2.evt | modeM0/AS1A10_058T05_9000004918_34434cztM0_level2_quad_clean.evt |
| Size (bytes) | 608,918,400 | 48,551,040 |
| Size | 580.7 MB | 46.3 MB |
| Events in quadrant A | 2,611,392 | 309,272 |
| Events in quadrant B | 3,612,011 | 308,970 |
| Events in quadrant C | 2,849,286 | 305,565 |
| Events in quadrant D | 9,012,162 | 176,935 |
| Mode M9 | |||
|---|---|---|---|
| Quadrant | BADHDUFLAG | Total packets | Discarded packets |
| A | 0 | 27 | 0 |
| B | 0 | 27 | 0 |
| C | 0 | 27 | 0 |
| D | 0 | 28 | 0 |
| Mode M0 | |||
|---|---|---|---|
| Quadrant | BADHDUFLAG | Total packets | Discarded packets |
| A | 0 | 11006 | 3 |
| B | 0 | 13977 | 2 |
| C | 0 | 11503 | 2 |
| D | 0 | 30449 | 2 |
| Mode SS | |||
|---|---|---|---|
| Quadrant | BADHDUFLAG | Total packets | Discarded packets |
| A | 0 | 108 | 0 |
| B | 0 | 108 | 0 |
| C | 0 | 108 | 0 |
| D | 0 | 108 | 0 |
| Quadrant | Total seconds | Saturated seconds | Saturation percentage |
|---|---|---|---|
| A | 5252 | 10 | 0.190404% |
| B | 5252 | 365 | 6.949733% |
| C | 5252 | 34 | 0.647372% |
| D | 5252 | 2835 | 53.979436% |
Noise dominated data is calculated using 1-second bins in cleaned event files. If a bin has >2000 counts, and if more than 50% of those come from <1% of pixels, then it is considered to be noise-dominated and hence unusable.
| Quadrant | # 1 sec bins | Bins with >0 counts | Bins with >2000 counts | High rate bins dominated by noise | Noise dominated (total time) | Noise dominated (detector-on time) | Marked lightcurve |
|---|---|---|---|---|---|---|---|
| A | 7075 | 5253 | 3 | 3 | 0.04% | 0.06% | 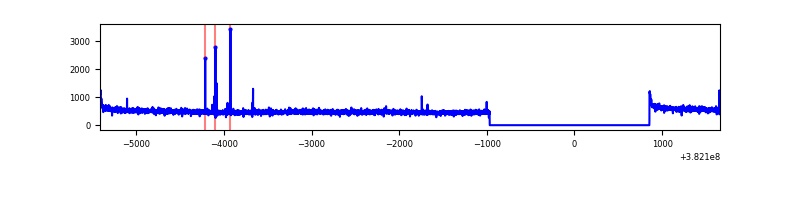 |
| B | 7075 | 5253 | 243 | 243 | 3.43% | 4.63% | 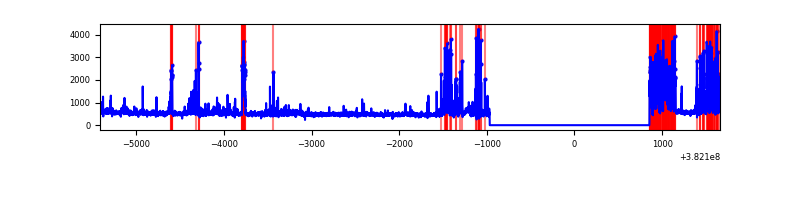 |
| C | 7075 | 5253 | 23 | 23 | 0.33% | 0.44% | 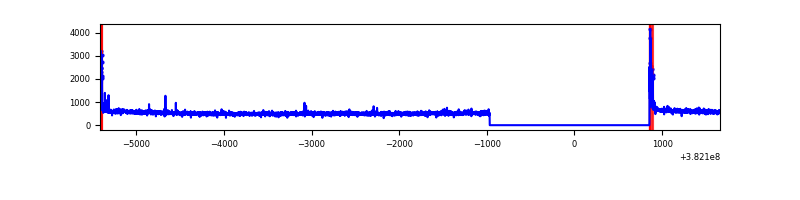 |
| D | 7075 | 5253 | 2340 | 2340 | 33.07% | 44.55% | 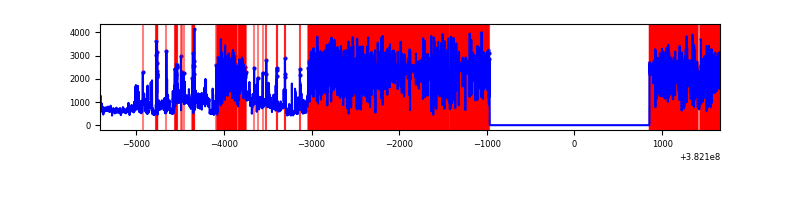 |
Top three noisy pixels from each quadrant. If the there are fewer than three noisy pixels in the level2.evt file, extra rows are filled as -1
| Pixel properties | Quadrant properties | ||||||
|---|---|---|---|---|---|---|---|
| Quadrant | DetID | PixID | Counts | Sigma | Mean | Median | Sigma |
| A | 10 | 83 | 37017 | 275.99 | 659 | 646 | 131.8 |
| A | 9 | 143 | 14561 | 105.59 | 659 | 646 | 131.8 |
| A | 13 | 254 | 8883 | 62.5 | 659 | 646 | 131.8 |
| B | 5 | 172 | 927325 | 7694.77 | 632 | 615 | 120.4 |
| B | 0 | 190 | 132030 | 1091.18 | 632 | 615 | 120.4 |
| B | 4 | 232 | 30020 | 244.16 | 632 | 615 | 120.4 |
| C | 15 | 214 | 220335 | 1484.09 | 639 | 644 | 148.0 |
| C | 0 | 10 | 92349 | 619.5 | 639 | 644 | 148.0 |
| C | 14 | 67 | 26305 | 173.35 | 639 | 644 | 148.0 |
| D | 10 | 118 | 5439170 | 44674.3 | 493 | 479 | 121.7 |
| D | 8 | 195 | 994619 | 8166.03 | 493 | 479 | 121.7 |
| D | 12 | 79 | 163300 | 1337.44 | 493 | 479 | 121.7 |
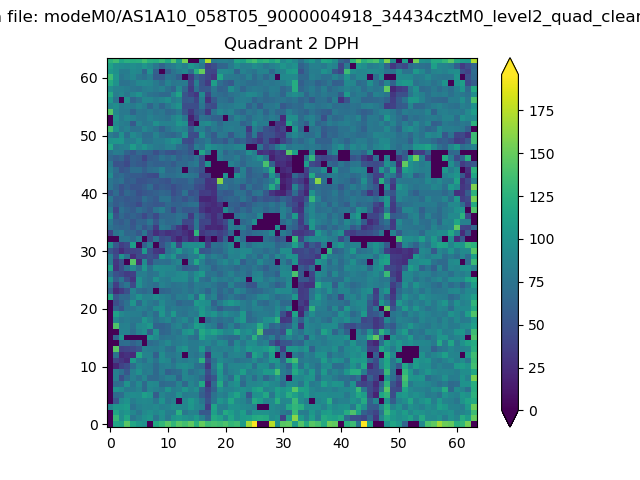
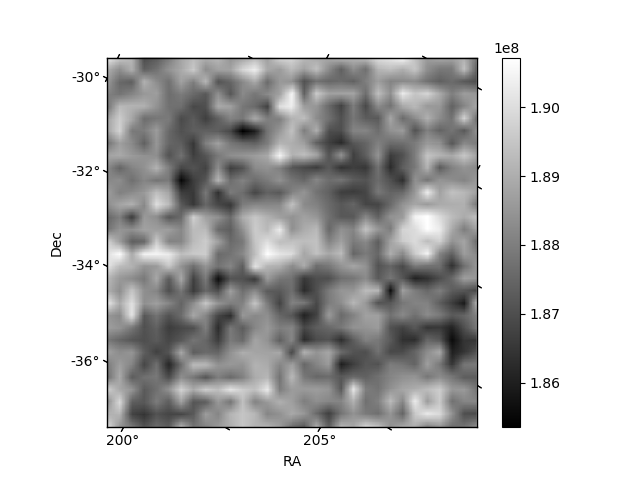
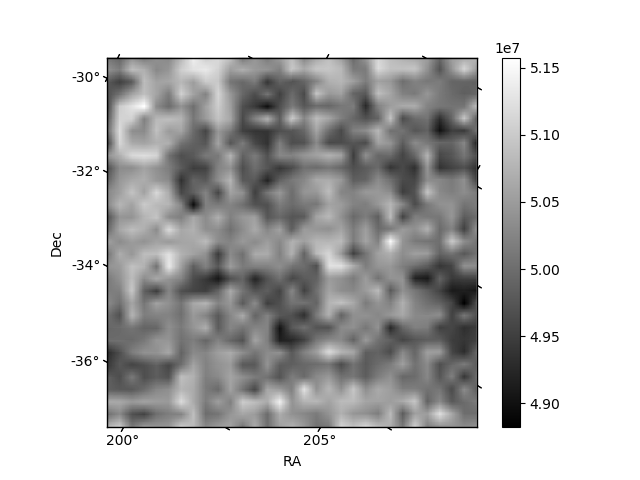
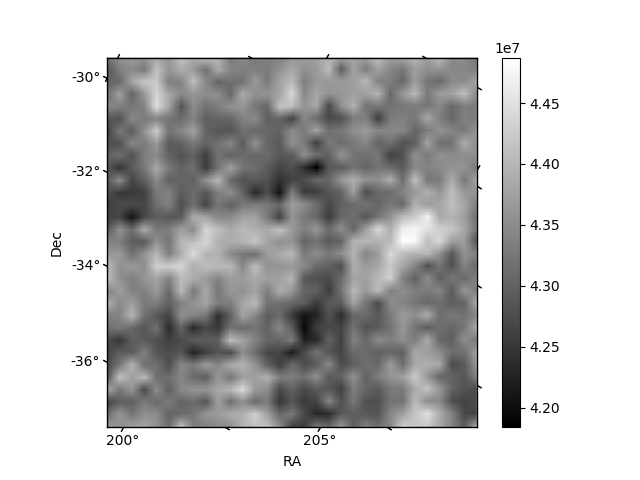
Histogram calculated using DETX and DETY for each event in the final _common_clean file
| Quadrant A | 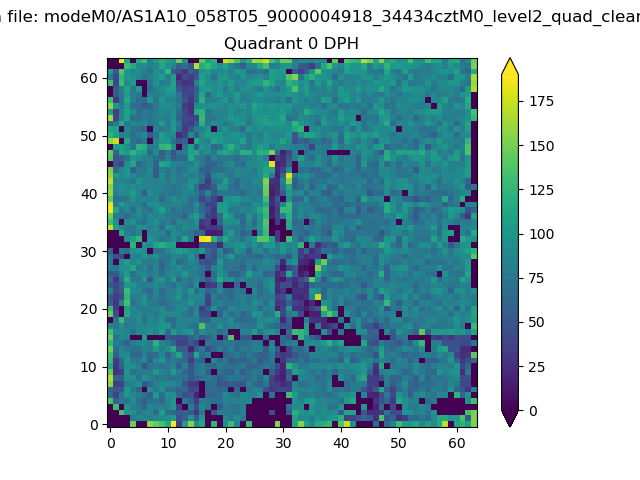 |
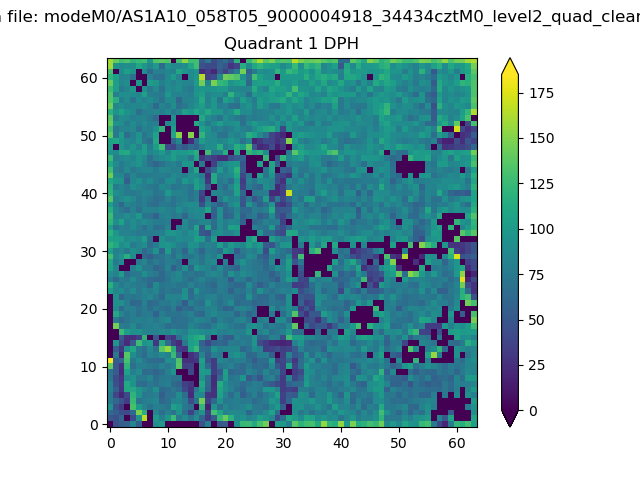 |
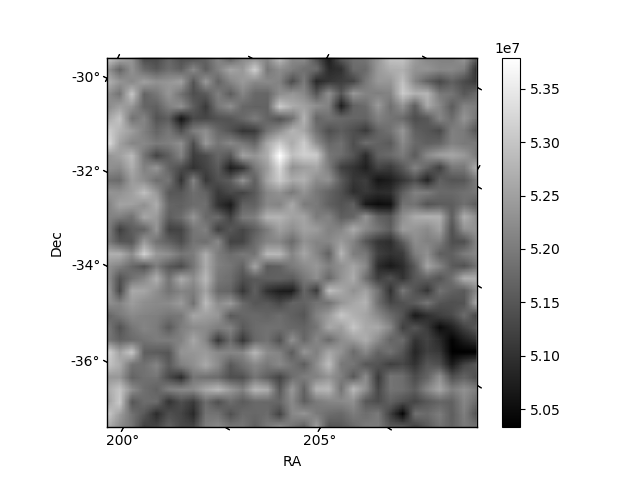
Quadrant B |
|---|---|---|---|
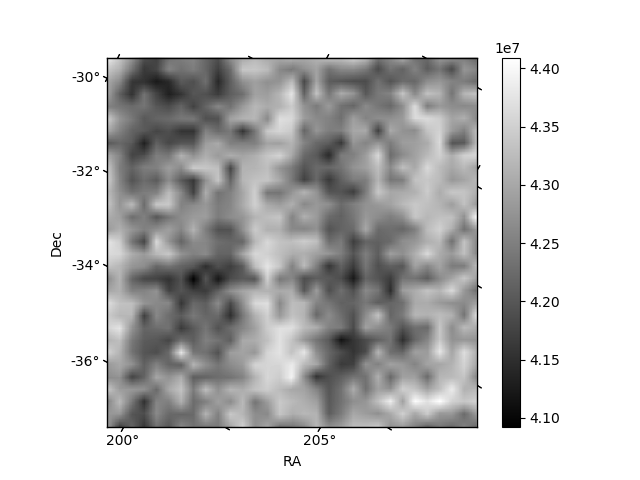
| Quadrant D | 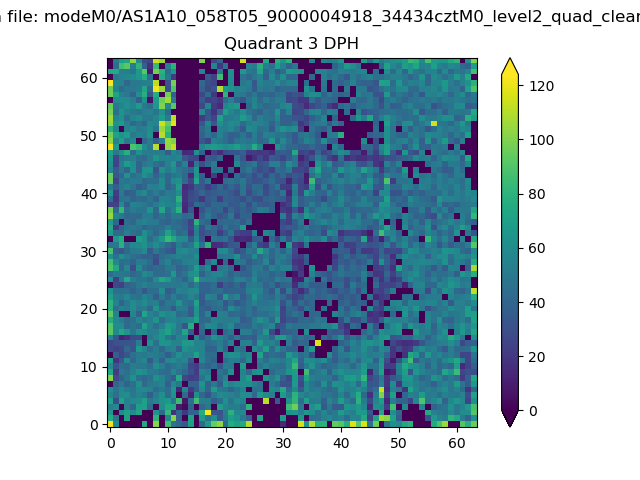 |
 |
Quadrant C |
| Plot type | Count rate plots | Images |
|---|---|---|
| Comparison with Poisson distribution Blue bars denote a histogram of data divided into 1 sec bins. Red curve is a Poisson curve with rate = median count rate of data. |
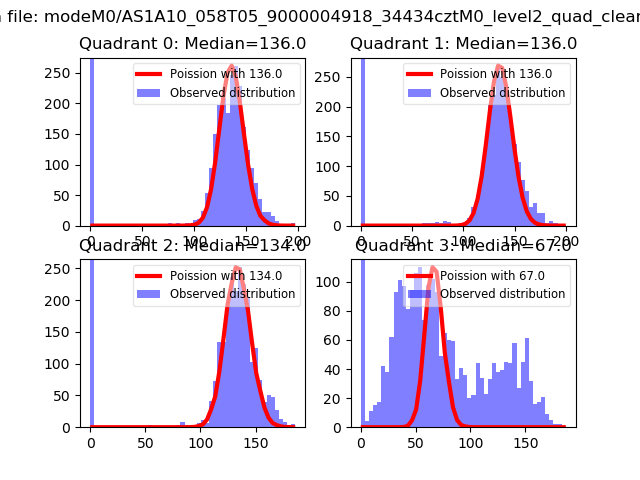 |
 |
| Quadrant-wise count rates Data is divided into 100 sec bins |
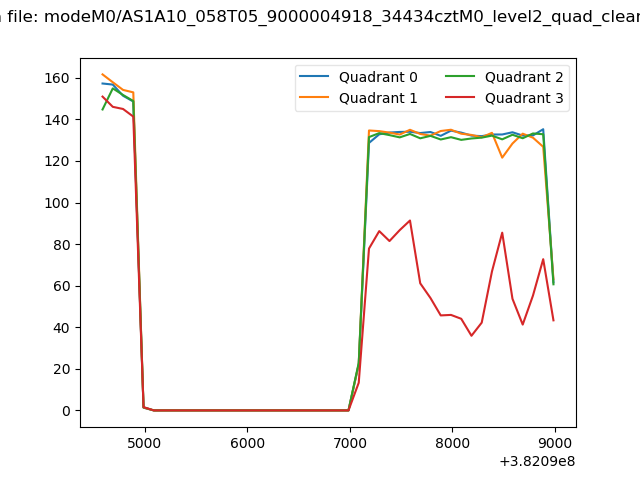 |
|
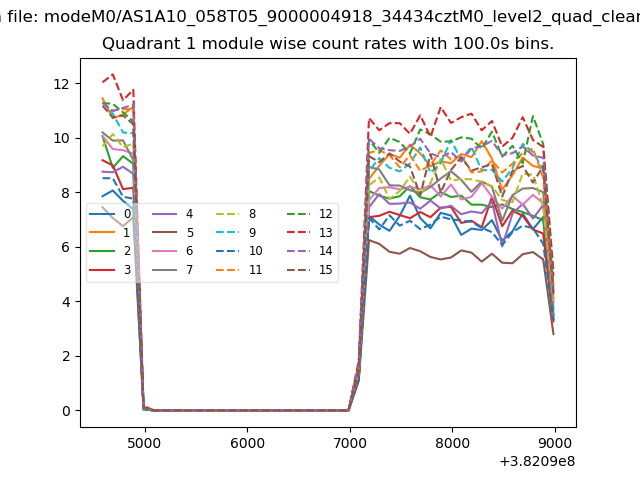
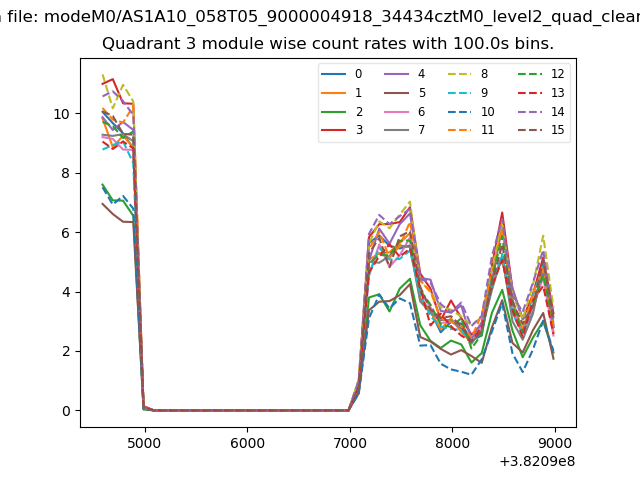
| Module-wise count rates for Quadrant A Data is divided into 100 sec bins |
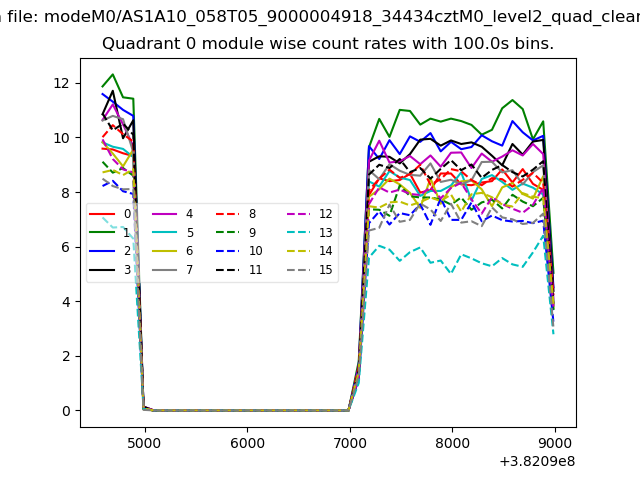 |
 |
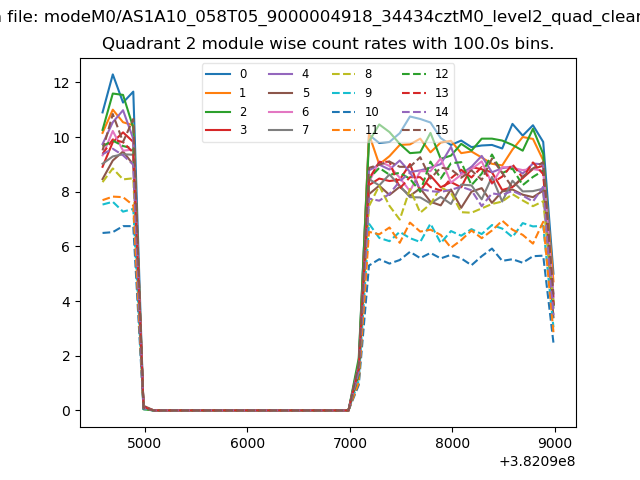
| Module-wise count rates for Quadrant B Data is divided into 100 sec bins |
 |
 |
| Module-wise count rates for Quadrant C Data is divided into 100 sec bins |
 |
 |
| Module-wise count rates for Quadrant D Data is divided into 100 sec bins |
 |
 |
| Parameter | Plot |
|---|---|
| CZT HV Monitor | 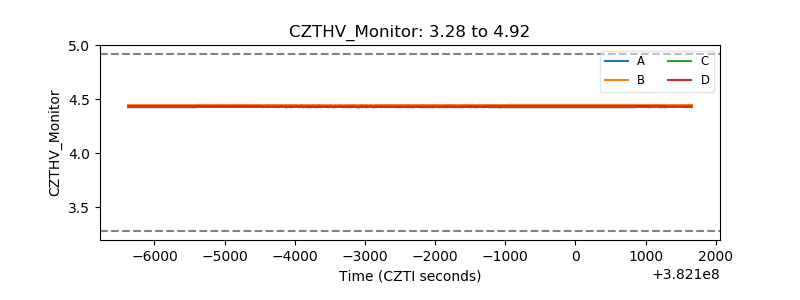 |
| D_VDD | 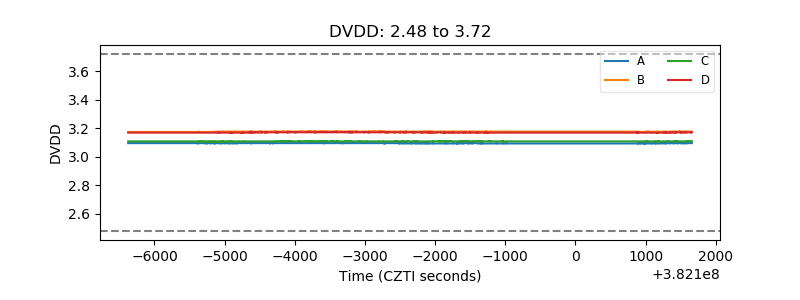 |
| Temperature 1 | 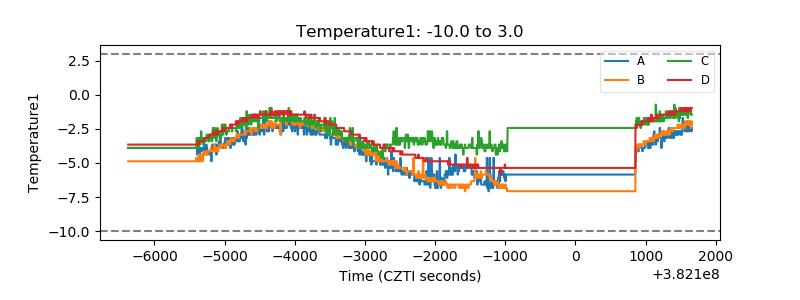 |
| Veto HV Monitor |  |
| Veto LLD | 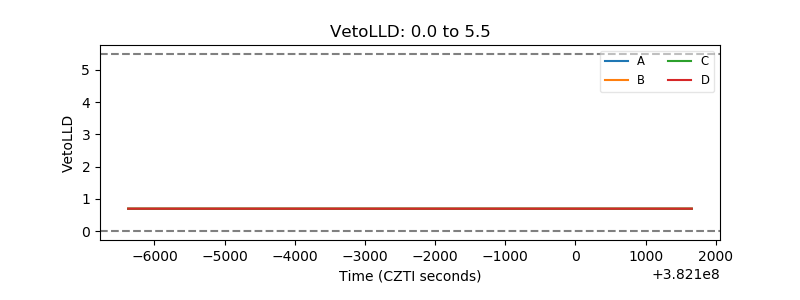 |
| Alpha Counter | 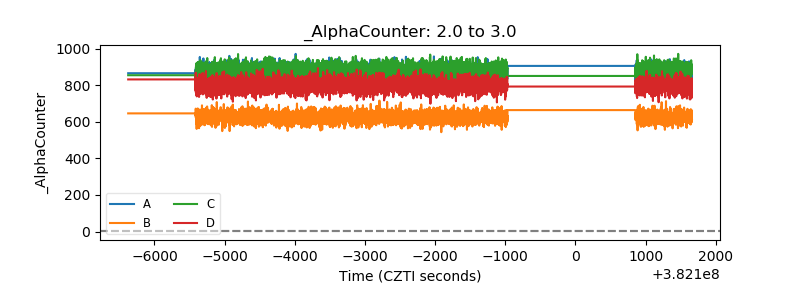 |
| _CPM_Rate | 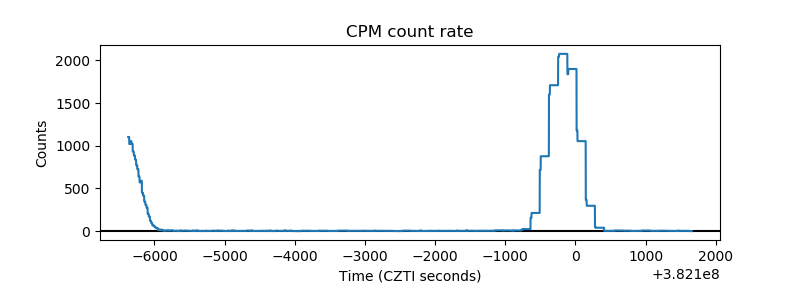 |
| CZT Counter | 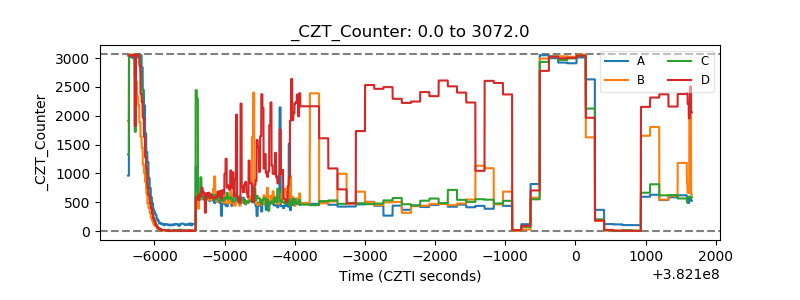 |
| +2.5 Volts monitor | 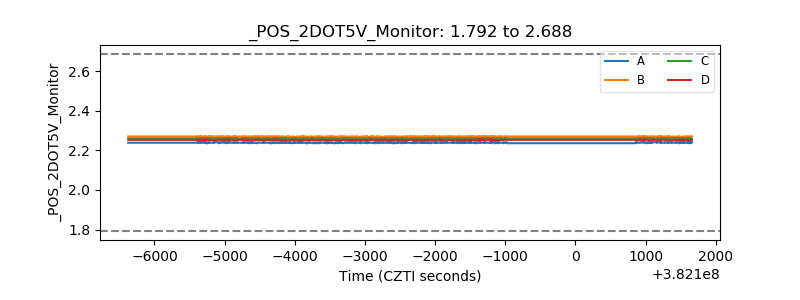 |
| +5 Volts monitor | 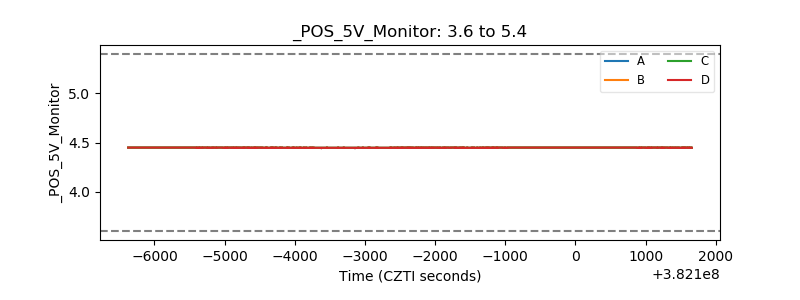 |
| _ROLL_ROT | 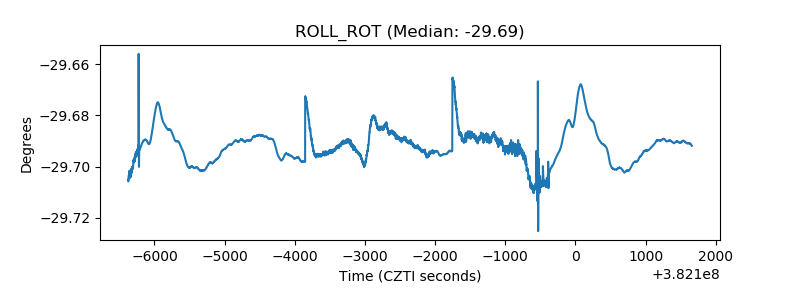 |
| _Roll_DEC | 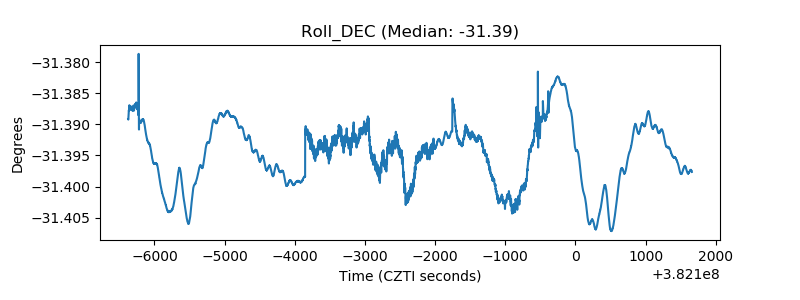 |
| _Roll_RA | 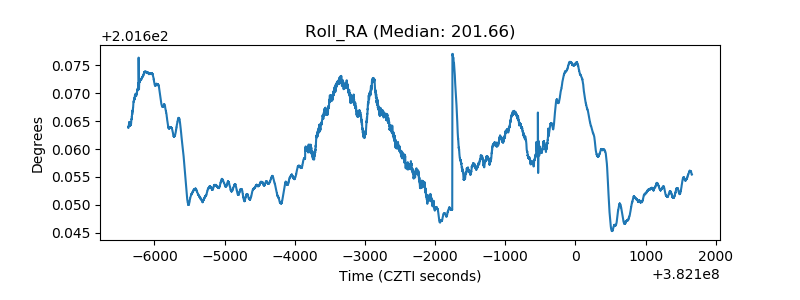 |
| Veto Counter | 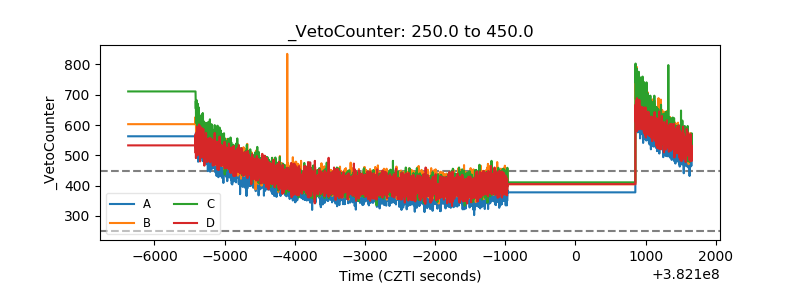 |