| Param | Original file | Final file |
|---|---|---|
| Filename | modeM0/AS1A10_058T05_9000004918_34432cztM0_level2.evt | modeM0/AS1A10_058T05_9000004918_34432cztM0_level2_quad_clean.evt |
| Size (bytes) | 433,468,800 | 57,591,360 |
| Size | 413.4 MB | 54.9 MB |
| Events in quadrant A | 2,484,001 | 349,692 |
| Events in quadrant B | 3,390,223 | 352,378 |
| Events in quadrant C | 2,734,599 | 347,319 |
| Events in quadrant D | 4,162,879 | 326,924 |
| Mode M9 | |||
|---|---|---|---|
| Quadrant | BADHDUFLAG | Total packets | Discarded packets |
| A | 0 | 17 | 0 |
| B | 0 | 17 | 0 |
| C | 0 | 17 | 0 |
| D | 0 | 17 | 0 |
| Mode M0 | |||
|---|---|---|---|
| Quadrant | BADHDUFLAG | Total packets | Discarded packets |
| A | 0 | 10634 | 2 |
| B | 0 | 13284 | 1 |
| C | 0 | 11019 | 1 |
| D | 0 | 16156 | 1 |
| Mode SS | |||
|---|---|---|---|
| Quadrant | BADHDUFLAG | Total packets | Discarded packets |
| A | 0 | 108 | 0 |
| B | 0 | 108 | 0 |
| C | 0 | 108 | 0 |
| D | 0 | 108 | 0 |
| Quadrant | Total seconds | Saturated seconds | Saturation percentage |
|---|---|---|---|
| A | 5239 | 5 | 0.095438% |
| B | 5239 | 305 | 5.821722% |
| C | 5239 | 18 | 0.343577% |
| D | 5239 | 109 | 2.080550% |
Noise dominated data is calculated using 1-second bins in cleaned event files. If a bin has >2000 counts, and if more than 50% of those come from <1% of pixels, then it is considered to be noise-dominated and hence unusable.
| Quadrant | # 1 sec bins | Bins with >0 counts | Bins with >2000 counts | High rate bins dominated by noise | Noise dominated (total time) | Noise dominated (detector-on time) | Marked lightcurve |
|---|---|---|---|---|---|---|---|
| A | 6943 | 5240 | 0 | 0 | 0.00% | 0.00% | 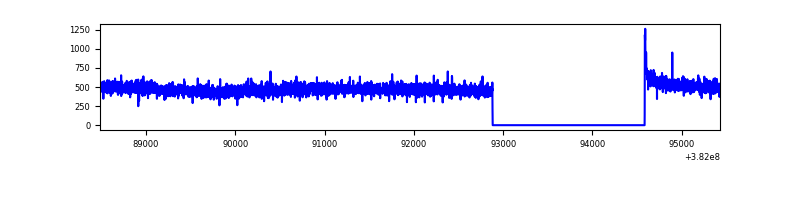 |
| B | 6943 | 5240 | 228 | 228 | 3.28% | 4.35% | 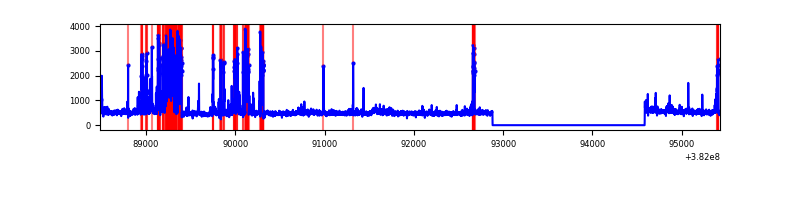 |
| C | 6943 | 5240 | 12 | 12 | 0.17% | 0.23% | 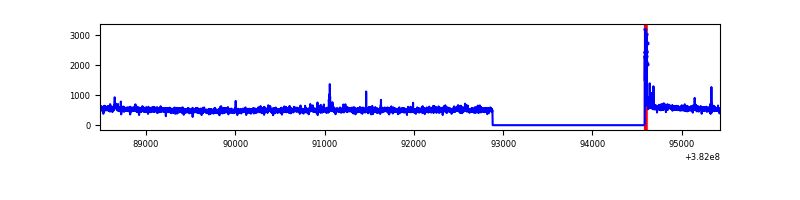 |
| D | 6943 | 5240 | 98 | 98 | 1.41% | 1.87% | 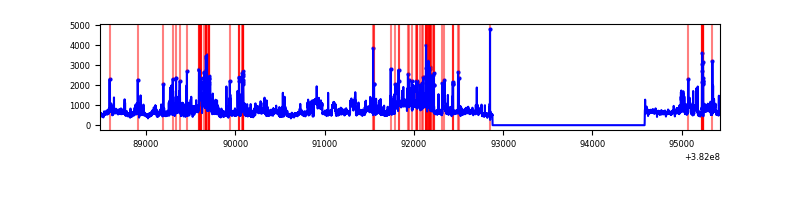 |
Top three noisy pixels from each quadrant. If the there are fewer than three noisy pixels in the level2.evt file, extra rows are filled as -1
| Pixel properties | Quadrant properties | ||||||
|---|---|---|---|---|---|---|---|
| Quadrant | DetID | PixID | Counts | Sigma | Mean | Median | Sigma |
| A | 10 | 83 | 24304 | 186.52 | 632 | 621 | 127.0 |
| A | 13 | 6 | 18020 | 137.03 | 632 | 621 | 127.0 |
| A | 13 | 254 | 8068 | 58.65 | 632 | 621 | 127.0 |
| B | 5 | 172 | 813628 | 6908.62 | 610 | 593 | 117.7 |
| B | 0 | 190 | 92362 | 779.79 | 610 | 593 | 117.7 |
| B | 4 | 232 | 30388 | 253.18 | 610 | 593 | 117.7 |
| C | 15 | 214 | 219578 | 1534.86 | 615 | 622 | 142.7 |
| C | 0 | 10 | 50027 | 346.32 | 615 | 622 | 142.7 |
| C | 14 | 67 | 44817 | 309.8 | 615 | 622 | 142.7 |
| D | 8 | 195 | 753493 | 4973.95 | 614 | 597 | 151.4 |
| D | 7 | 223 | 332701 | 2194.02 | 614 | 597 | 151.4 |
| D | 2 | 250 | 195326 | 1286.46 | 614 | 597 | 151.4 |
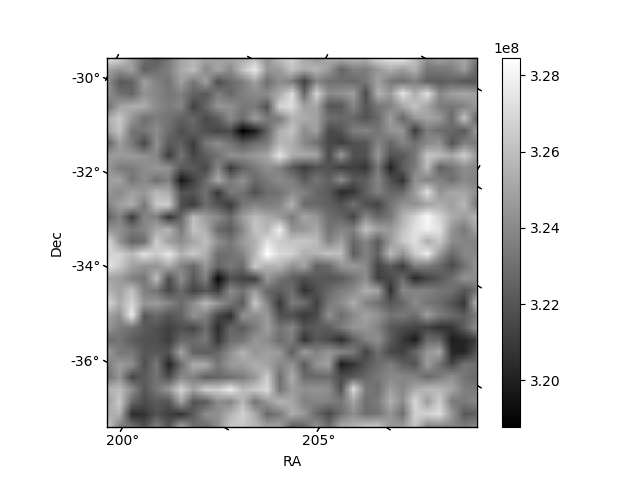
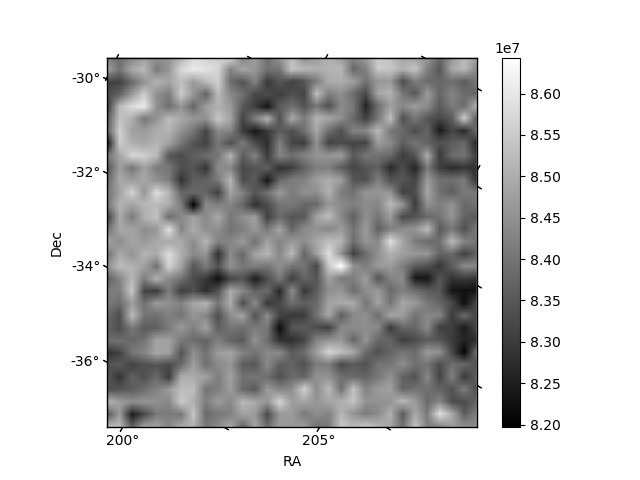
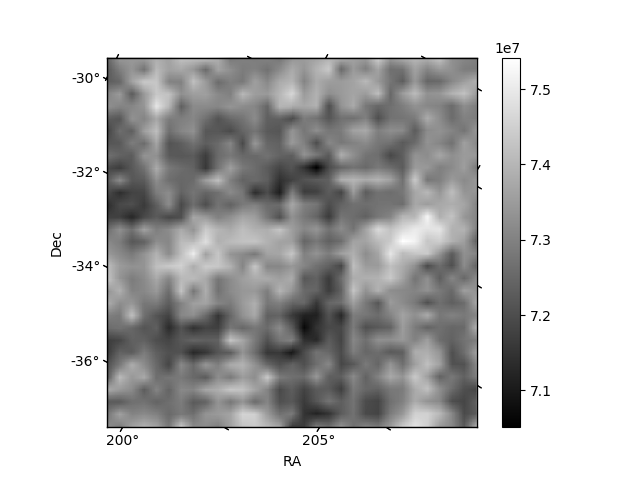
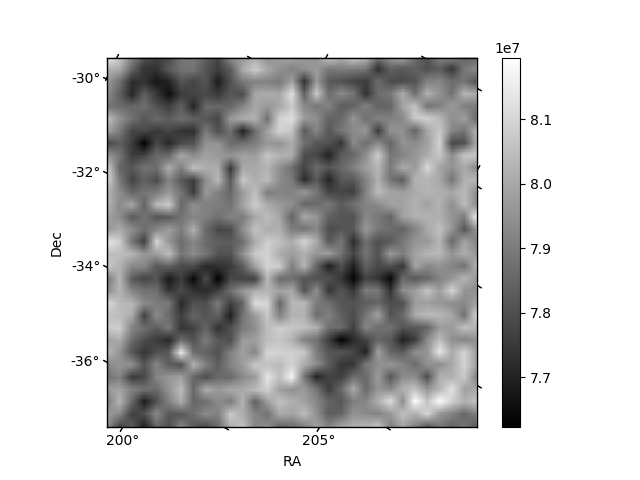
Histogram calculated using DETX and DETY for each event in the final _common_clean file
| Quadrant A | 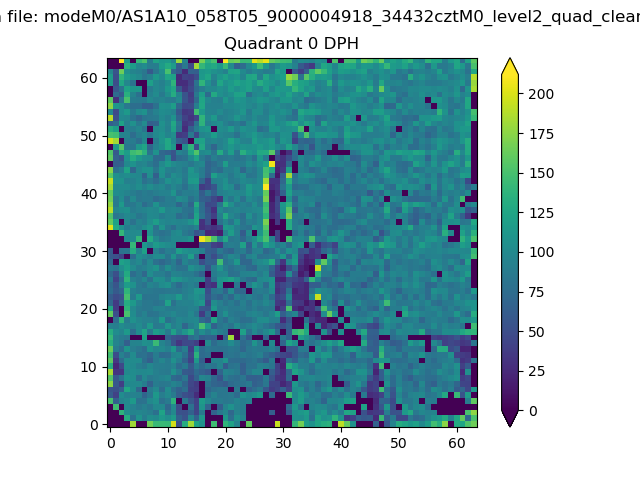 |
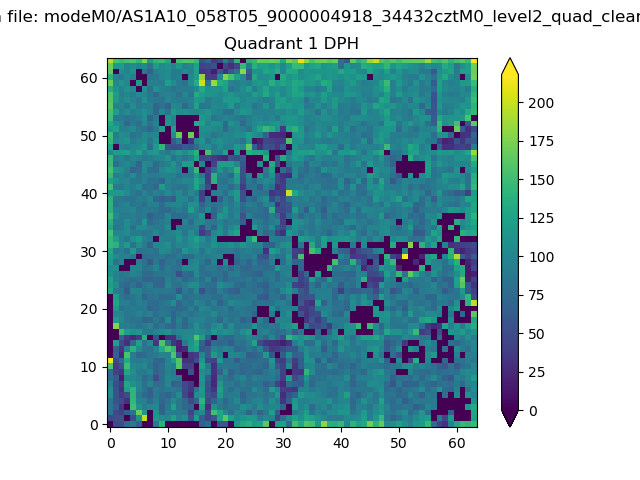 |
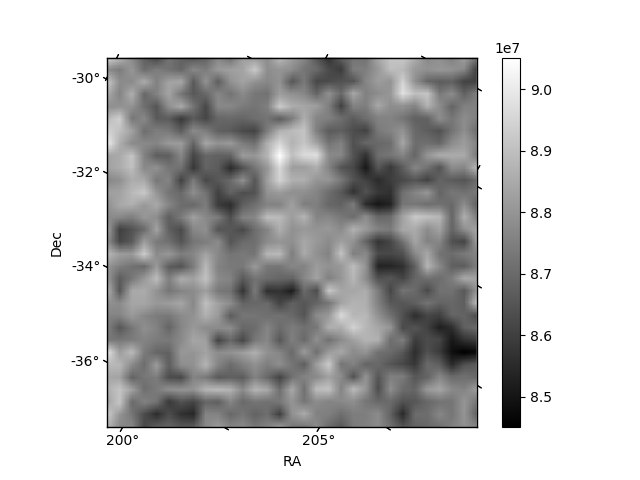
Quadrant B |
|---|---|---|---|
| Quadrant D | 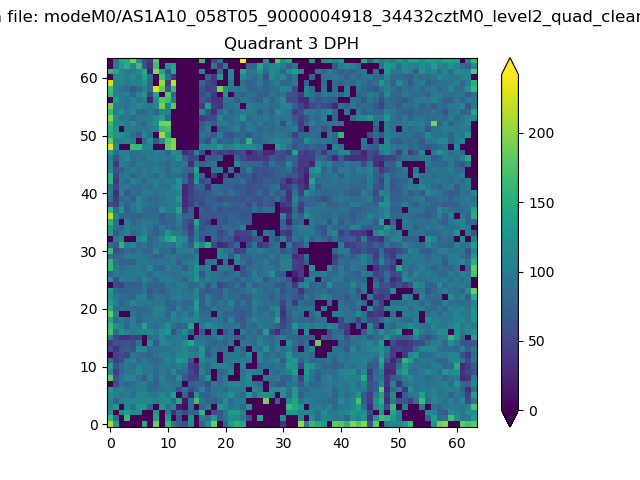 |
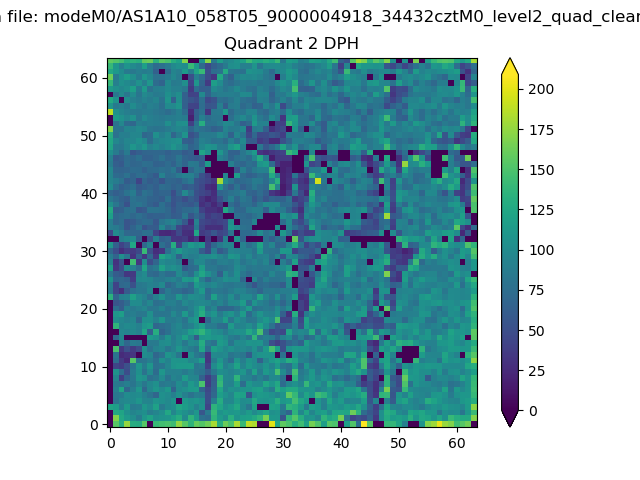 |
Quadrant C |
| Plot type | Count rate plots | Images |
|---|---|---|
| Comparison with Poisson distribution Blue bars denote a histogram of data divided into 1 sec bins. Red curve is a Poisson curve with rate = median count rate of data. |
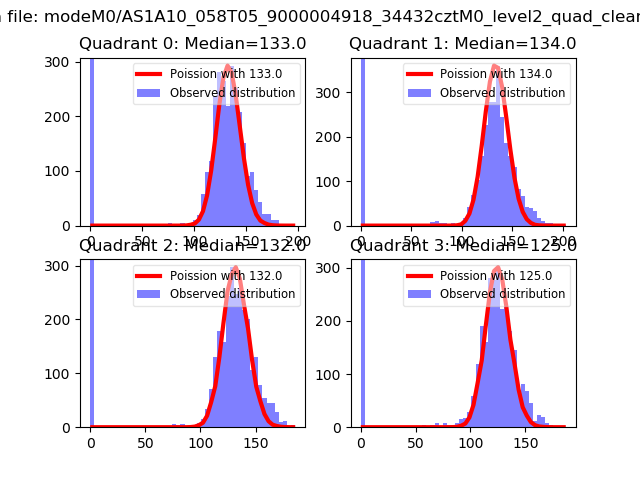 |
 |
| Quadrant-wise count rates Data is divided into 100 sec bins |
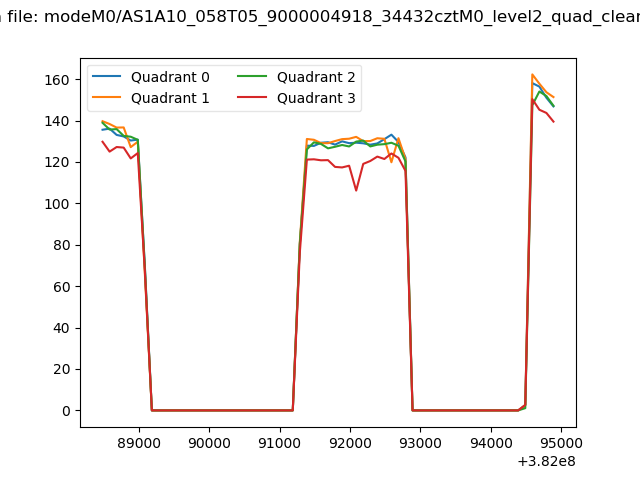 |
|
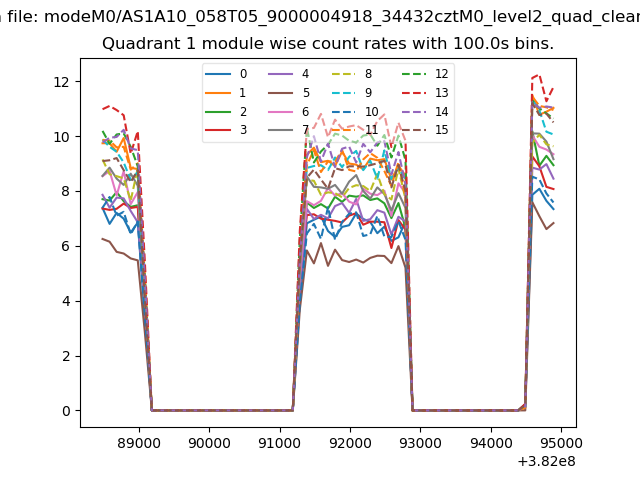
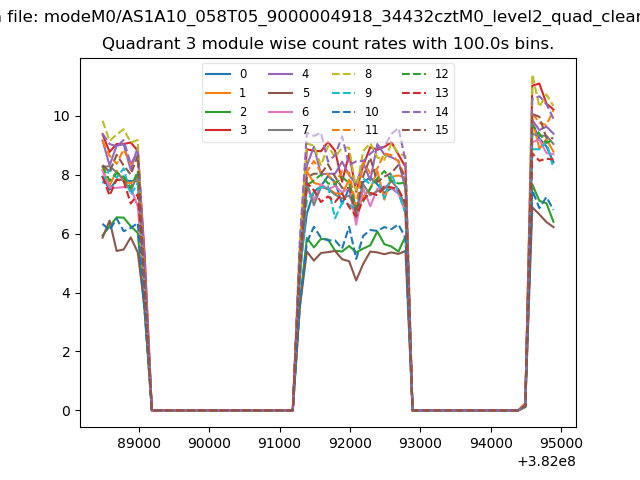
| Module-wise count rates for Quadrant A Data is divided into 100 sec bins |
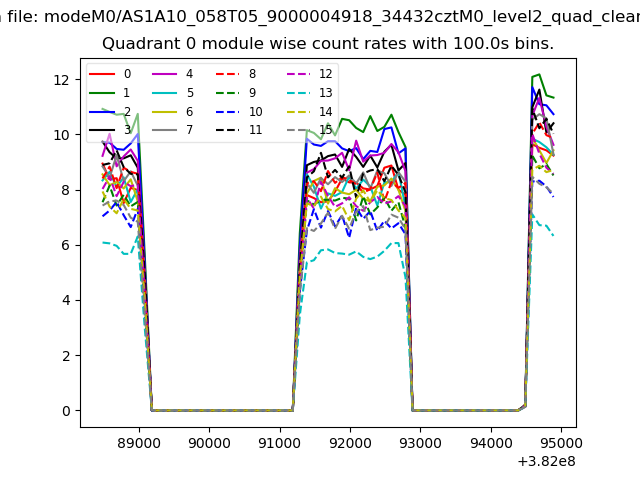 |
 |
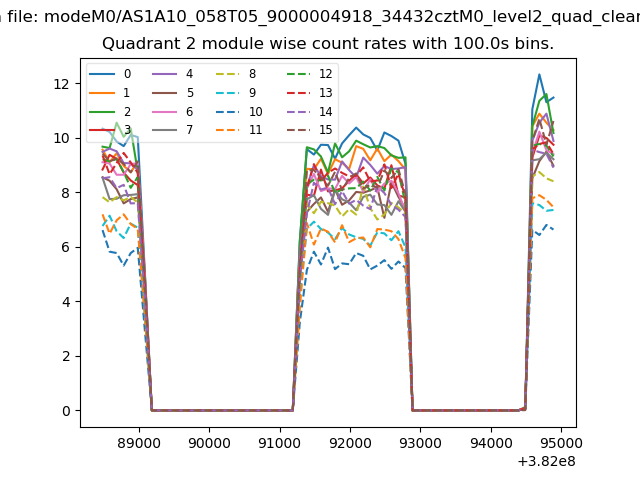
| Module-wise count rates for Quadrant B Data is divided into 100 sec bins |
 |
 |
| Module-wise count rates for Quadrant C Data is divided into 100 sec bins |
 |
 |
| Module-wise count rates for Quadrant D Data is divided into 100 sec bins |
 |
 |
| Parameter | Plot |
|---|---|
| CZT HV Monitor | 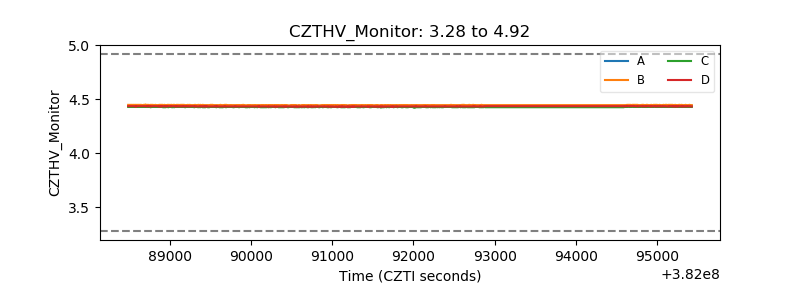 |
| D_VDD | 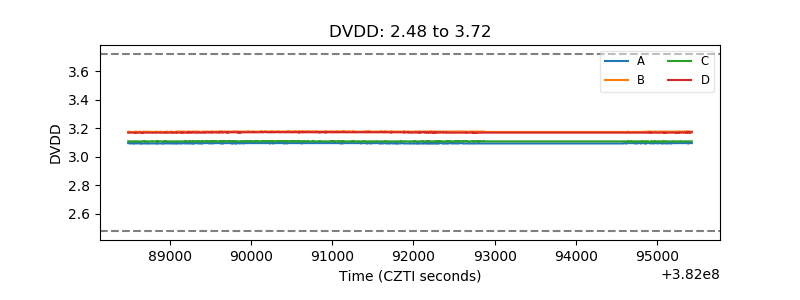 |
| Temperature 1 | 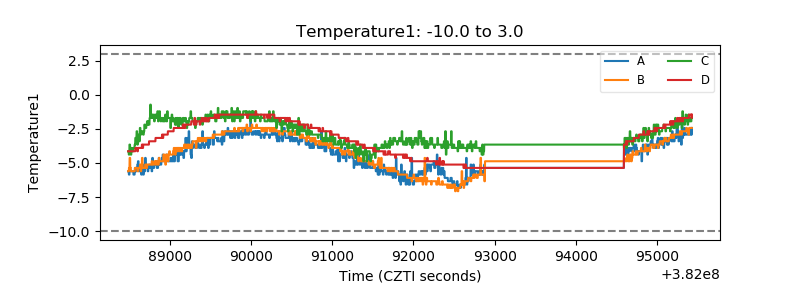 |
| Veto HV Monitor |  |
| Veto LLD | 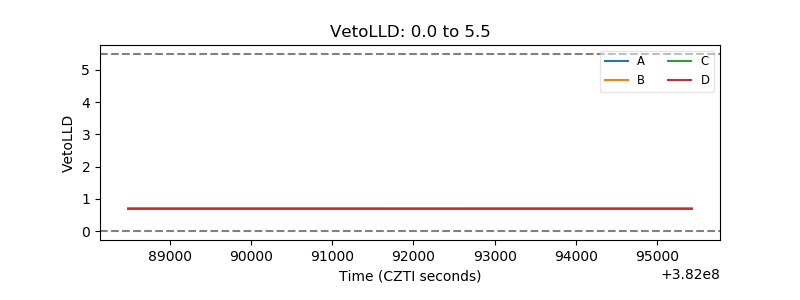 |
| Alpha Counter | 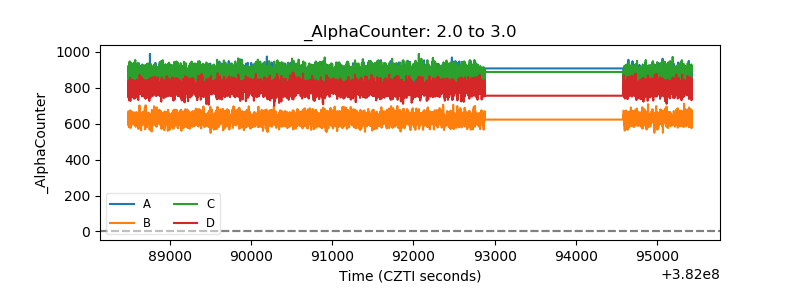 |
| _CPM_Rate | 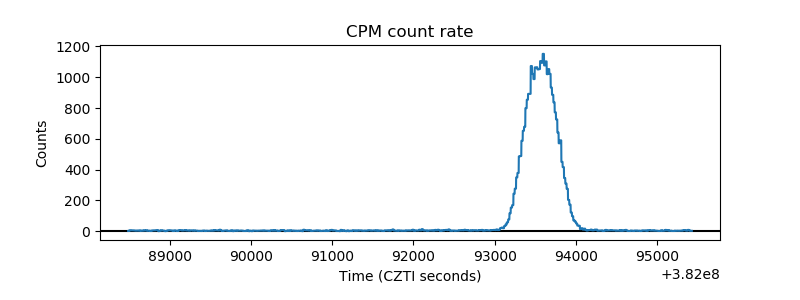 |
| CZT Counter | 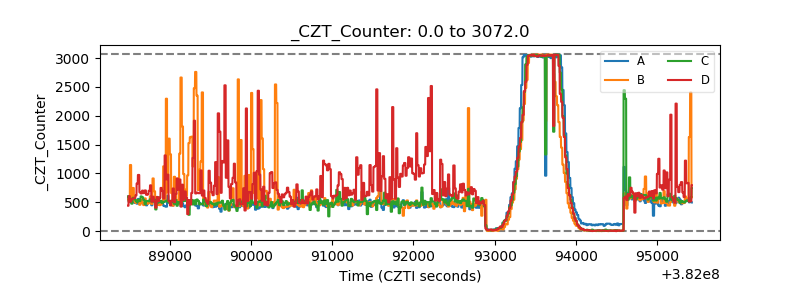 |
| +2.5 Volts monitor | 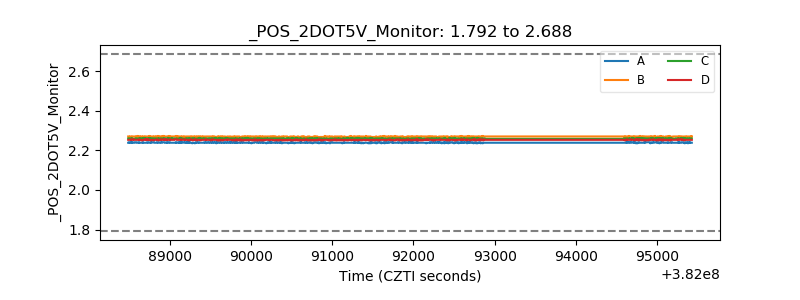 |
| +5 Volts monitor | 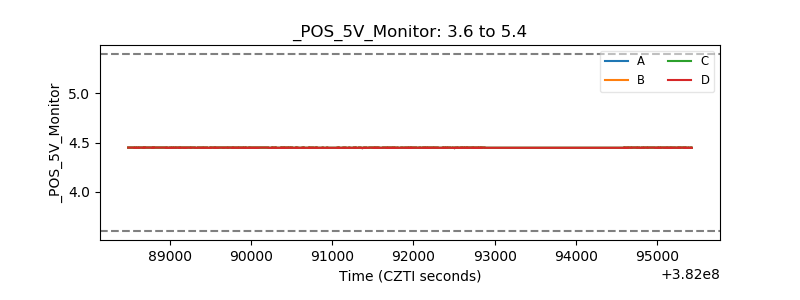 |
| _ROLL_ROT | 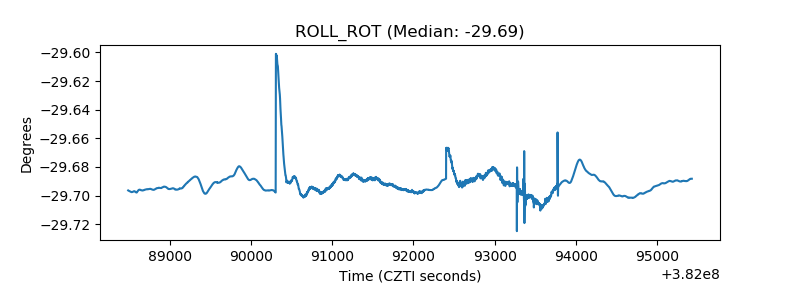 |
| _Roll_DEC | 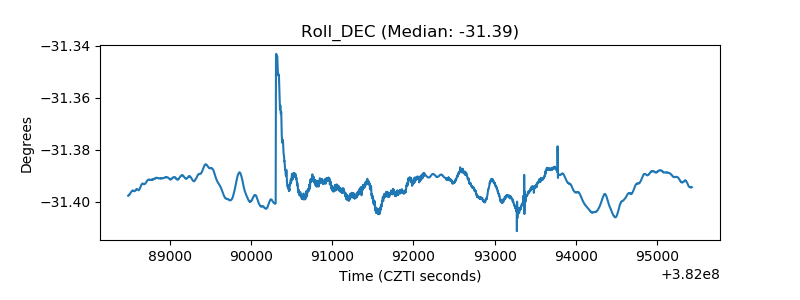 |
| _Roll_RA | 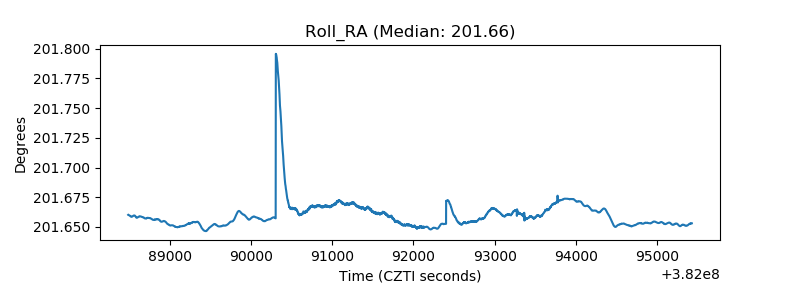 |
| Veto Counter | 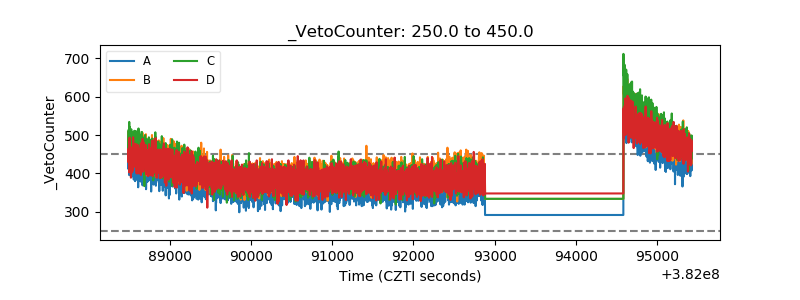 |