| Param | Original file | Final file |
|---|---|---|
| Filename | modeM0/AS1A10_058T05_9000004918cztM0_level2_bc.evt | modeM0/AS1A10_058T05_9000004918cztM0_level2_quad_clean.evt |
| Size (bytes) | 4,416,963,840 | 923,014,080 |
| Size | 4.1 GB | 880.3 MB |
| Events in quadrant A | 16,580,593 | 5,973,240 |
| Events in quadrant B | 27,145,557 | 5,932,964 |
| Events in quadrant C | 22,824,143 | 5,875,186 |
| Events in quadrant D | 62,110,022 | 5,014,380 |
| Mode M9 | |||
|---|---|---|---|
| Quadrant | BADHDUFLAG | Total packets | Discarded packets |
| A | 0 | 292 | 0 |
| B | 0 | 292 | 0 |
| C | 0 | 292 | 0 |
| D | 0 | 292 | 0 |
| Mode M0 | |||
|---|---|---|---|
| Quadrant | BADHDUFLAG | Total packets | Discarded packets |
| A | 0 | 155010 | 0 |
| B | 0 | 204128 | 0 |
| C | 0 | 171082 | 0 |
| D | 0 | 327773 | 0 |
| Mode SS | |||
|---|---|---|---|
| Quadrant | BADHDUFLAG | Total packets | Discarded packets |
| A | 0 | 1536 | 0 |
| B | 0 | 1536 | 0 |
| C | 0 | 1536 | 0 |
| D | 0 | 1536 | 0 |
| Quadrant | Total seconds | Saturated seconds | Saturation percentage |
|---|---|---|---|
| A | 75234 | 124 | 0.164819% |
| B | 75234 | 4760 | 6.326927% |
| C | 75234 | 509 | 0.676556% |
| D | 75234 | 12980 | 17.252838% |
Noise dominated data is calculated using 1-second bins in cleaned event files. If a bin has >2000 counts, and if more than 50% of those come from <1% of pixels, then it is considered to be noise-dominated and hence unusable.
| Quadrant | # 1 sec bins | Bins with >0 counts | Bins with >2000 counts | High rate bins dominated by noise | Noise dominated (total time) | Noise dominated (detector-on time) | Marked lightcurve |
|---|---|---|---|---|---|---|---|
| A | 102992 | 75245 | 4 | 4 | 0.00% | 0.01% | 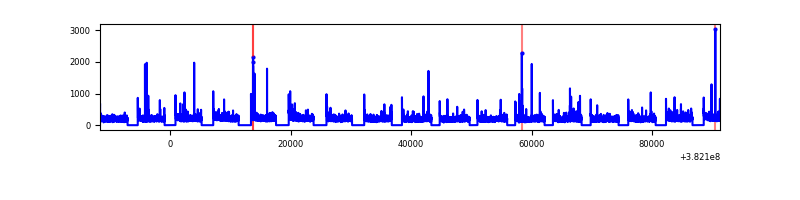 |
| B | 102991 | 75232 | 175 | 175 | 0.17% | 0.23% | 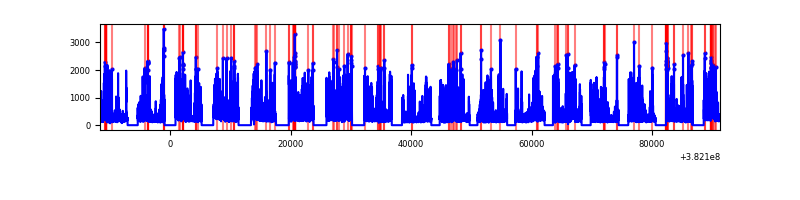 |
| C | 102991 | 75234 | 98 | 98 | 0.10% | 0.13% | 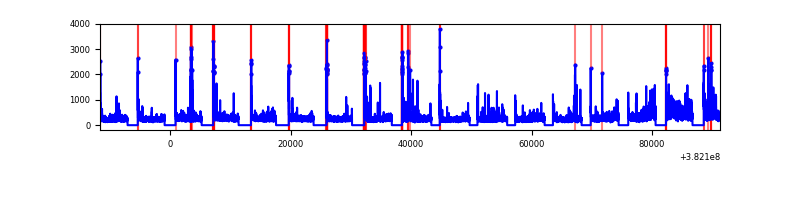 |
| D | 102991 | 75234 | 2003 | 2003 | 1.94% | 2.66% | 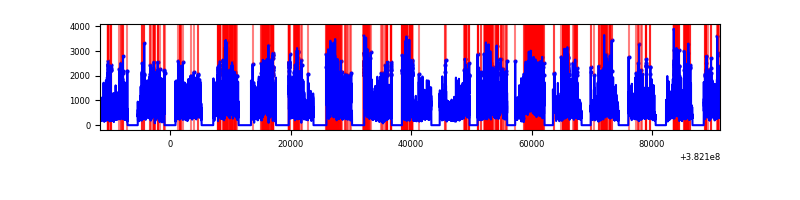 |
Top three noisy pixels from each quadrant. If the there are fewer than three noisy pixels in the level2.evt file, extra rows are filled as -1
| Pixel properties | Quadrant properties | ||||||
|---|---|---|---|---|---|---|---|
| Quadrant | DetID | PixID | Counts | Sigma | Mean | Median | Sigma |
| A | 10 | 83 | 335713 | 373.26 | 4116 | 4064 | 888.5 |
| A | 13 | 254 | 117051 | 127.16 | 4116 | 4064 | 888.5 |
| A | 13 | 6 | 115000 | 124.86 | 4116 | 4064 | 888.5 |
| B | 5 | 172 | 6916673 | 8899.08 | 4008 | 3930 | 776.8 |
| B | 4 | 171 | 2017891 | 2592.66 | 4008 | 3930 | 776.8 |
| B | 0 | 190 | 1036115 | 1328.78 | 4008 | 3930 | 776.8 |
| C | 15 | 214 | 2979089 | 3264.66 | 4003 | 3984 | 911.3 |
| C | 4 | 254 | 2379373 | 2606.57 | 4003 | 3984 | 911.3 |
| C | 0 | 10 | 794053 | 866.96 | 4003 | 3984 | 911.3 |
| D | 8 | 195 | 21948492 | 25038.08 | 3715 | 3613 | 876.5 |
| D | 10 | 118 | 8261054 | 9421.35 | 3715 | 3613 | 876.5 |
| D | 7 | 223 | 3779820 | 4308.47 | 3715 | 3613 | 876.5 |
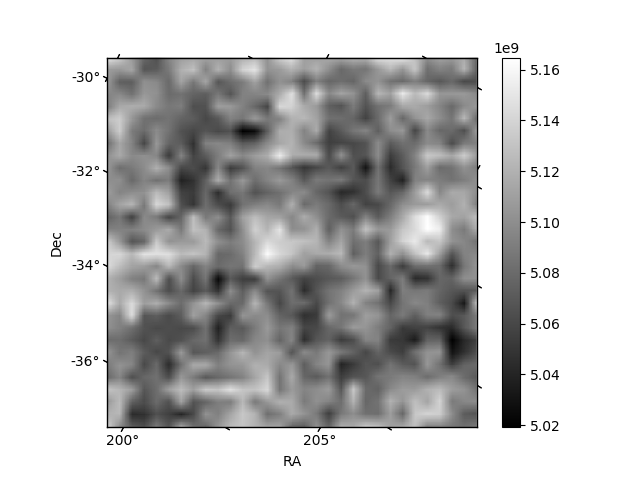
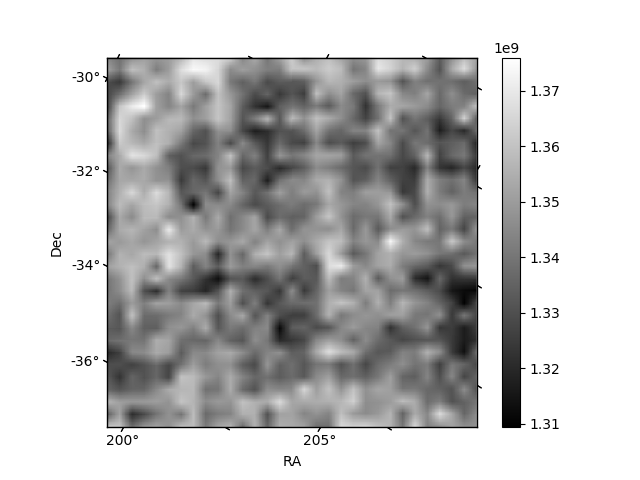
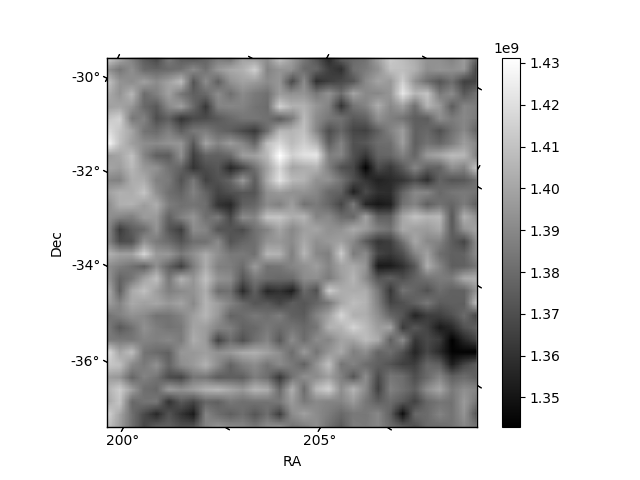
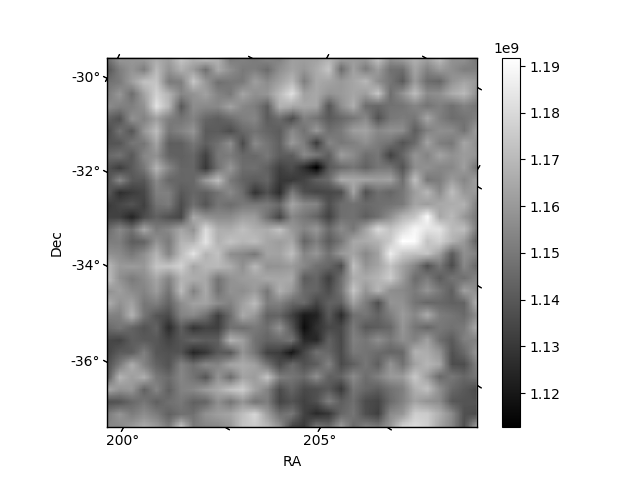
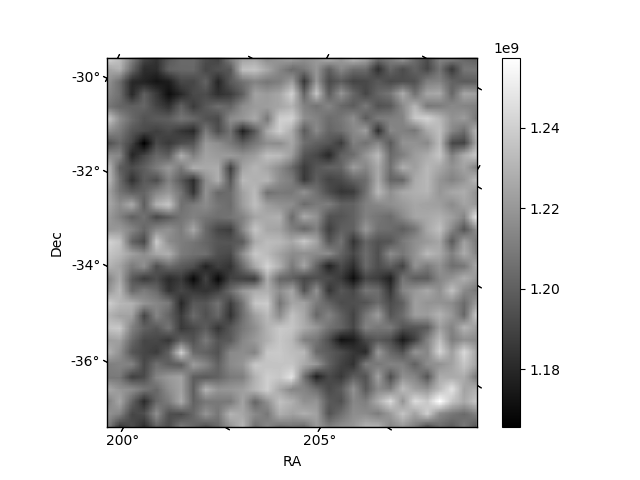
Histogram calculated using DETX and DETY for each event in the final _common_clean file
| Quadrant A | 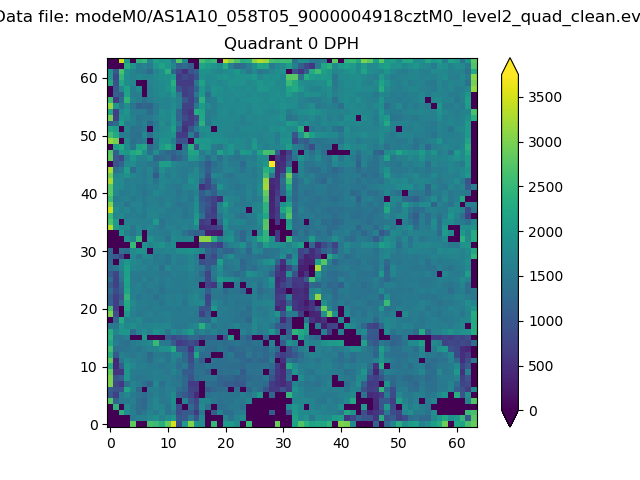 |
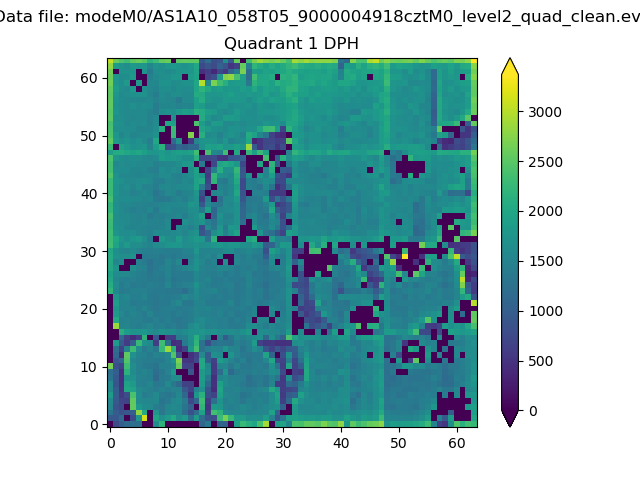 |
Quadrant B |
|---|---|---|---|
| Quadrant D | 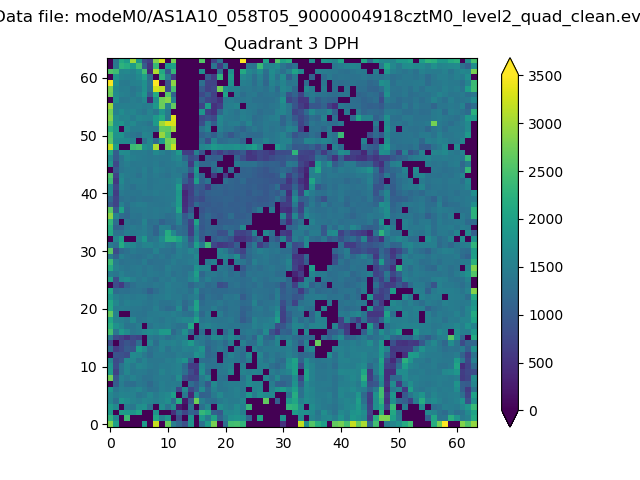 |
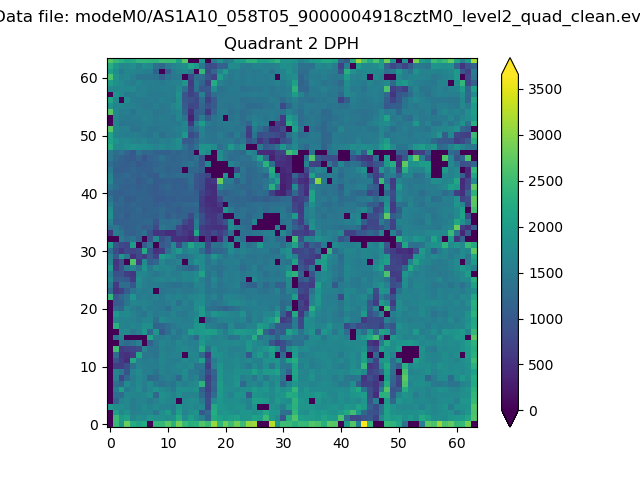 |
Quadrant C |
| Plot type | Count rate plots | Images |
|---|---|---|
| Comparison with Poisson distribution Blue bars denote a histogram of data divided into 1 sec bins. Red curve is a Poisson curve with rate = median count rate of data. |
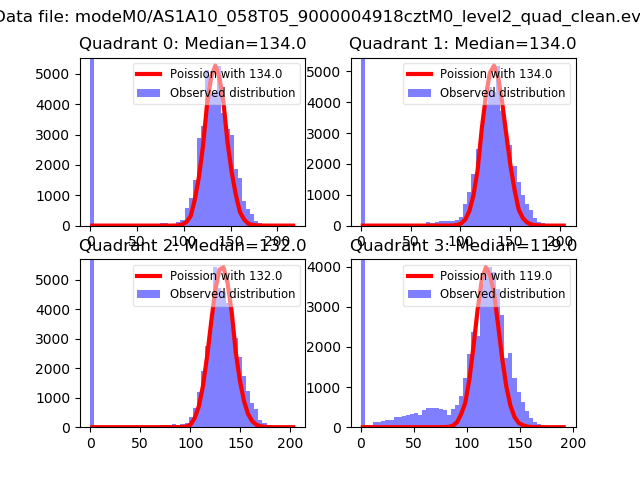 |
 |
| Quadrant-wise count rates Data is divided into 100 sec bins |
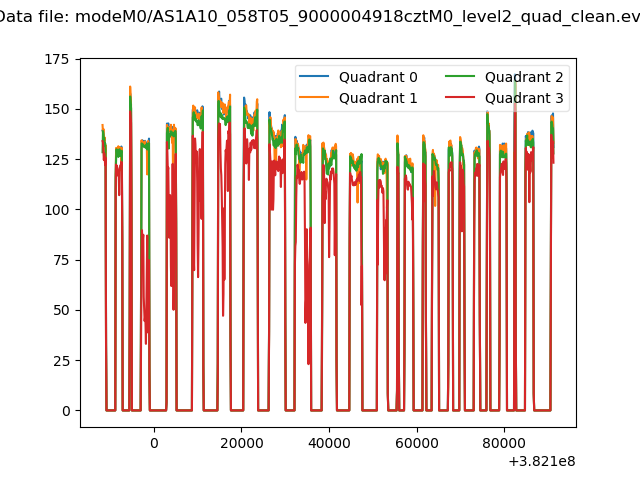 |
|
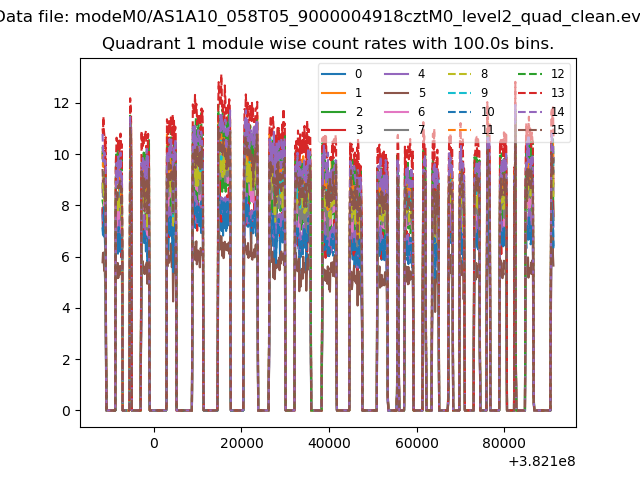
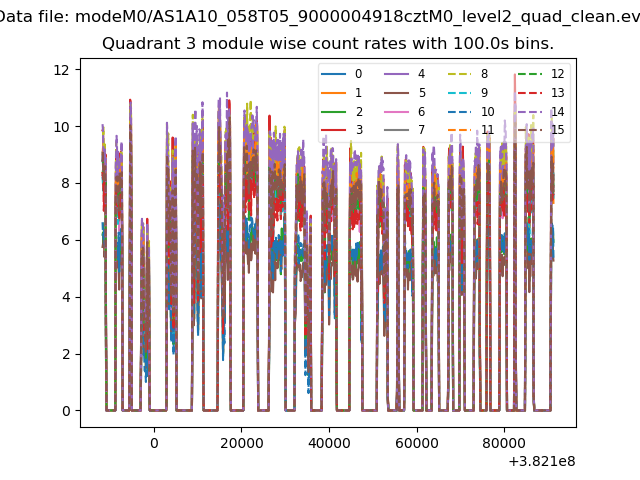
| Module-wise count rates for Quadrant A Data is divided into 100 sec bins |
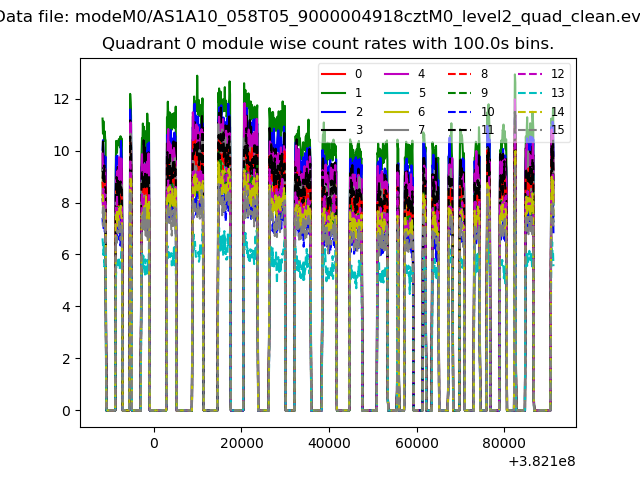 |
 |
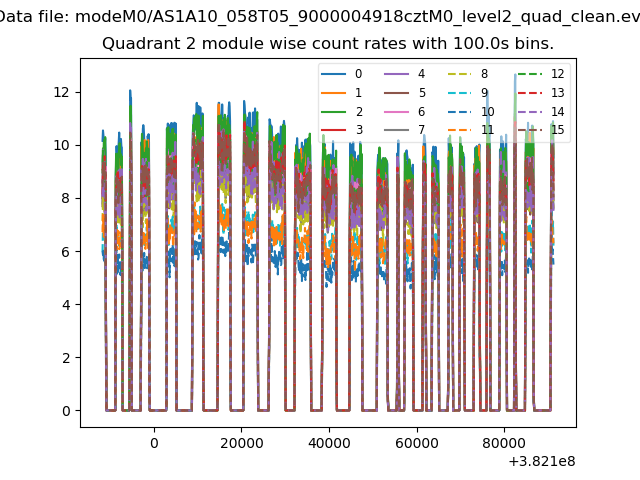
| Module-wise count rates for Quadrant B Data is divided into 100 sec bins |
 |
 |
| Module-wise count rates for Quadrant C Data is divided into 100 sec bins |
 |
 |
| Module-wise count rates for Quadrant D Data is divided into 100 sec bins |
 |
 |
| Parameter | Plot |
|---|---|
| CZT HV Monitor | 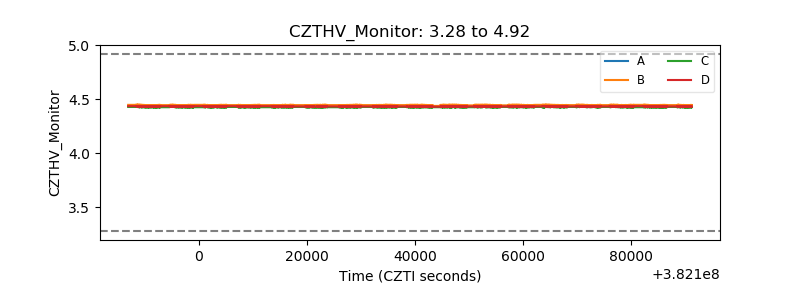 |
| D_VDD | 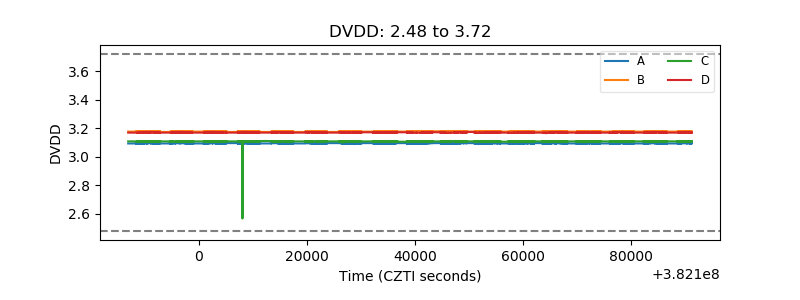 |
| Temperature 1 | 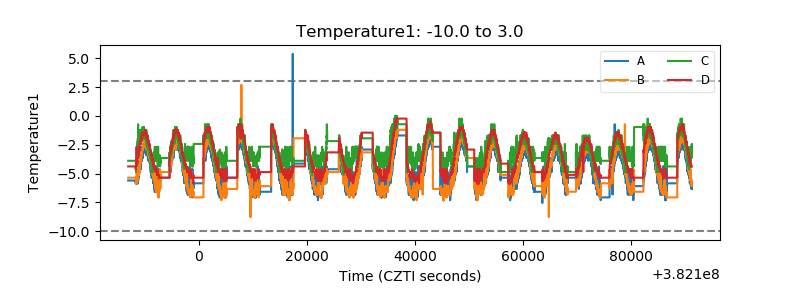 |
| Veto HV Monitor | 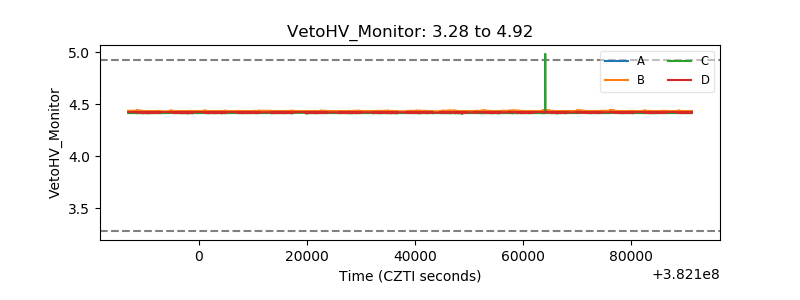 |
| Veto LLD | 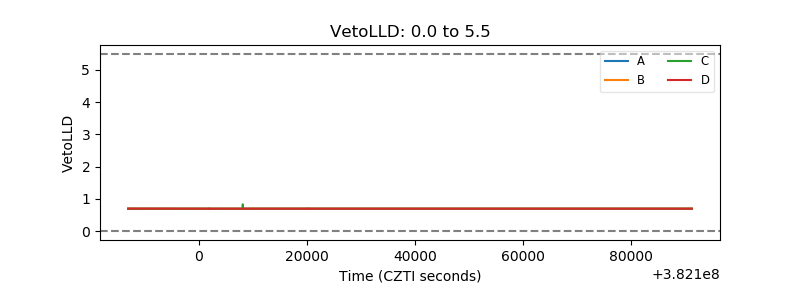 |
| Alpha Counter |  |
| _CPM_Rate | 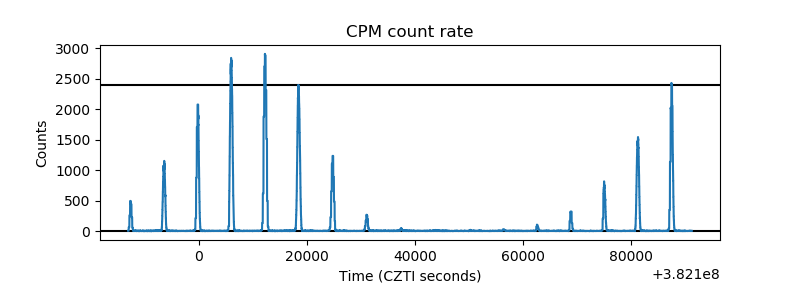 |
| CZT Counter | 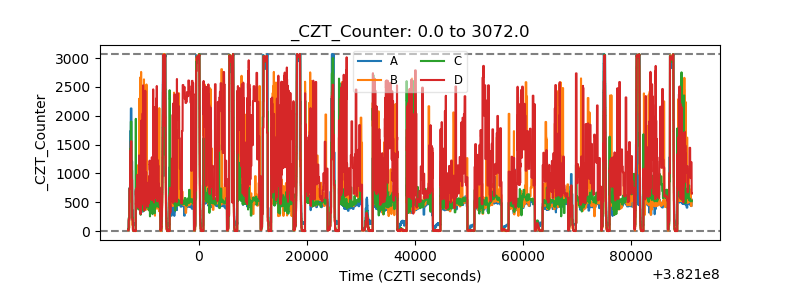 |
| +2.5 Volts monitor | 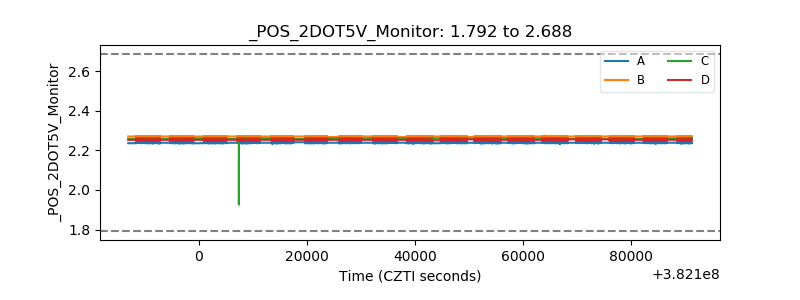 |
| +5 Volts monitor | 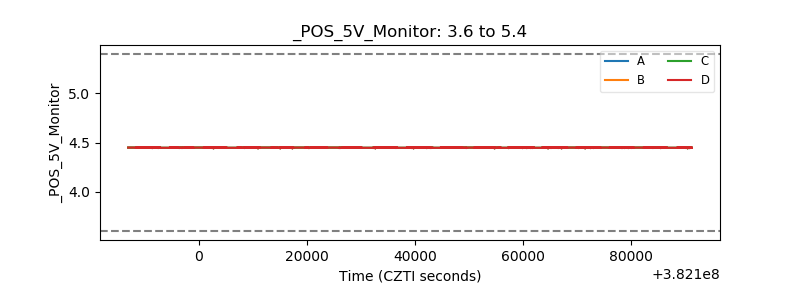 |
| _ROLL_ROT | 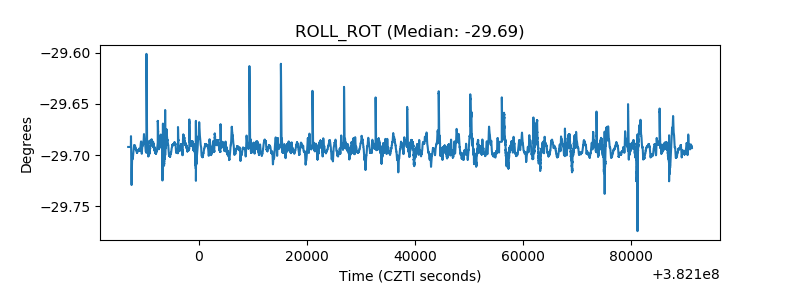 |
| _Roll_DEC | 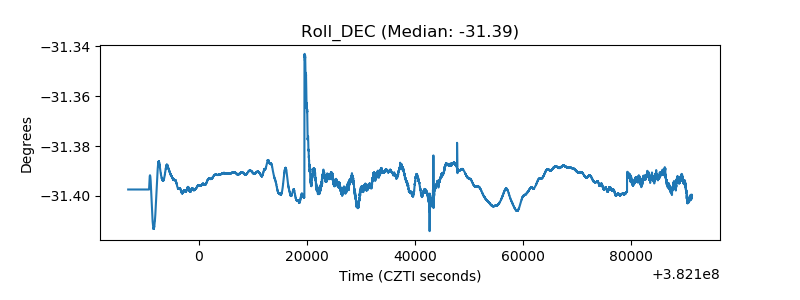 |
| _Roll_RA | 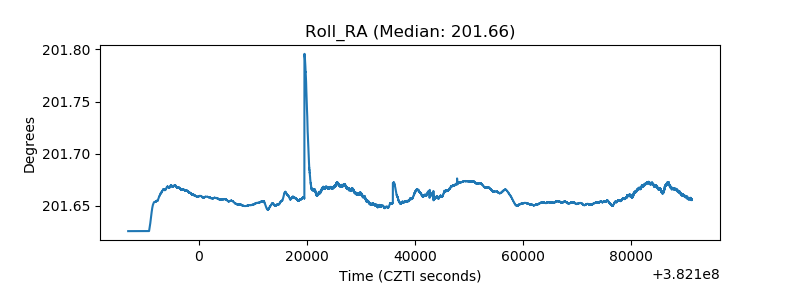 |
| Veto Counter | 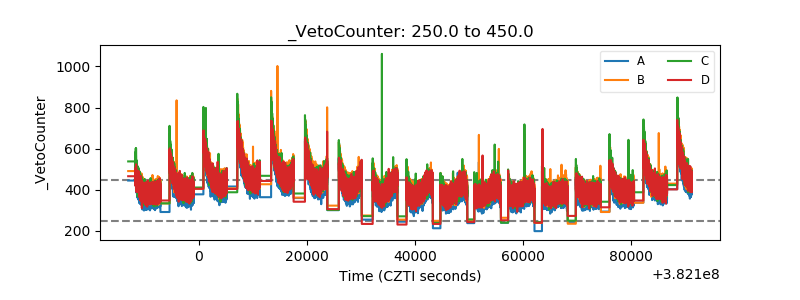 |