| Param | Original file | Final file |
|---|---|---|
| Filename | modeM0/AS1A05_082T10_9000004916_34430cztM0_level2.evt | modeM0/AS1A05_082T10_9000004916_34430cztM0_level2_quad_clean.evt |
| Size (bytes) | 972,950,400 | 134,625,600 |
| Size | 927.9 MB | 128.4 MB |
| Events in quadrant A | 5,692,830 | 826,831 |
| Events in quadrant B | 7,649,141 | 828,857 |
| Events in quadrant C | 6,212,979 | 832,130 |
| Events in quadrant D | 9,125,719 | 784,364 |
| Mode M9 | |||
|---|---|---|---|
| Quadrant | BADHDUFLAG | Total packets | Discarded packets |
| A | 0 | 41 | 0 |
| B | 0 | 41 | 0 |
| C | 0 | 41 | 0 |
| D | 0 | 41 | 0 |
| Mode SS | |||
|---|---|---|---|
| Quadrant | BADHDUFLAG | Total packets | Discarded packets |
| A | 0 | 238 | 0 |
| B | 0 | 238 | 0 |
| C | 0 | 238 | 0 |
| D | 0 | 238 | 0 |
| Mode M0 | |||
|---|---|---|---|
| Quadrant | BADHDUFLAG | Total packets | Discarded packets |
| A | 0 | 24223 | 4 |
| B | 0 | 30268 | 3 |
| C | 0 | 25591 | 3 |
| D | 0 | 35350 | 3 |
| Quadrant | Total seconds | Saturated seconds | Saturation percentage |
|---|---|---|---|
| A | 11633 | 37 | 0.318061% |
| B | 11633 | 560 | 4.813892% |
| C | 11633 | 40 | 0.343849% |
| D | 11633 | 419 | 3.601822% |
Noise dominated data is calculated using 1-second bins in cleaned event files. If a bin has >2000 counts, and if more than 50% of those come from <1% of pixels, then it is considered to be noise-dominated and hence unusable.
| Quadrant | # 1 sec bins | Bins with >0 counts | Bins with >2000 counts | High rate bins dominated by noise | Noise dominated (total time) | Noise dominated (detector-on time) | Marked lightcurve |
|---|---|---|---|---|---|---|---|
| A | 15723 | 11636 | 21 | 21 | 0.13% | 0.18% | 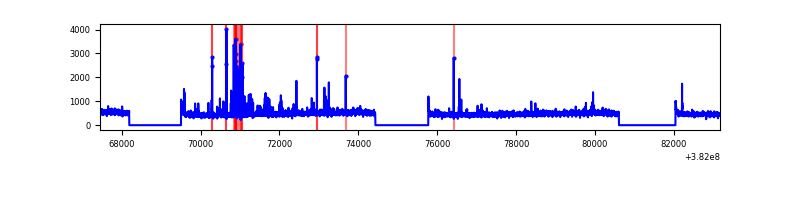 |
| B | 15723 | 11636 | 415 | 415 | 2.64% | 3.57% | 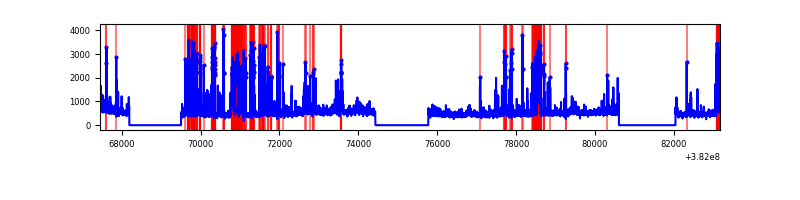 |
| C | 15723 | 11636 | 25 | 25 | 0.16% | 0.21% | 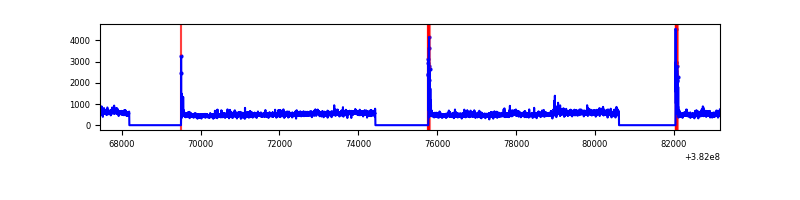 |
| D | 15723 | 11636 | 326 | 326 | 2.07% | 2.80% | 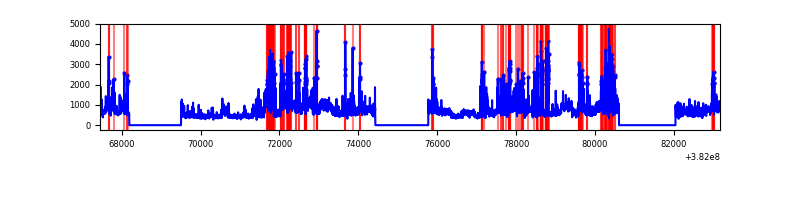 |
Top three noisy pixels from each quadrant. If the there are fewer than three noisy pixels in the level2.evt file, extra rows are filled as -1
| Pixel properties | Quadrant properties | ||||||
|---|---|---|---|---|---|---|---|
| Quadrant | DetID | PixID | Counts | Sigma | Mean | Median | Sigma |
| A | 7 | 16 | 260755 | 931.85 | 1384 | 1355 | 278.4 |
| A | 10 | 83 | 58538 | 205.42 | 1384 | 1355 | 278.4 |
| A | 13 | 254 | 21048 | 70.74 | 1384 | 1355 | 278.4 |
| B | 5 | 172 | 1830890 | 7020.03 | 1349 | 1313 | 260.6 |
| B | 0 | 190 | 220317 | 840.31 | 1349 | 1313 | 260.6 |
| B | 15 | 222 | 110020 | 417.11 | 1349 | 1313 | 260.6 |
| C | 15 | 214 | 480694 | 1543.99 | 1340 | 1350 | 310.5 |
| C | 14 | 67 | 292383 | 937.43 | 1340 | 1350 | 310.5 |
| C | 0 | 10 | 138083 | 440.42 | 1340 | 1350 | 310.5 |
| D | 8 | 195 | 1870857 | 5715.19 | 1330 | 1292 | 327.1 |
| D | 2 | 250 | 519898 | 1585.36 | 1330 | 1292 | 327.1 |
| D | 2 | 249 | 357249 | 1088.15 | 1330 | 1292 | 327.1 |
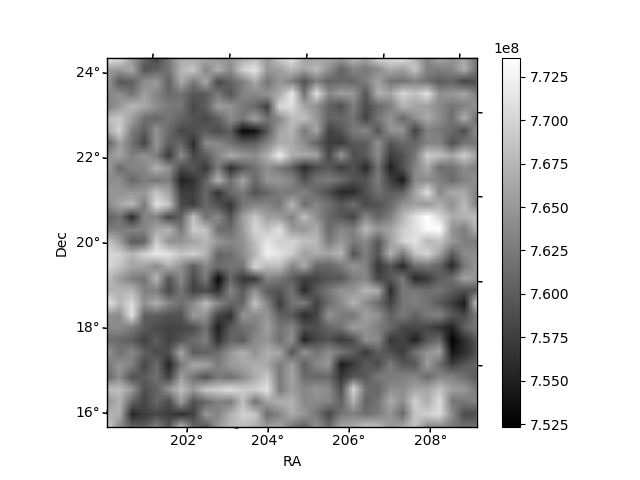
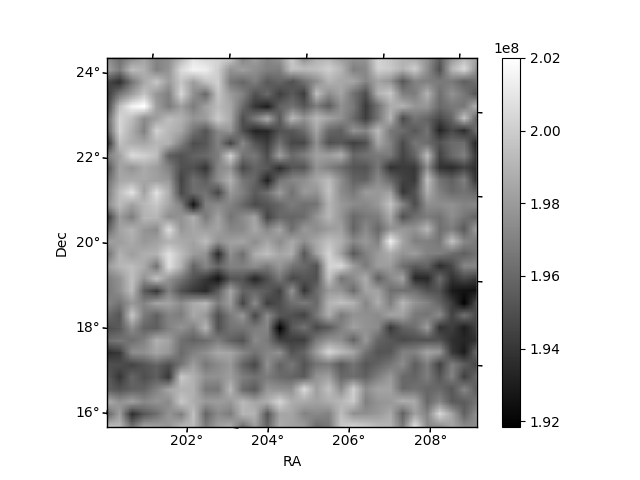
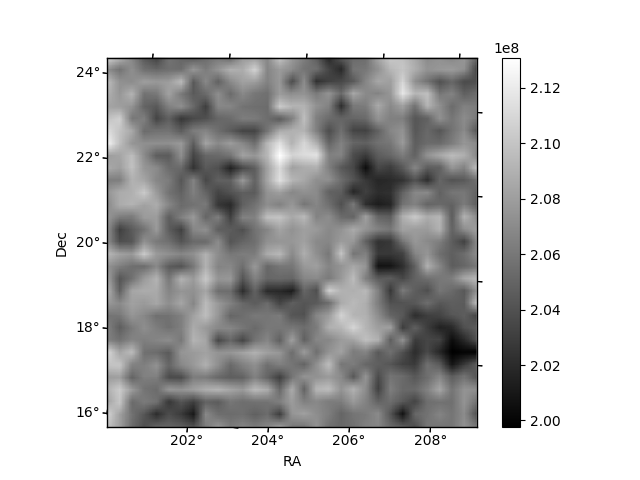
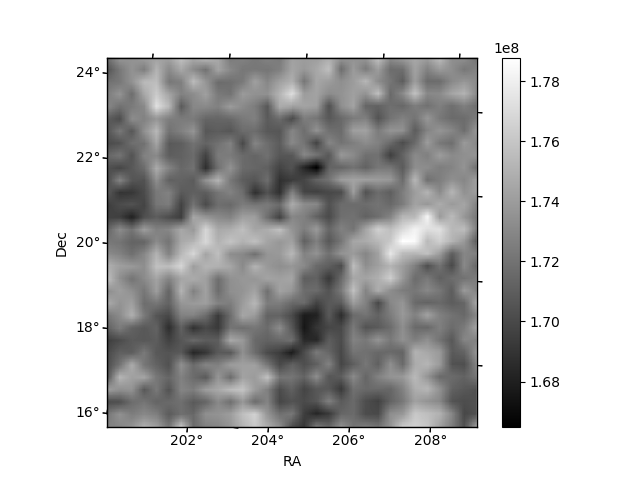
Histogram calculated using DETX and DETY for each event in the final _common_clean file
| Quadrant A | 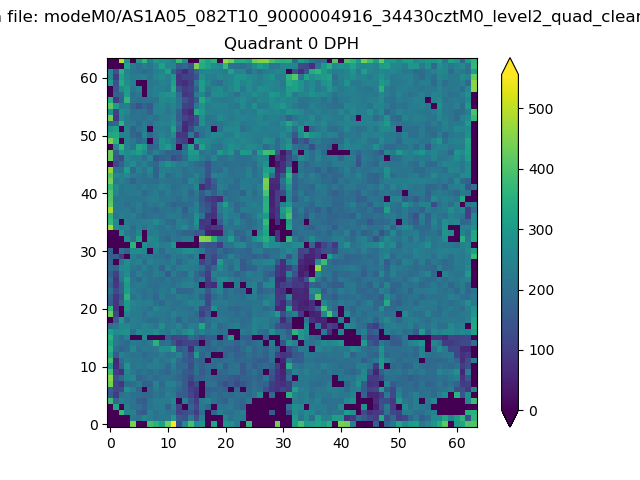 |
 |
Quadrant B |
|---|---|---|---|
| Quadrant D | 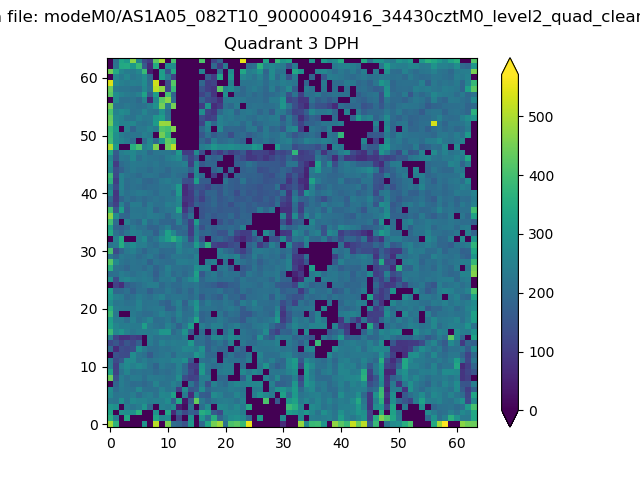 |
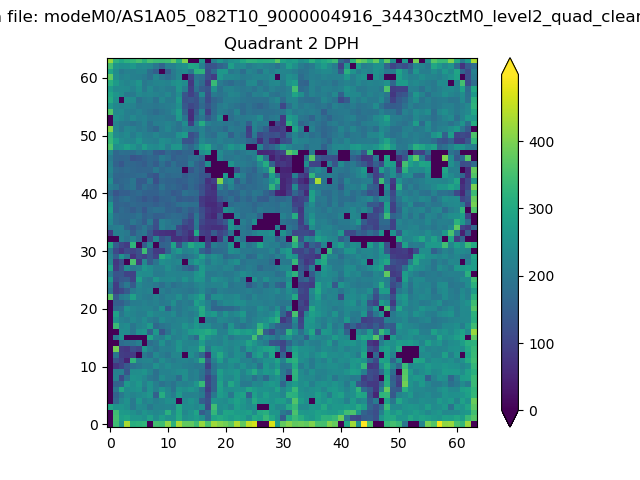 |
Quadrant C |
| Plot type | Count rate plots | Images |
|---|---|---|
| Comparison with Poisson distribution Blue bars denote a histogram of data divided into 1 sec bins. Red curve is a Poisson curve with rate = median count rate of data. |
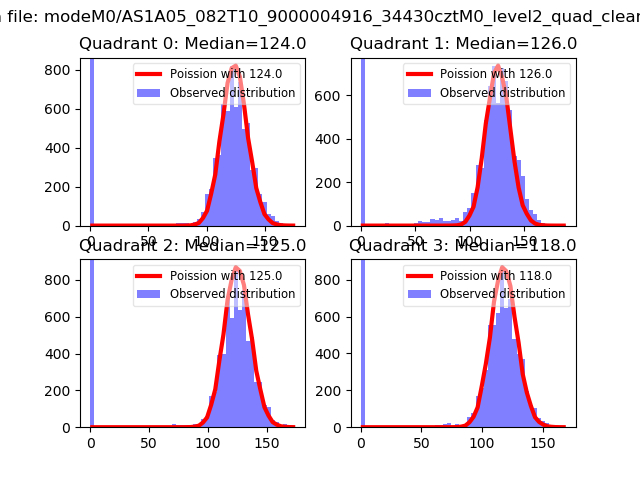 |
 |
| Quadrant-wise count rates Data is divided into 100 sec bins |
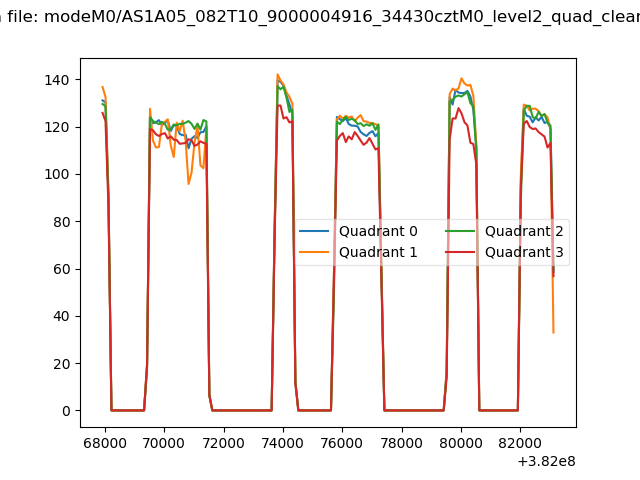 |
|
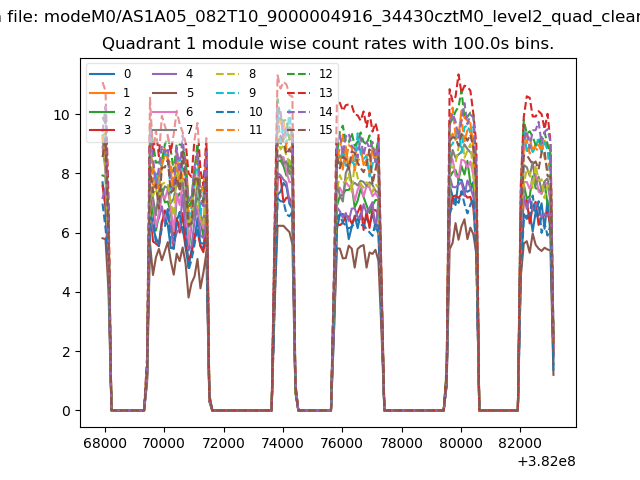
| Module-wise count rates for Quadrant A Data is divided into 100 sec bins |
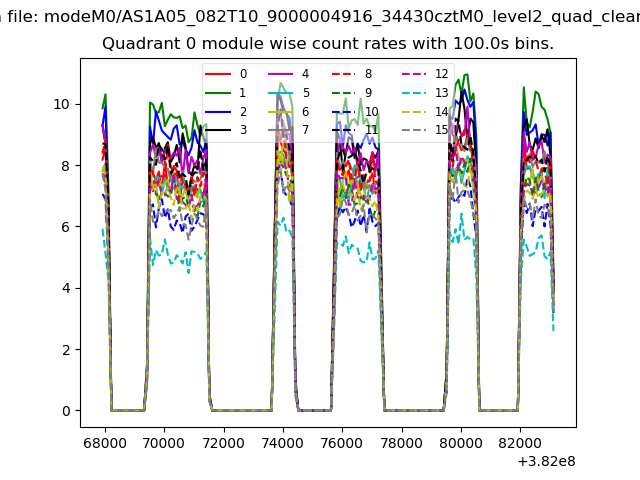 |
 |
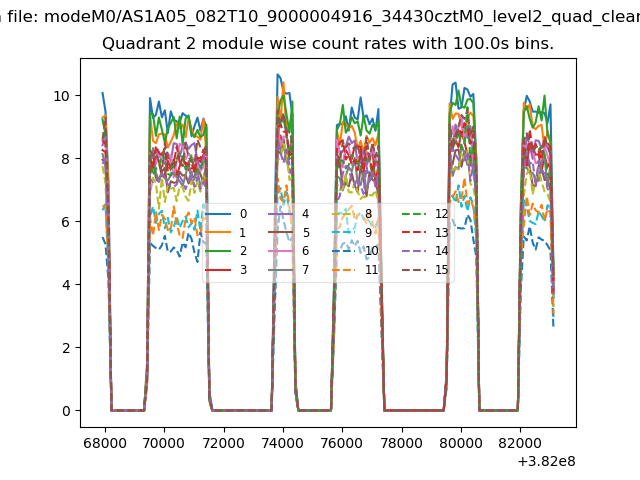
| Module-wise count rates for Quadrant B Data is divided into 100 sec bins |
 |
 |
| Module-wise count rates for Quadrant C Data is divided into 100 sec bins |
 |
 |
| Module-wise count rates for Quadrant D Data is divided into 100 sec bins |
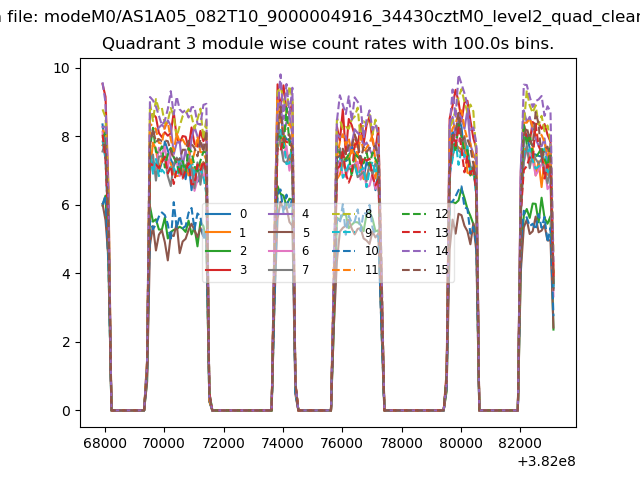 |
 |
| Parameter | Plot |
|---|---|
| CZT HV Monitor | 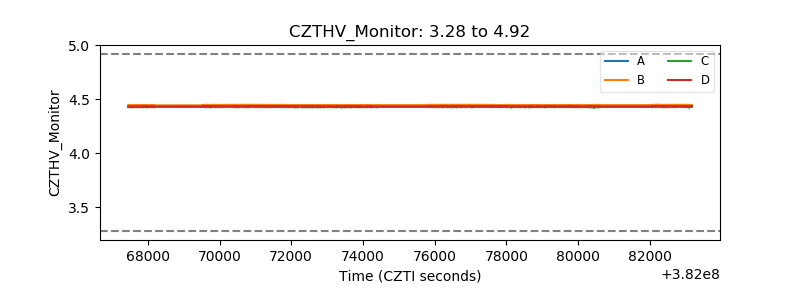 |
| D_VDD | 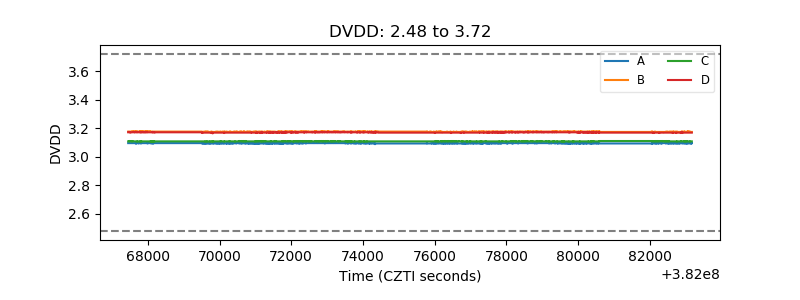 |
| Temperature 1 | 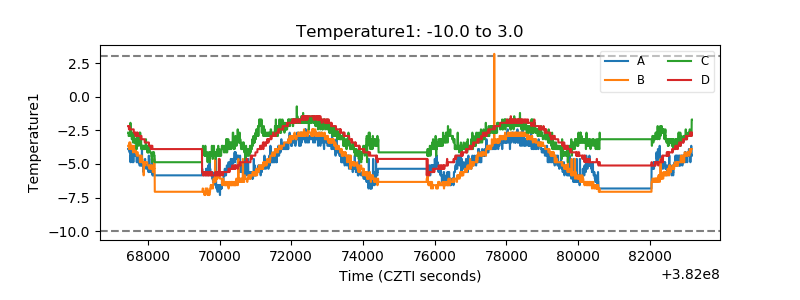 |
| Veto HV Monitor | 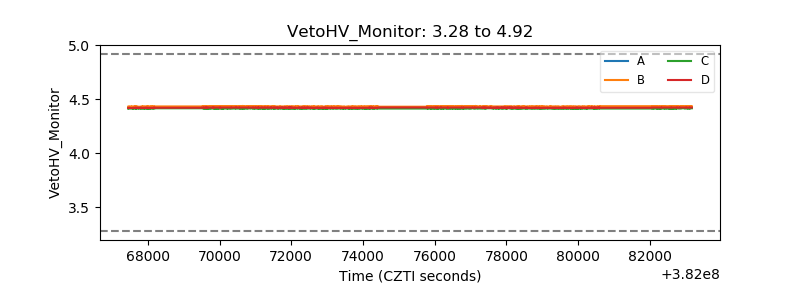 |
| Veto LLD | 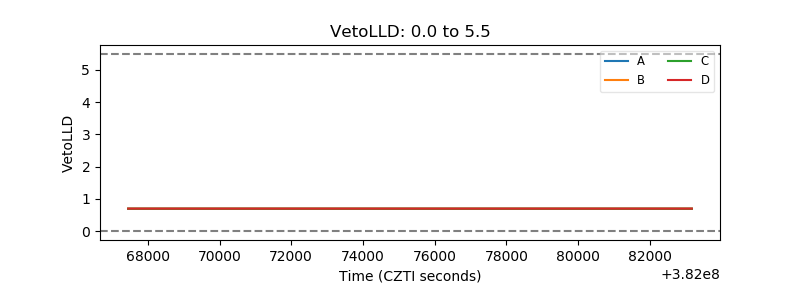 |
| Alpha Counter | 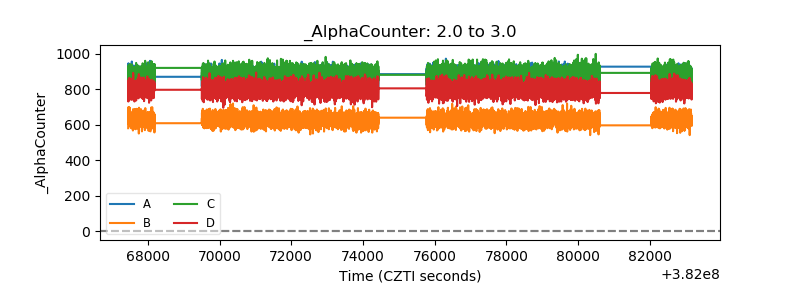 |
| _CPM_Rate | 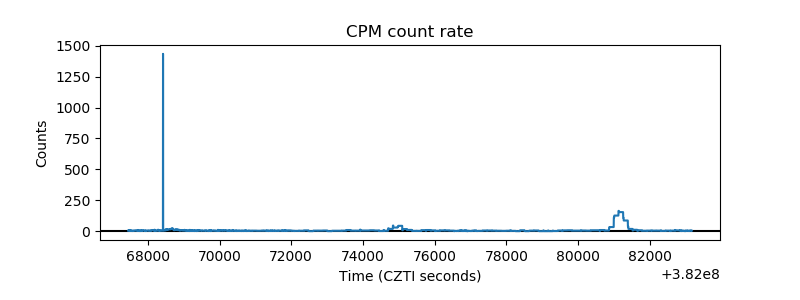 |
| CZT Counter | 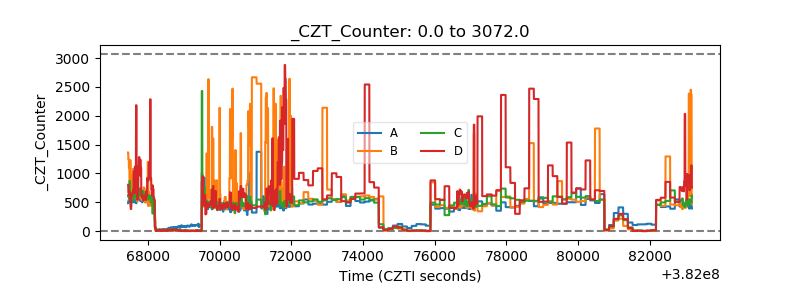 |
| +2.5 Volts monitor | 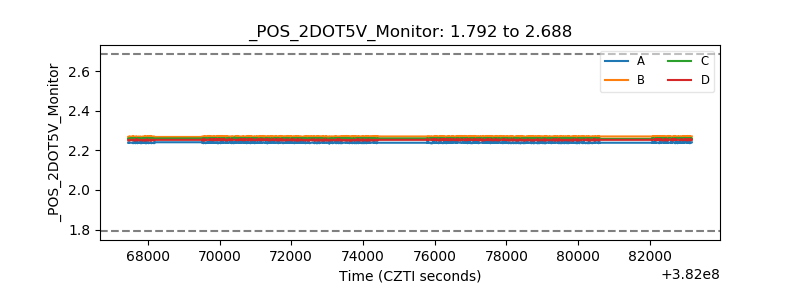 |
| +5 Volts monitor | 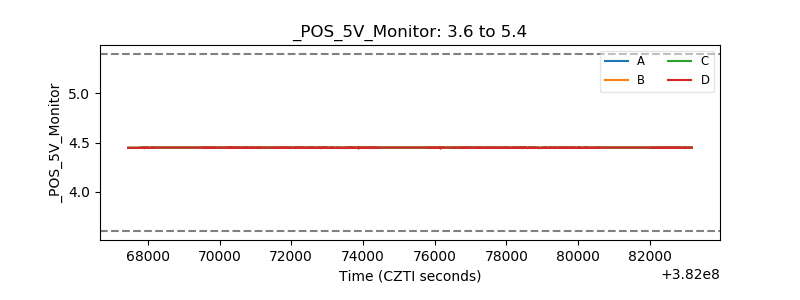 |
| _ROLL_ROT | 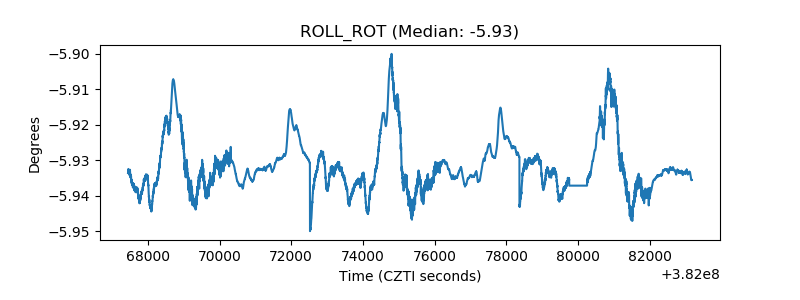 |
| _Roll_DEC | 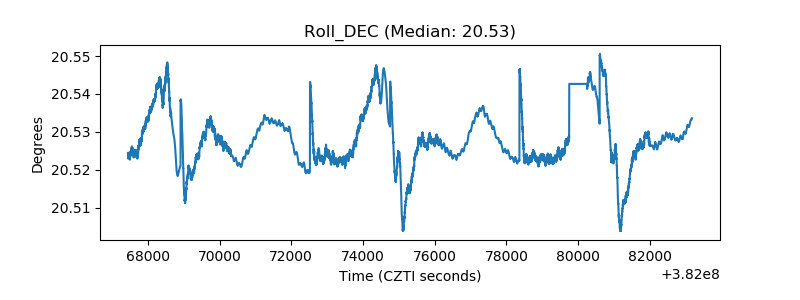 |
| _Roll_RA | 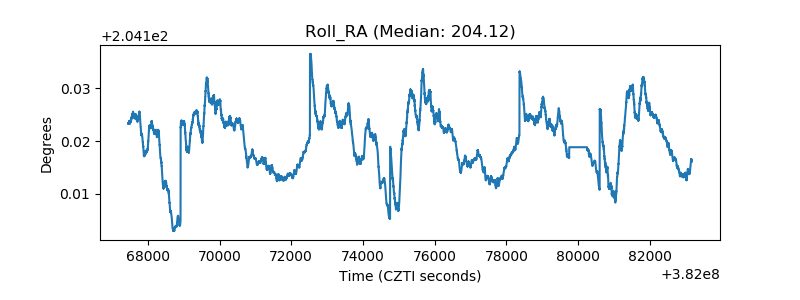 |
| Veto Counter | 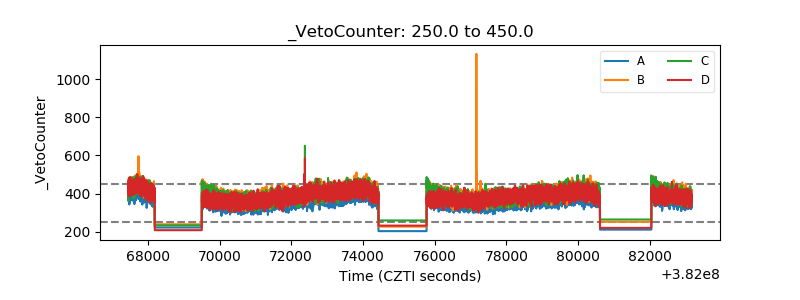 |