| Param | Original file | Final file |
|---|---|---|
| Filename | modeM0/AS1A05_082T10_9000004916_34428cztM0_level2.evt | modeM0/AS1A05_082T10_9000004916_34428cztM0_level2_quad_clean.evt |
| Size (bytes) | 457,545,600 | 56,859,840 |
| Size | 436.3 MB | 54.2 MB |
| Events in quadrant A | 2,726,133 | 341,515 |
| Events in quadrant B | 3,612,899 | 331,977 |
| Events in quadrant C | 2,960,091 | 342,035 |
| Events in quadrant D | 4,181,075 | 318,253 |
| Mode M9 | |||
|---|---|---|---|
| Quadrant | BADHDUFLAG | Total packets | Discarded packets |
| A | 0 | 27 | 4 |
| B | 0 | 27 | 6 |
| C | 0 | 27 | 1 |
| D | 0 | 27 | 2 |
| Mode SS | |||
|---|---|---|---|
| Quadrant | BADHDUFLAG | Total packets | Discarded packets |
| A | 0 | 137 | 31 |
| B | 0 | 136 | 17 |
| C | 0 | 138 | 18 |
| D | 0 | 137 | 22 |
| Mode M0 | |||
|---|---|---|---|
| Quadrant | BADHDUFLAG | Total packets | Discarded packets |
| A | 0 | 14024 | 2372 |
| B | 0 | 17629 | 3210 |
| C | 0 | 14831 | 2568 |
| D | 0 | 20179 | 3875 |
| Quadrant | Total seconds | Saturated seconds | Saturation percentage |
|---|---|---|---|
| A | 5603 | 14 | 0.249866% |
| B | 5473 | 285 | 5.207382% |
| C | 5567 | 10 | 0.179630% |
| D | 5456 | 249 | 4.563783% |
Noise dominated data is calculated using 1-second bins in cleaned event files. If a bin has >2000 counts, and if more than 50% of those come from <1% of pixels, then it is considered to be noise-dominated and hence unusable.
| Quadrant | # 1 sec bins | Bins with >0 counts | Bins with >2000 counts | High rate bins dominated by noise | Noise dominated (total time) | Noise dominated (detector-on time) | Marked lightcurve |
|---|---|---|---|---|---|---|---|
| A | 9418 | 6185 | 2 | 2 | 0.02% | 0.03% | 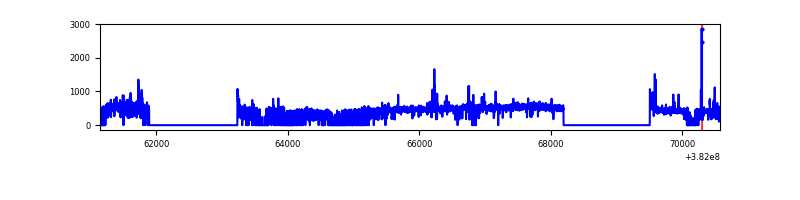 |
| B | 9422 | 6087 | 181 | 181 | 1.92% | 2.97% | 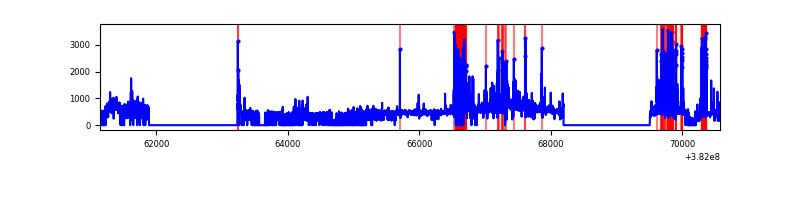 |
| C | 9427 | 6200 | 3 | 3 | 0.03% | 0.05% | 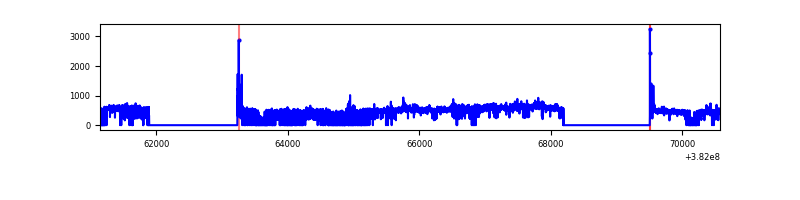 |
| D | 9405 | 6076 | 156 | 156 | 1.66% | 2.57% | 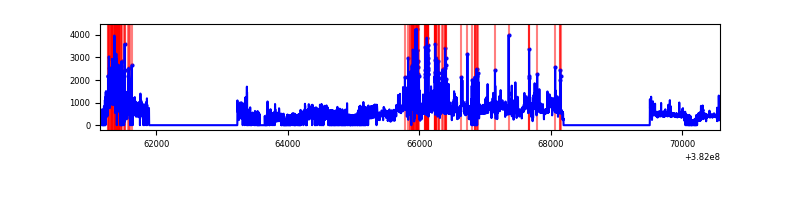 |
Top three noisy pixels from each quadrant. If the there are fewer than three noisy pixels in the level2.evt file, extra rows are filled as -1
| Pixel properties | Quadrant properties | ||||||
|---|---|---|---|---|---|---|---|
| Quadrant | DetID | PixID | Counts | Sigma | Mean | Median | Sigma |
| A | 7 | 16 | 60805 | 440.56 | 673 | 658 | 136.5 |
| A | 10 | 83 | 33868 | 243.25 | 673 | 658 | 136.5 |
| A | 9 | 143 | 15700 | 110.18 | 673 | 658 | 136.5 |
| B | 5 | 172 | 757639 | 6100.25 | 638 | 619 | 124.1 |
| B | 0 | 190 | 225544 | 1812.5 | 638 | 619 | 124.1 |
| B | 3 | 112 | 29152 | 229.93 | 638 | 619 | 124.1 |
| C | 15 | 214 | 233094 | 1547.28 | 646 | 652 | 150.2 |
| C | 14 | 67 | 112868 | 746.98 | 646 | 652 | 150.2 |
| C | 0 | 10 | 38996 | 255.24 | 646 | 652 | 150.2 |
| D | 8 | 195 | 729172 | 4679.53 | 626 | 608 | 155.7 |
| D | 7 | 80 | 219405 | 1405.32 | 626 | 608 | 155.7 |
| D | 13 | 249 | 202849 | 1298.98 | 626 | 608 | 155.7 |
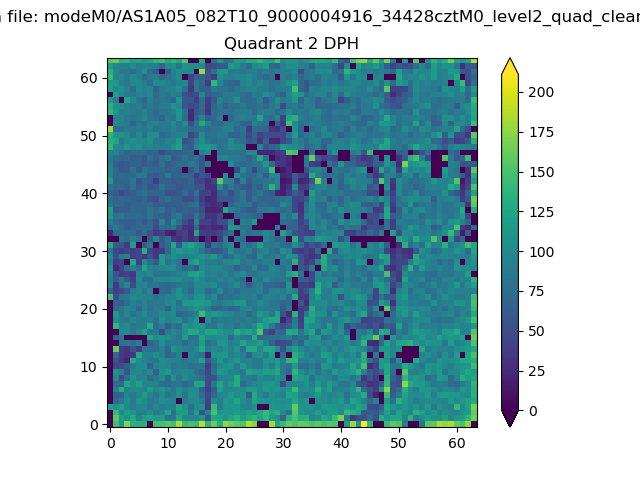
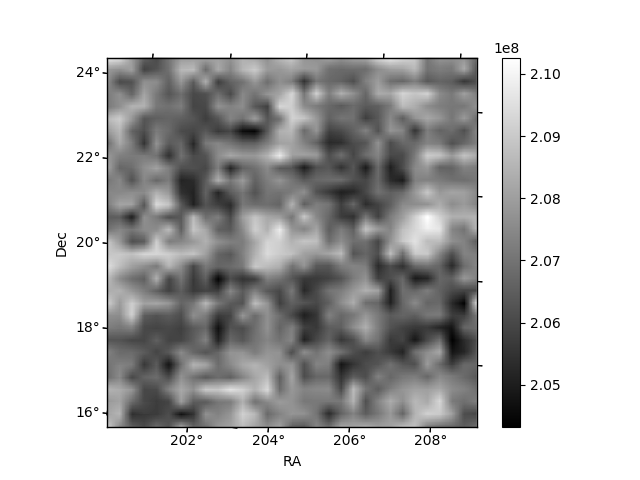
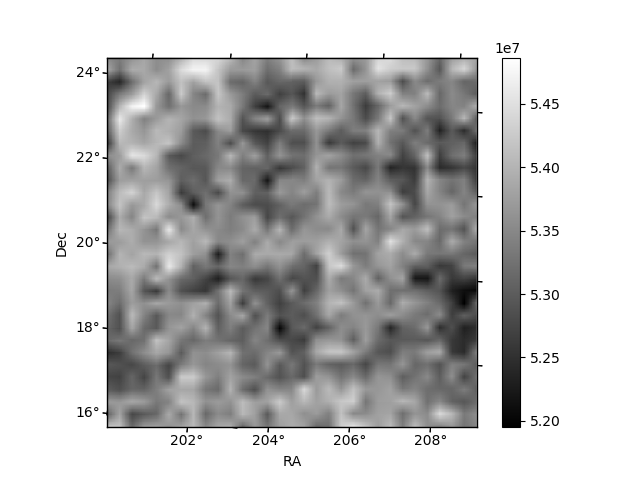
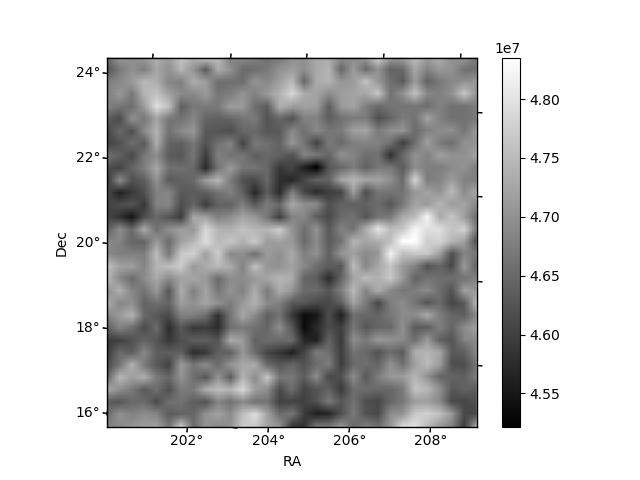
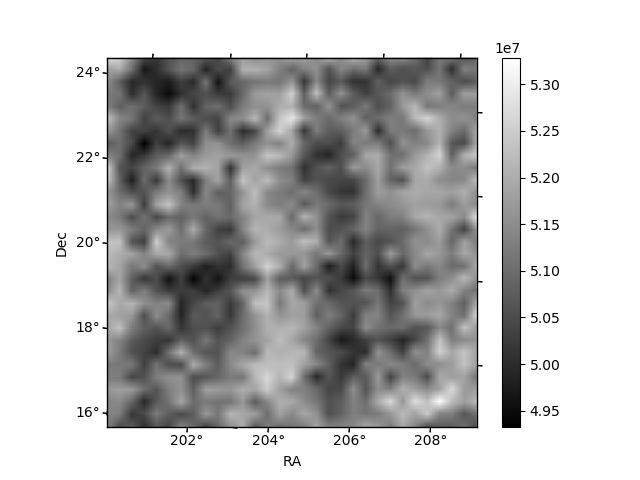
Histogram calculated using DETX and DETY for each event in the final _common_clean file
| Quadrant A | 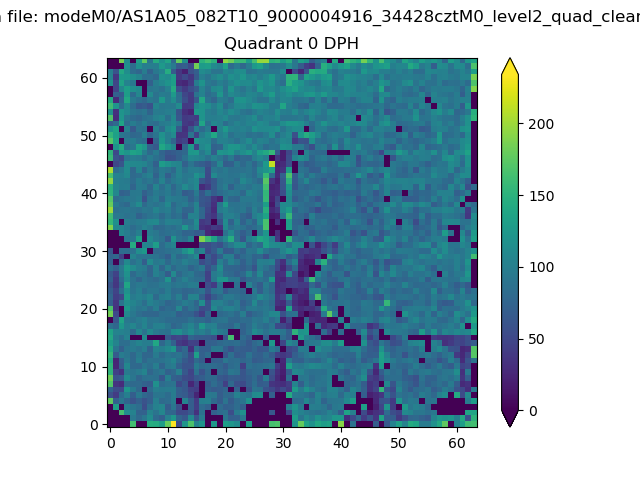 |
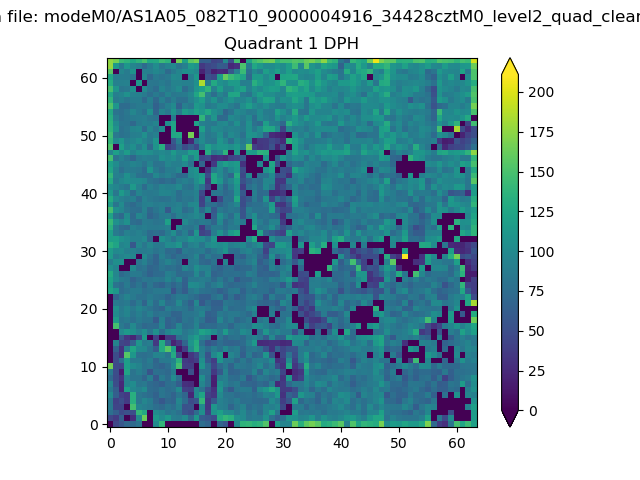 |
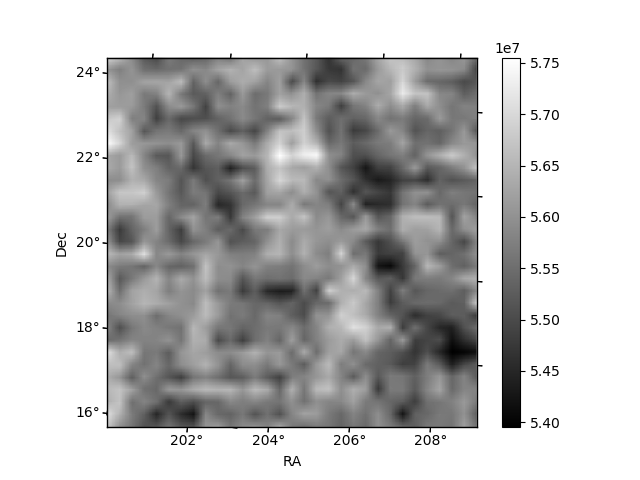
Quadrant B |
|---|---|---|---|
| Quadrant D | 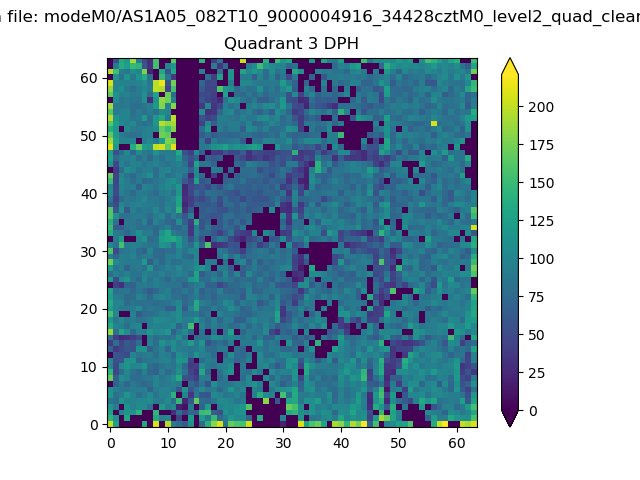 |
 |
Quadrant C |
| Plot type | Count rate plots | Images |
|---|---|---|
| Comparison with Poisson distribution Blue bars denote a histogram of data divided into 1 sec bins. Red curve is a Poisson curve with rate = median count rate of data. |
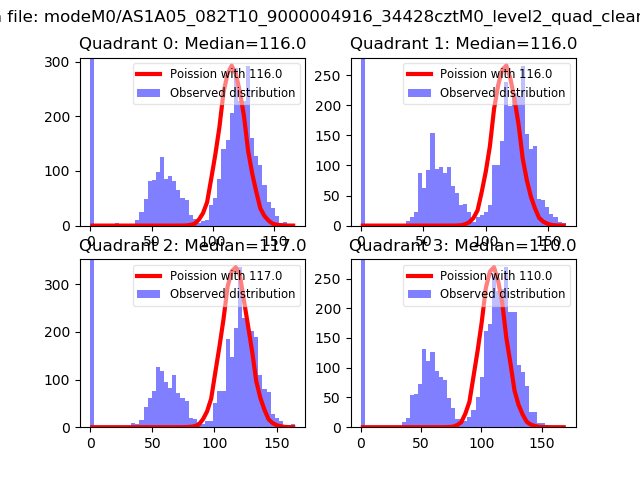 |
 |
| Quadrant-wise count rates Data is divided into 100 sec bins |
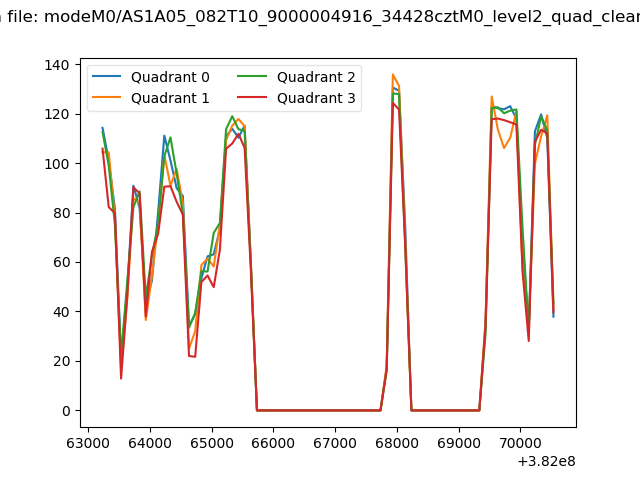 |
|
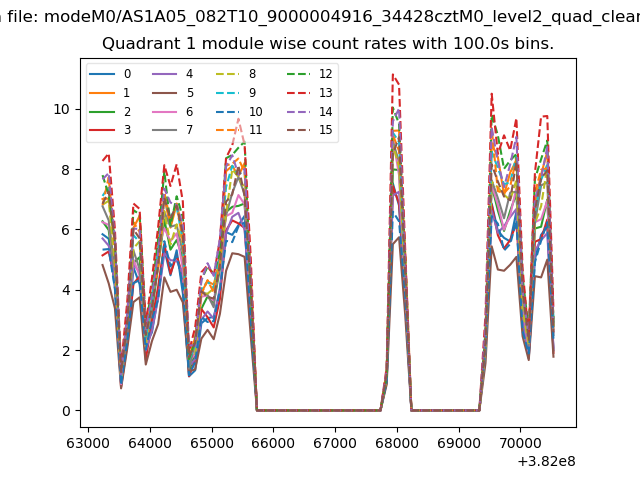
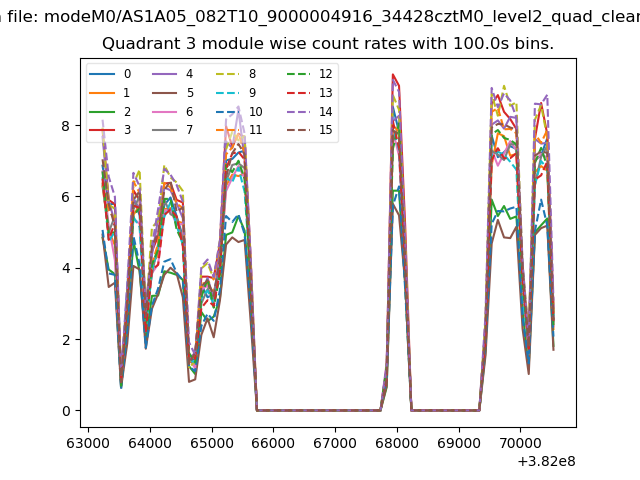
| Module-wise count rates for Quadrant A Data is divided into 100 sec bins |
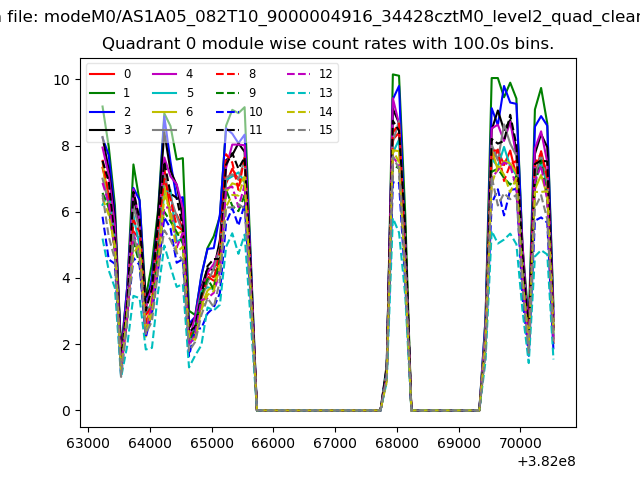 |
 |
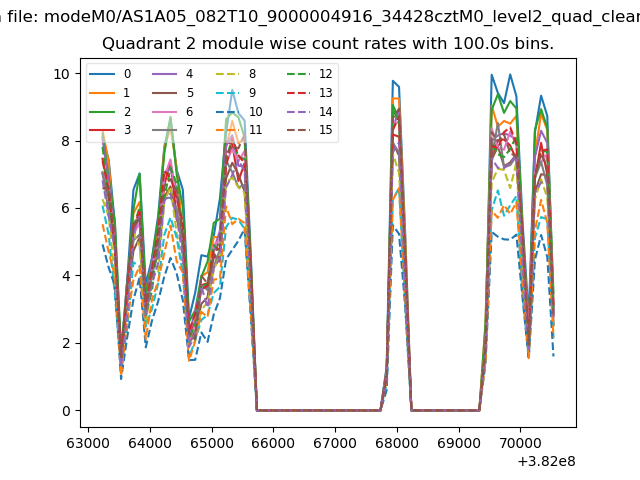
| Module-wise count rates for Quadrant B Data is divided into 100 sec bins |
 |
 |
| Module-wise count rates for Quadrant C Data is divided into 100 sec bins |
 |
 |
| Module-wise count rates for Quadrant D Data is divided into 100 sec bins |
 |
 |
| Parameter | Plot |
|---|---|
| CZT HV Monitor |  |
| D_VDD | 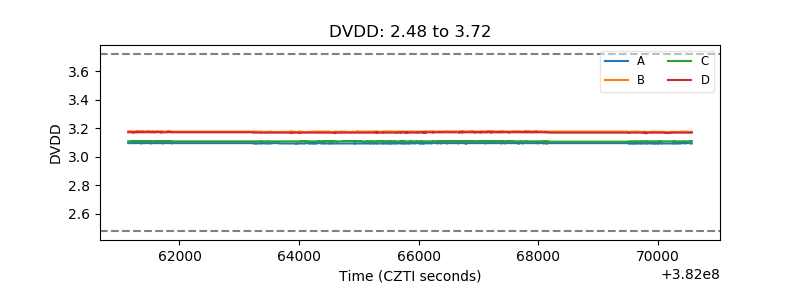 |
| Temperature 1 | 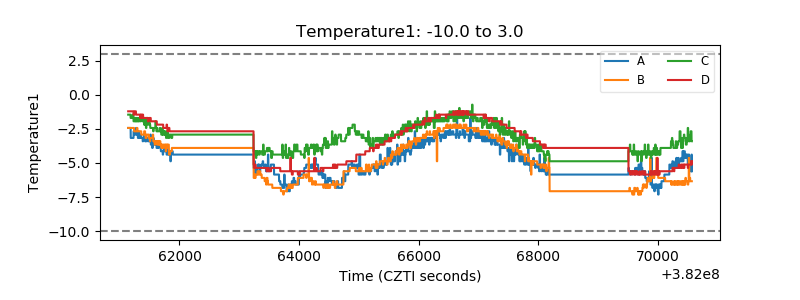 |
| Veto HV Monitor | 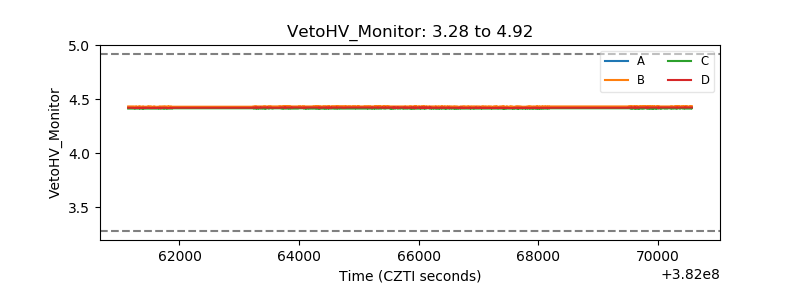 |
| Veto LLD | 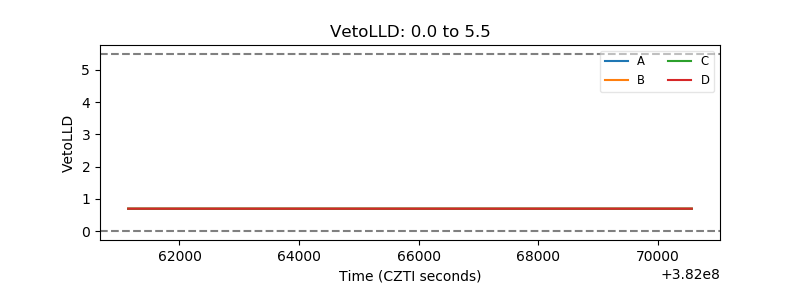 |
| Alpha Counter | 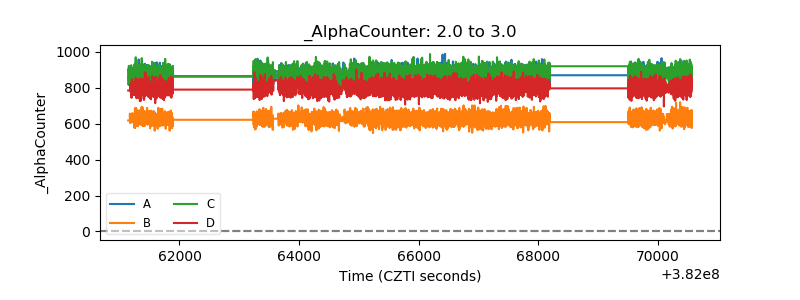 |
| _CPM_Rate | 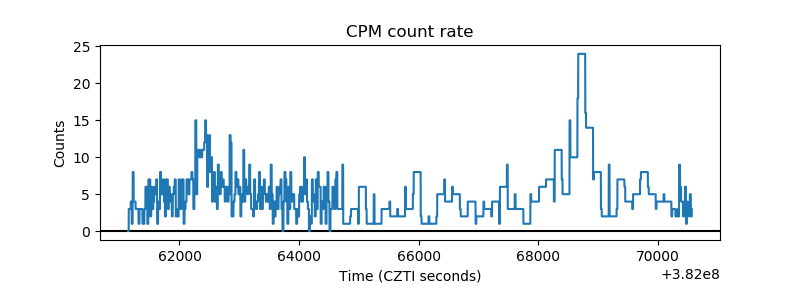 |
| CZT Counter | 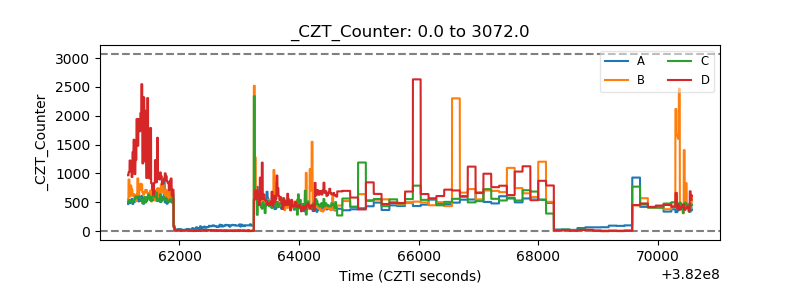 |
| +2.5 Volts monitor | 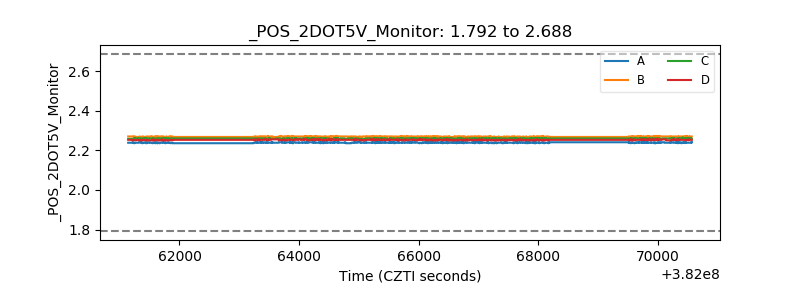 |
| +5 Volts monitor | 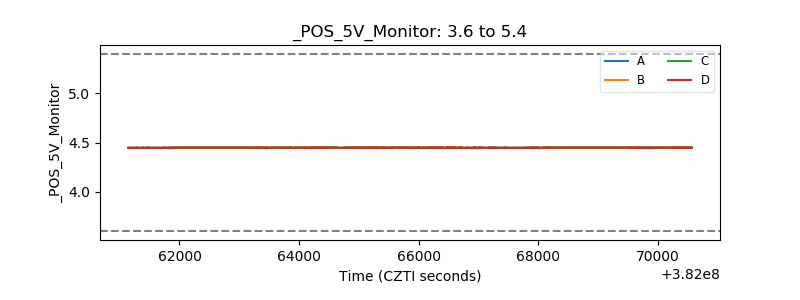 |
| _ROLL_ROT | 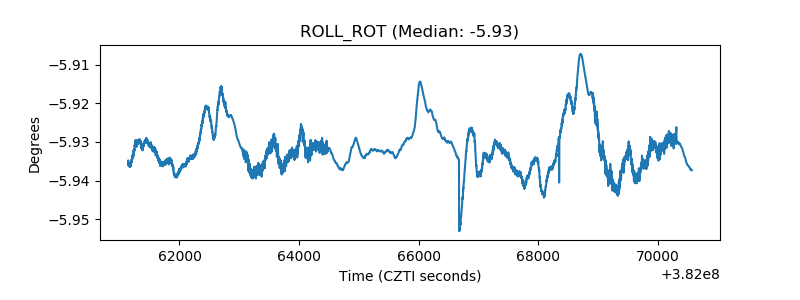 |
| _Roll_DEC | 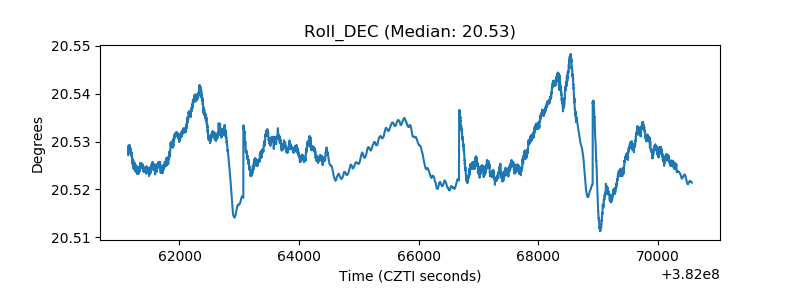 |
| _Roll_RA | 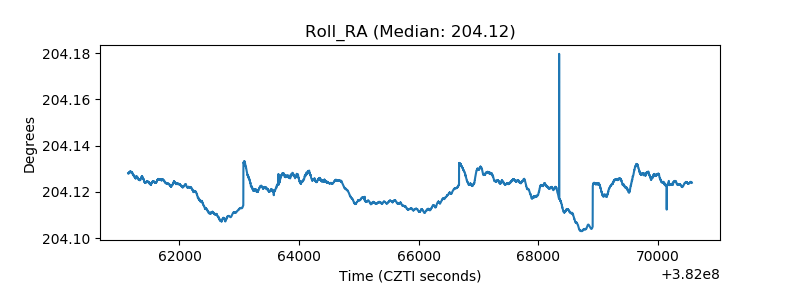 |
| Veto Counter | 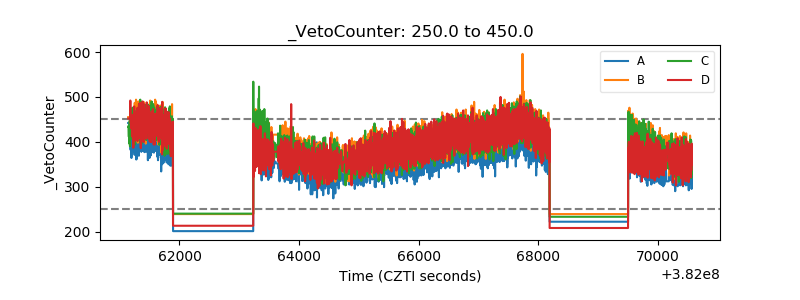 |