| Param | Original file | Final file |
|---|---|---|
| Filename | modeM0/AS1A05_082T10_9000004916cztM0_level2_bc.evt | modeM0/AS1A05_082T10_9000004916cztM0_level2_quad_clean.evt |
| Size (bytes) | 951,197,760 | 247,458,240 |
| Size | 907.1 MB | 236.0 MB |
| Events in quadrant A | 4,420,718 | 1,535,398 |
| Events in quadrant B | 6,288,658 | 1,550,083 |
| Events in quadrant C | 5,736,275 | 1,535,931 |
| Events in quadrant D | 10,933,353 | 1,433,567 |
| Mode M9 | |||
|---|---|---|---|
| Quadrant | BADHDUFLAG | Total packets | Discarded packets |
| A | 0 | 61 | 0 |
| B | 0 | 61 | 0 |
| C | 0 | 61 | 0 |
| D | 0 | 61 | 0 |
| Mode SS | |||
|---|---|---|---|
| Quadrant | BADHDUFLAG | Total packets | Discarded packets |
| A | 0 | 426 | 0 |
| B | 0 | 426 | 0 |
| C | 0 | 426 | 0 |
| D | 0 | 426 | 0 |
| Mode M0 | |||
|---|---|---|---|
| Quadrant | BADHDUFLAG | Total packets | Discarded packets |
| A | 0 | 42922 | 0 |
| B | 0 | 51926 | 0 |
| C | 0 | 45622 | 0 |
| D | 0 | 65718 | 0 |
| Quadrant | Total seconds | Saturated seconds | Saturation percentage |
|---|---|---|---|
| A | 20912 | 39 | 0.186496% |
| B | 20912 | 778 | 3.720352% |
| C | 20912 | 46 | 0.219969% |
| D | 20912 | 1082 | 5.174063% |
Noise dominated data is calculated using 1-second bins in cleaned event files. If a bin has >2000 counts, and if more than 50% of those come from <1% of pixels, then it is considered to be noise-dominated and hence unusable.
| Quadrant | # 1 sec bins | Bins with >0 counts | Bins with >2000 counts | High rate bins dominated by noise | Noise dominated (total time) | Noise dominated (detector-on time) | Marked lightcurve |
|---|---|---|---|---|---|---|---|
| A | 39172 | 20915 | 0 | 0 | 0.00% | 0.00% | 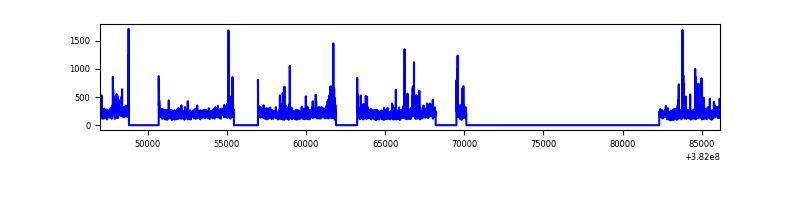 |
| B | 39172 | 20913 | 31 | 31 | 0.08% | 0.15% | 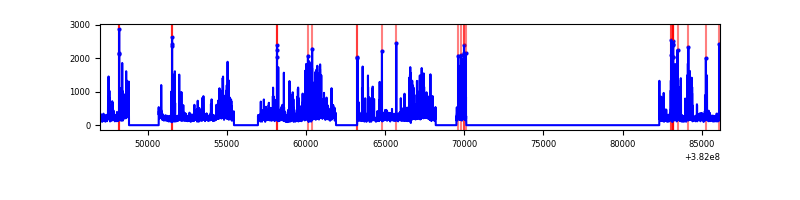 |
| C | 39172 | 20913 | 7 | 7 | 0.02% | 0.03% | 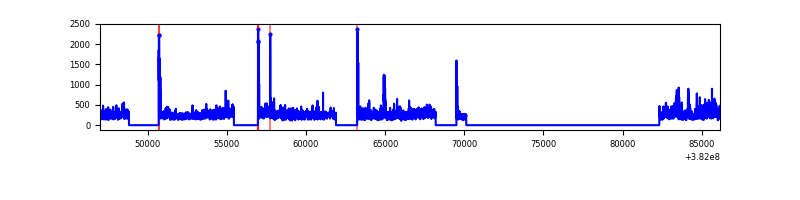 |
| D | 39172 | 20913 | 151 | 151 | 0.39% | 0.72% | 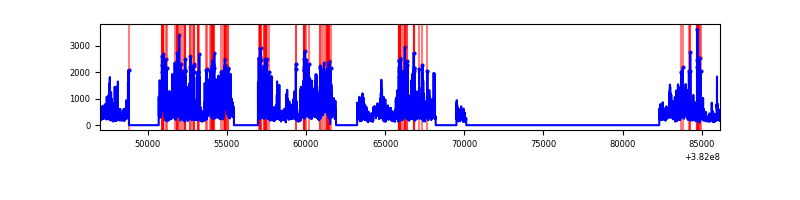 |
Top three noisy pixels from each quadrant. If the there are fewer than three noisy pixels in the level2.evt file, extra rows are filled as -1
| Pixel properties | Quadrant properties | ||||||
|---|---|---|---|---|---|---|---|
| Quadrant | DetID | PixID | Counts | Sigma | Mean | Median | Sigma |
| A | 7 | 16 | 110975 | 463.24 | 1072 | 1053 | 237.3 |
| A | 10 | 83 | 80271 | 333.85 | 1072 | 1053 | 237.3 |
| A | 13 | 6 | 40745 | 167.27 | 1072 | 1053 | 237.3 |
| B | 5 | 172 | 1347186 | 6374.06 | 1061 | 1038 | 211.2 |
| B | 0 | 190 | 510175 | 2410.78 | 1061 | 1038 | 211.2 |
| B | 0 | 229 | 76049 | 355.18 | 1061 | 1038 | 211.2 |
| C | 15 | 214 | 823184 | 3457.74 | 1046 | 1036 | 237.8 |
| C | 14 | 67 | 533409 | 2239.02 | 1046 | 1036 | 237.8 |
| C | 0 | 10 | 125130 | 521.91 | 1046 | 1036 | 237.8 |
| D | 8 | 195 | 2980312 | 12089.54 | 1030 | 999 | 246.4 |
| D | 7 | 80 | 1433941 | 5814.63 | 1030 | 999 | 246.4 |
| D | 2 | 250 | 584929 | 2369.49 | 1030 | 999 | 246.4 |
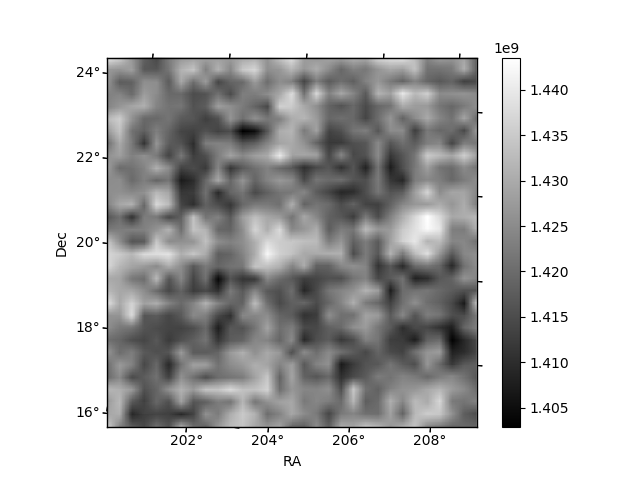
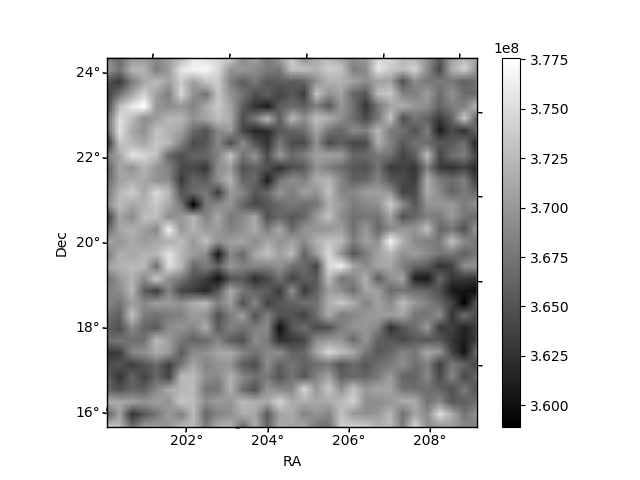
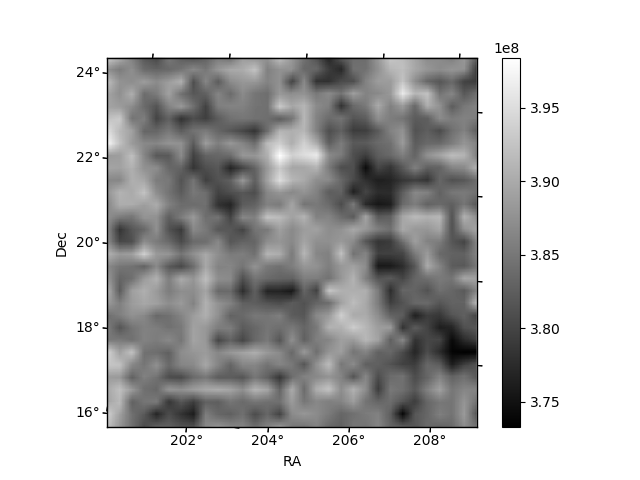
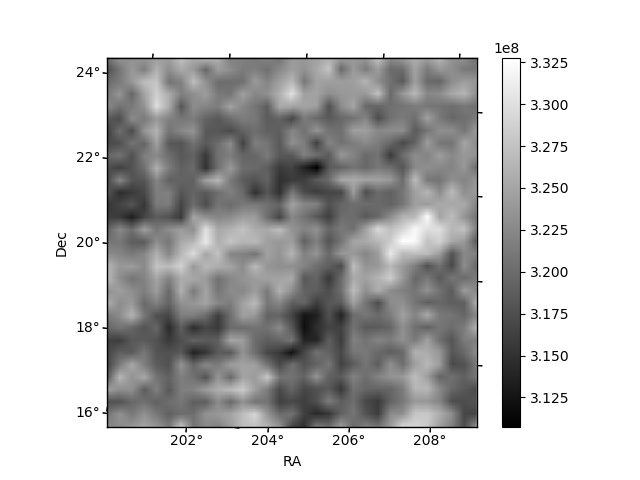
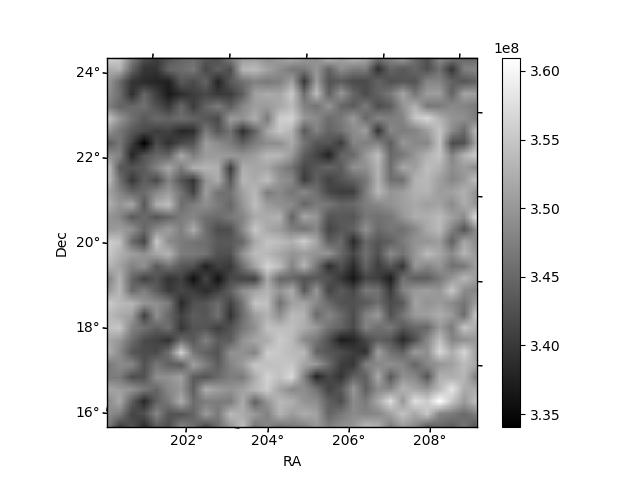
Histogram calculated using DETX and DETY for each event in the final _common_clean file
| Quadrant A | 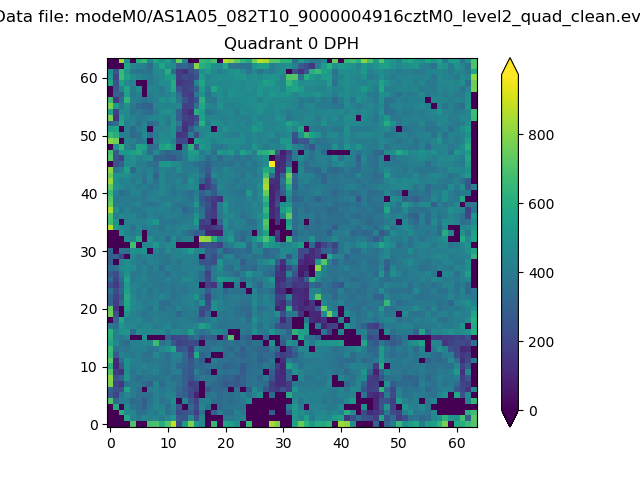 |
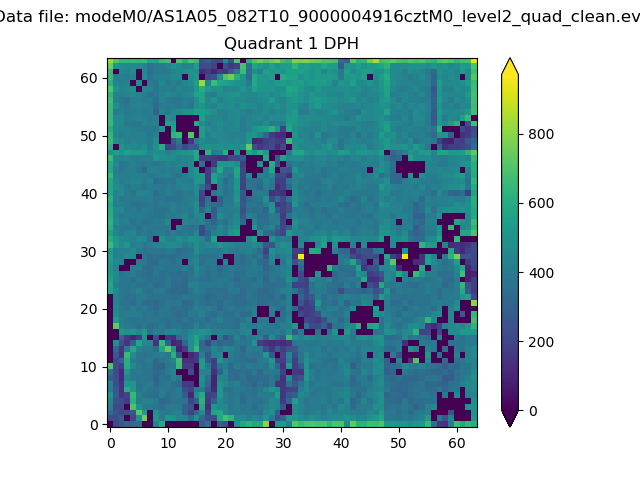 |
Quadrant B |
|---|---|---|---|
| Quadrant D | 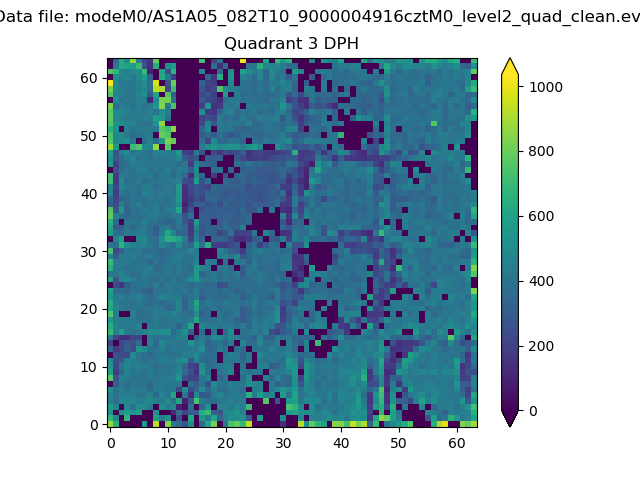 |
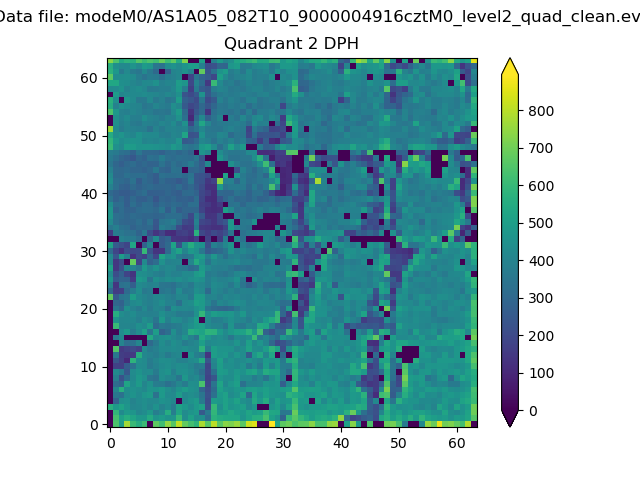 |
Quadrant C |
| Plot type | Count rate plots | Images |
|---|---|---|
| Comparison with Poisson distribution Blue bars denote a histogram of data divided into 1 sec bins. Red curve is a Poisson curve with rate = median count rate of data. |
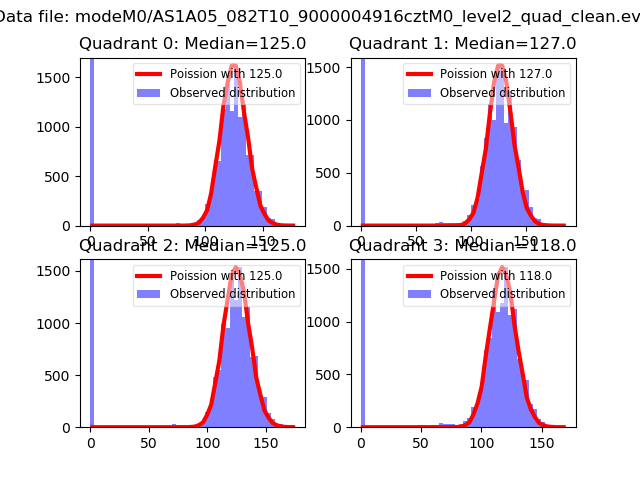 |
 |
| Quadrant-wise count rates Data is divided into 100 sec bins |
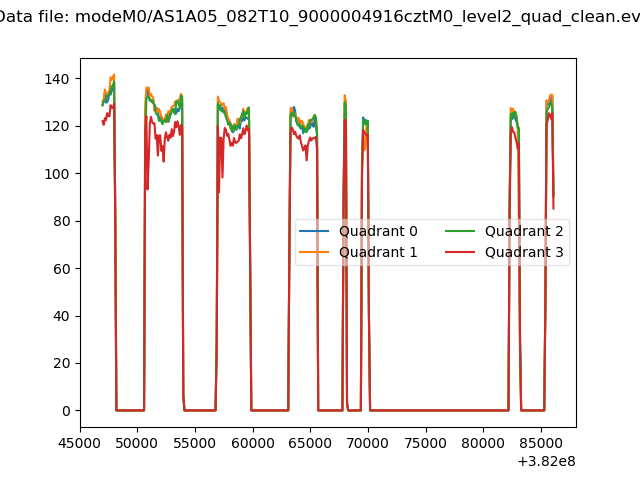 |
|
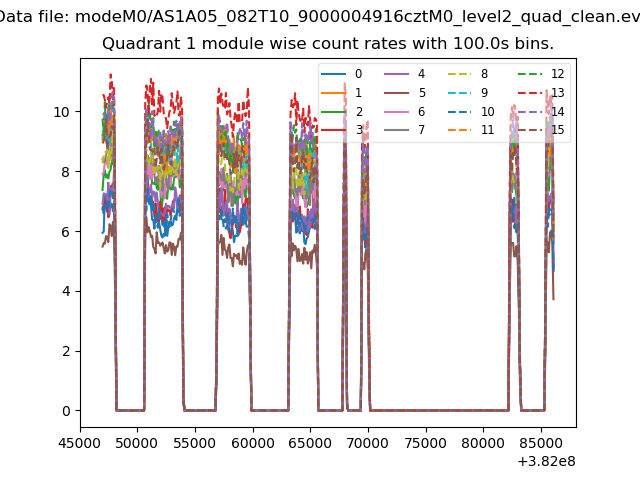
| Module-wise count rates for Quadrant A Data is divided into 100 sec bins |
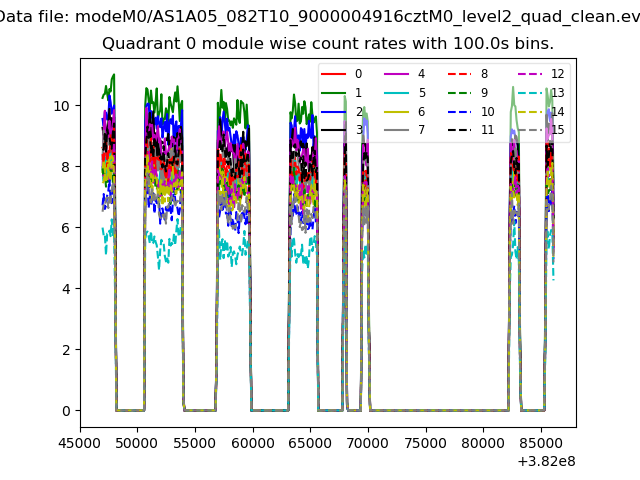 |
 |
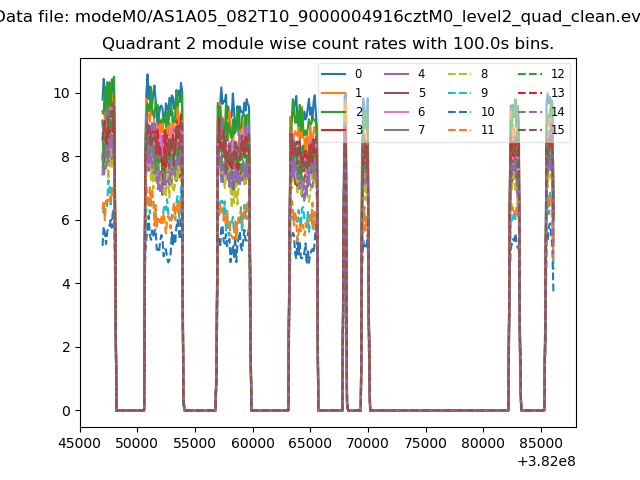
| Module-wise count rates for Quadrant B Data is divided into 100 sec bins |
 |
 |
| Module-wise count rates for Quadrant C Data is divided into 100 sec bins |
 |
 |
| Module-wise count rates for Quadrant D Data is divided into 100 sec bins |
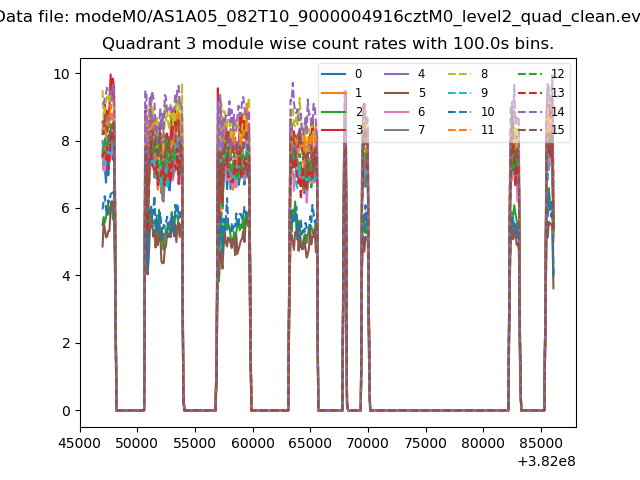 |
 |
| Parameter | Plot |
|---|---|
| CZT HV Monitor | 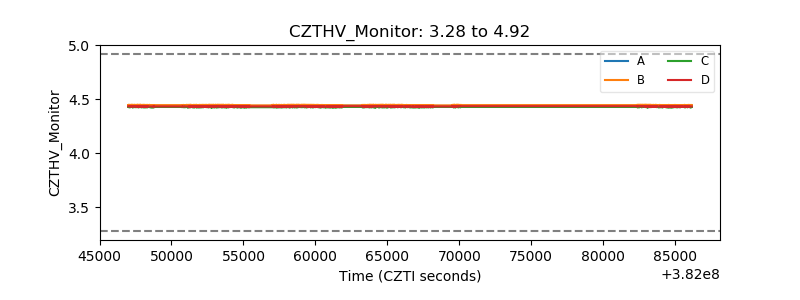 |
| D_VDD | 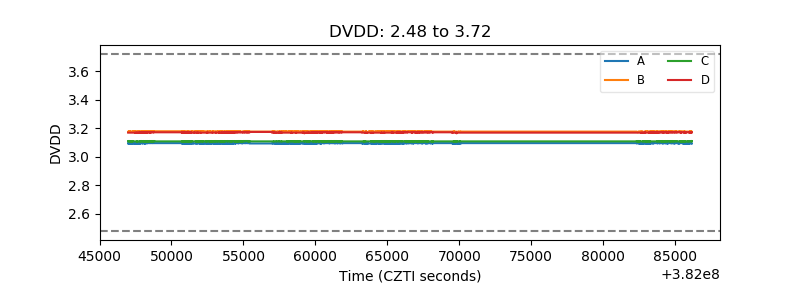 |
| Temperature 1 | 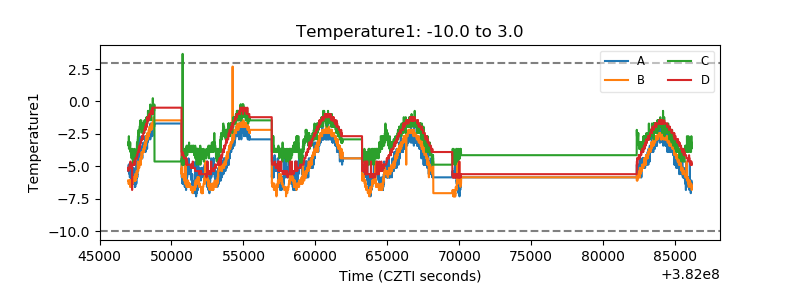 |
| Veto HV Monitor | 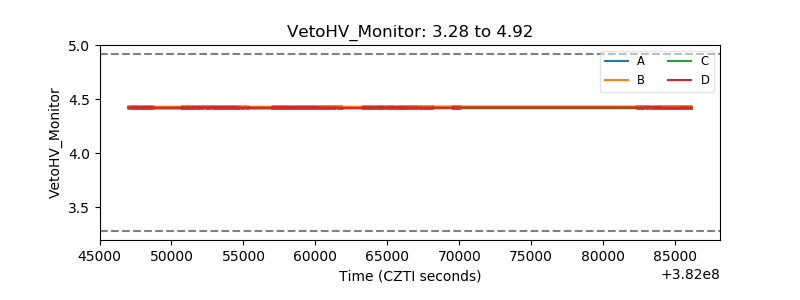 |
| Veto LLD | 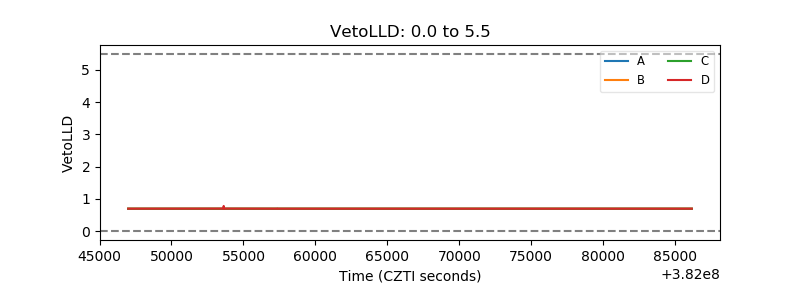 |
| Alpha Counter |  |
| _CPM_Rate | 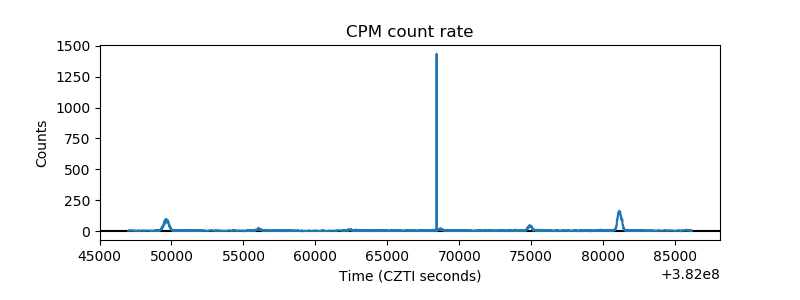 |
| CZT Counter | 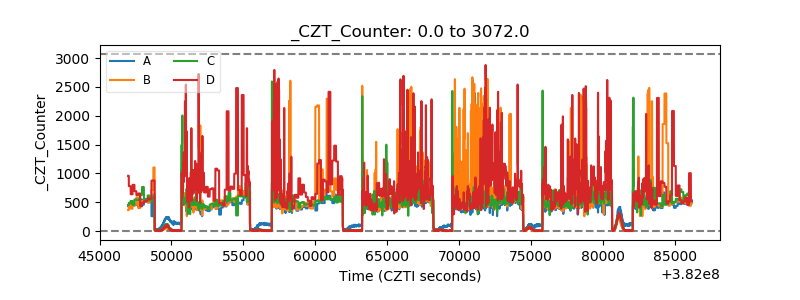 |
| +2.5 Volts monitor | 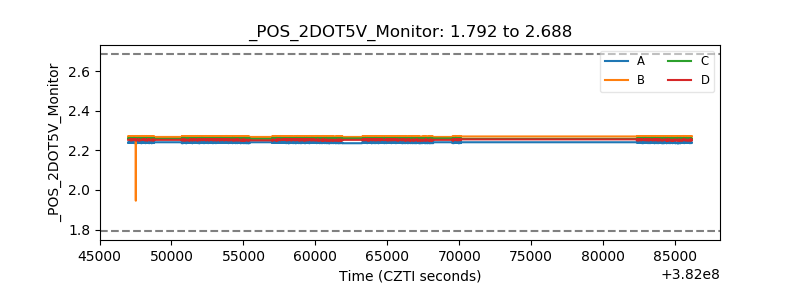 |
| +5 Volts monitor | 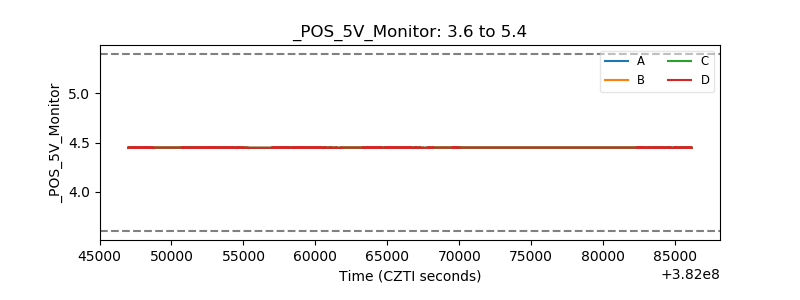 |
| _ROLL_ROT | 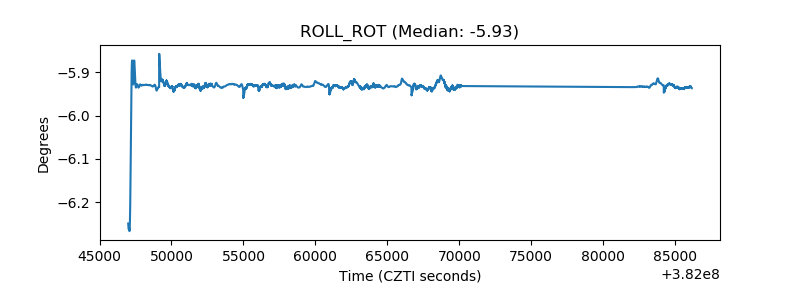 |
| _Roll_DEC | 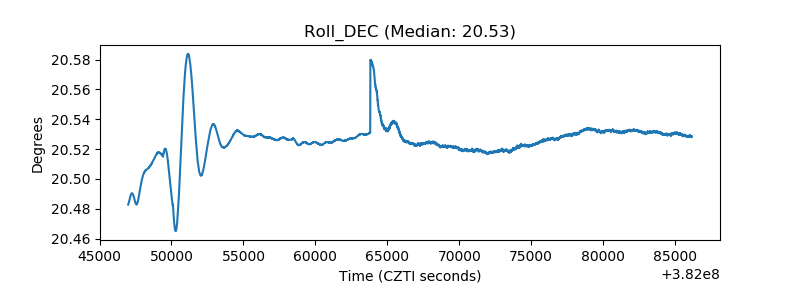 |
| _Roll_RA | 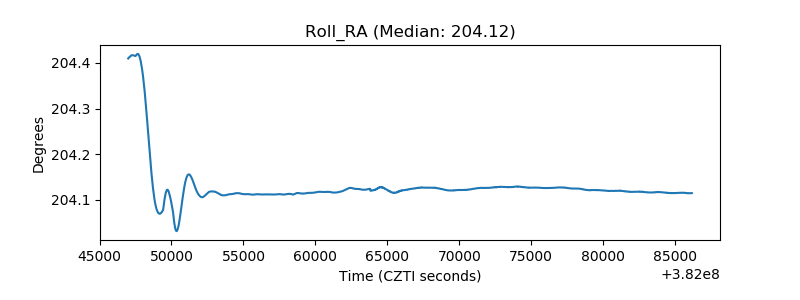 |
| Veto Counter | 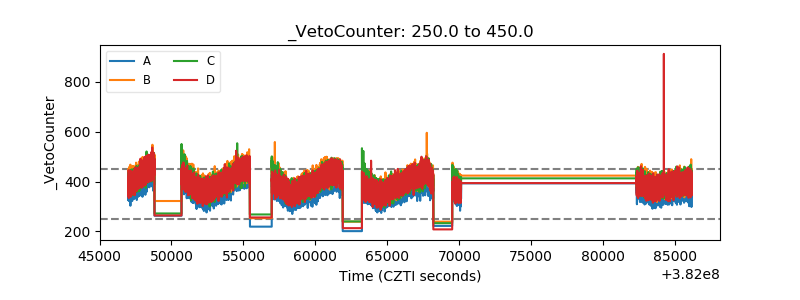 |