| Param | Original file | Final file |
|---|---|---|
| Filename | modeM0/AS1A05_108T02_9000004914_34598cztM0_level2.evt | modeM0/AS1A05_108T02_9000004914_34598cztM0_level2_quad_clean.evt |
| Size (bytes) | 352,589,760 | 35,164,800 |
| Size | 336.3 MB | 33.5 MB |
| Events in quadrant A | 1,809,363 | 218,236 |
| Events in quadrant B | 2,447,121 | 209,067 |
| Events in quadrant C | 2,002,103 | 208,584 |
| Events in quadrant D | 4,176,040 | 174,690 |
| Mode SS | |||
|---|---|---|---|
| Quadrant | BADHDUFLAG | Total packets | Discarded packets |
| A | 0 | 87 | 17 |
| B | 0 | 86 | 10 |
| C | 0 | 87 | 7 |
| D | 0 | 86 | 12 |
| Mode M9 | |||
|---|---|---|---|
| Quadrant | BADHDUFLAG | Total packets | Discarded packets |
| A | 0 | 22 | 1 |
| B | 0 | 23 | 2 |
| C | 0 | 22 | 1 |
| D | 0 | 21 | 0 |
| Mode M0 | |||
|---|---|---|---|
| Quadrant | BADHDUFLAG | Total packets | Discarded packets |
| A | 0 | 8628 | 1104 |
| B | 0 | 10828 | 1366 |
| C | 0 | 9099 | 1193 |
| D | 0 | 18150 | 3203 |
| Quadrant | Total seconds | Saturated seconds | Saturation percentage |
|---|---|---|---|
| A | 3646 | 7 | 0.191991% |
| B | 3599 | 193 | 5.362601% |
| C | 3616 | 18 | 0.497788% |
| D | 3425 | 220 | 6.423358% |
Noise dominated data is calculated using 1-second bins in cleaned event files. If a bin has >2000 counts, and if more than 50% of those come from <1% of pixels, then it is considered to be noise-dominated and hence unusable.
| Quadrant | # 1 sec bins | Bins with >0 counts | Bins with >2000 counts | High rate bins dominated by noise | Noise dominated (total time) | Noise dominated (detector-on time) | Marked lightcurve |
|---|---|---|---|---|---|---|---|
| A | 6233 | 3873 | 3 | 3 | 0.05% | 0.08% | 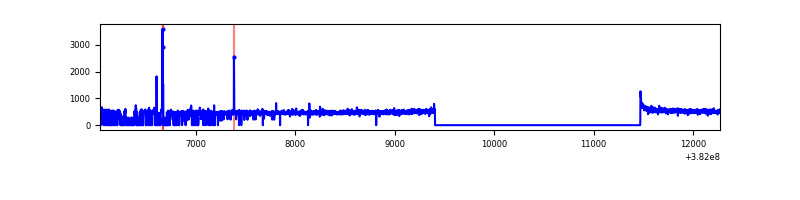 |
| B | 6231 | 3810 | 139 | 139 | 2.23% | 3.65% | 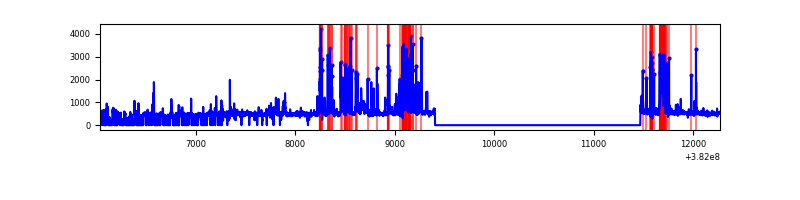 |
| C | 6233 | 3831 | 12 | 12 | 0.19% | 0.31% | 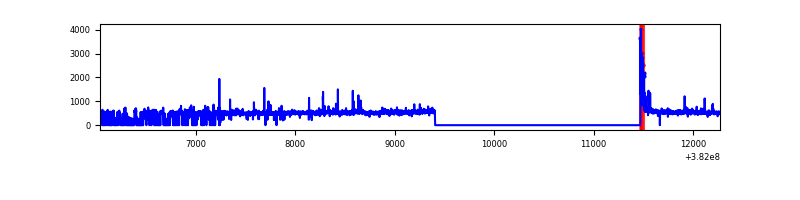 |
| D | 6232 | 3625 | 249 | 249 | 4.00% | 6.87% | 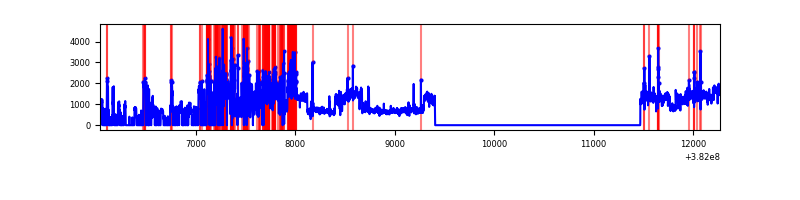 |
Top three noisy pixels from each quadrant. If the there are fewer than three noisy pixels in the level2.evt file, extra rows are filled as -1
| Pixel properties | Quadrant properties | ||||||
|---|---|---|---|---|---|---|---|
| Quadrant | DetID | PixID | Counts | Sigma | Mean | Median | Sigma |
| A | 10 | 83 | 24893 | 263.47 | 454 | 446 | 92.8 |
| A | 9 | 143 | 20600 | 217.2 | 454 | 446 | 92.8 |
| A | 13 | 254 | 6893 | 69.48 | 454 | 446 | 92.8 |
| B | 5 | 172 | 498286 | 5874.45 | 433 | 423 | 84.8 |
| B | 5 | 255 | 114745 | 1348.92 | 433 | 423 | 84.8 |
| B | 0 | 189 | 63672 | 746.3 | 433 | 423 | 84.8 |
| C | 15 | 214 | 151682 | 1495.06 | 432 | 437 | 101.2 |
| C | 0 | 10 | 52939 | 518.98 | 432 | 437 | 101.2 |
| C | 0 | 207 | 45557 | 446.01 | 432 | 437 | 101.2 |
| D | 8 | 195 | 1894917 | 16948.68 | 401 | 395 | 111.8 |
| D | 7 | 38 | 444692 | 3974.75 | 401 | 395 | 111.8 |
| D | 13 | 249 | 105560 | 940.82 | 401 | 395 | 111.8 |
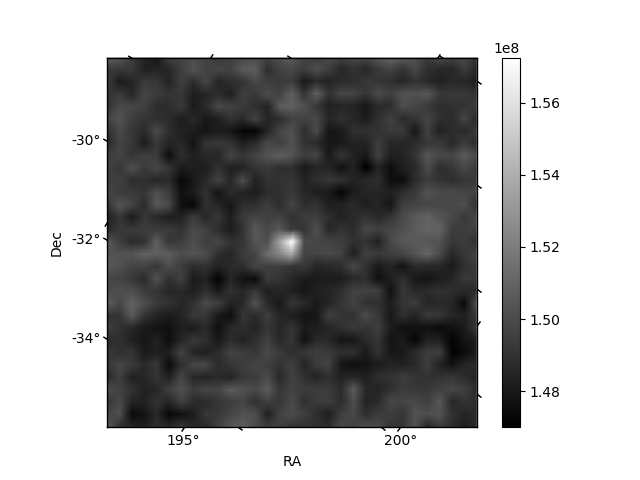
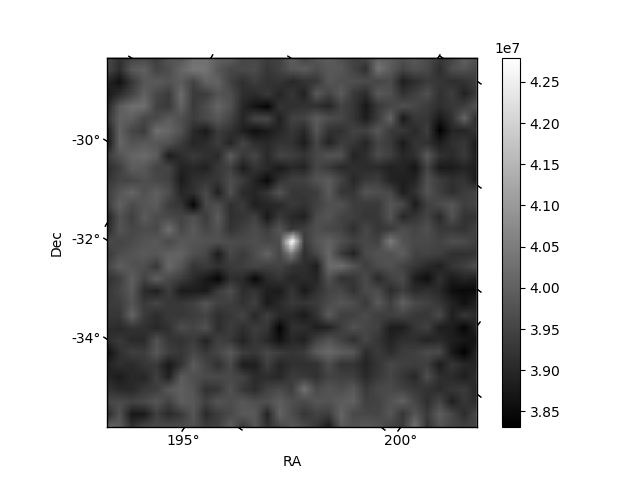
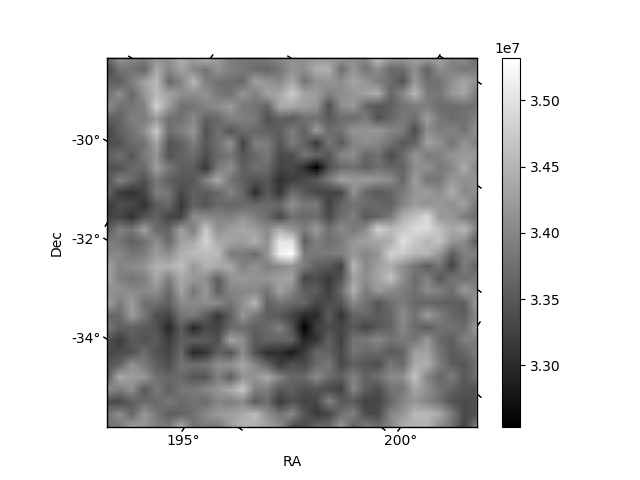
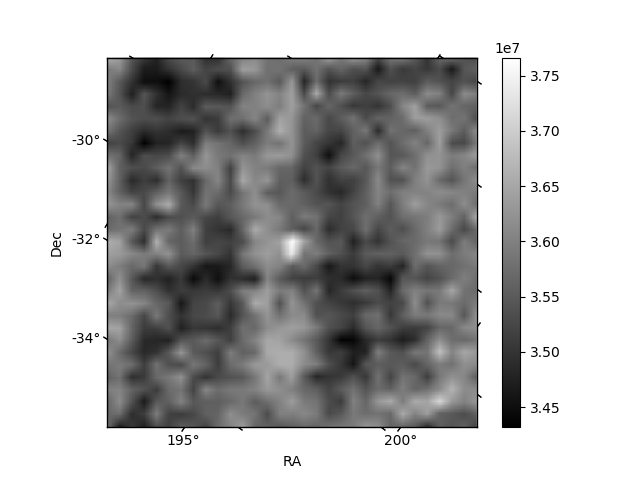
Histogram calculated using DETX and DETY for each event in the final _common_clean file
| Quadrant A | 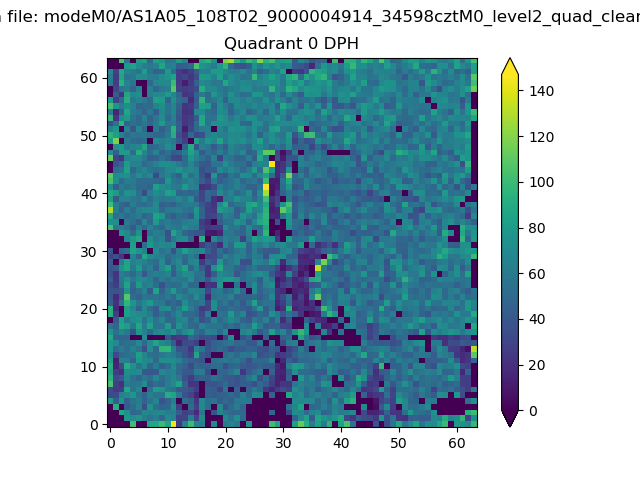 |
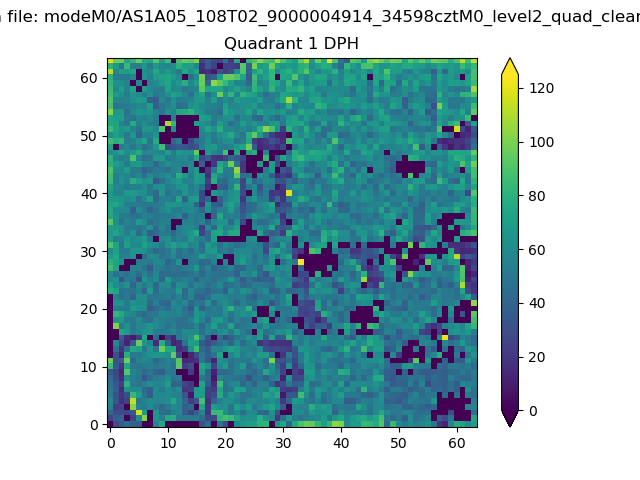 |
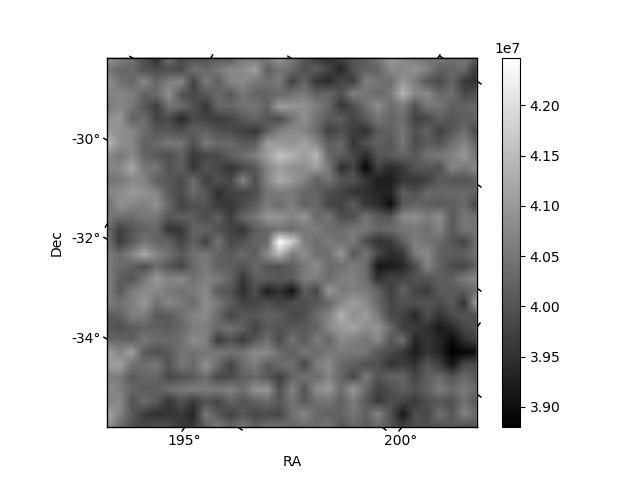
Quadrant B |
|---|---|---|---|
| Quadrant D | 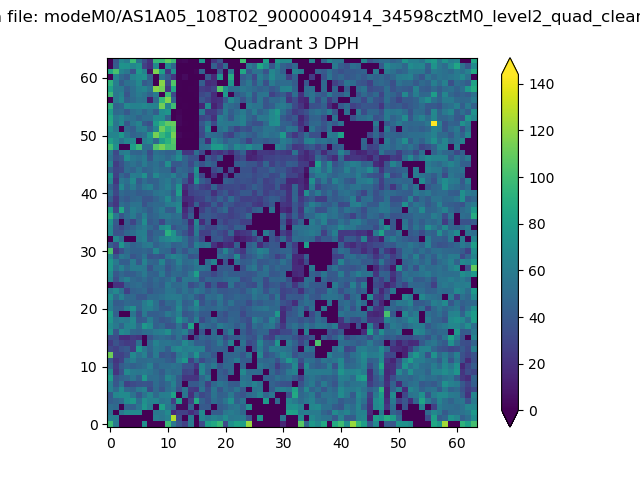 |
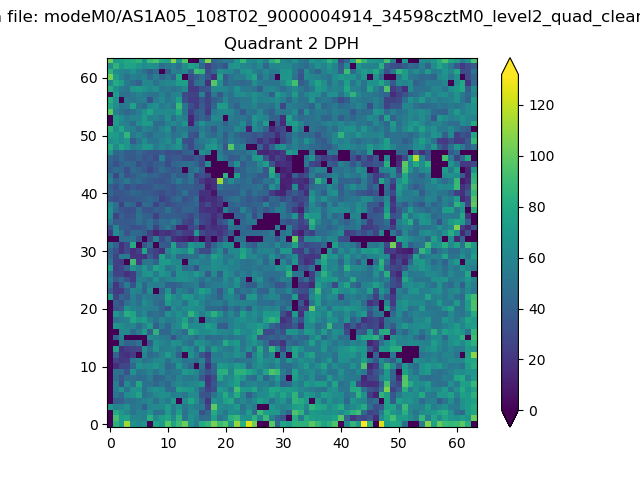 |
Quadrant C |
| Plot type | Count rate plots | Images |
|---|---|---|
| Comparison with Poisson distribution Blue bars denote a histogram of data divided into 1 sec bins. Red curve is a Poisson curve with rate = median count rate of data. |
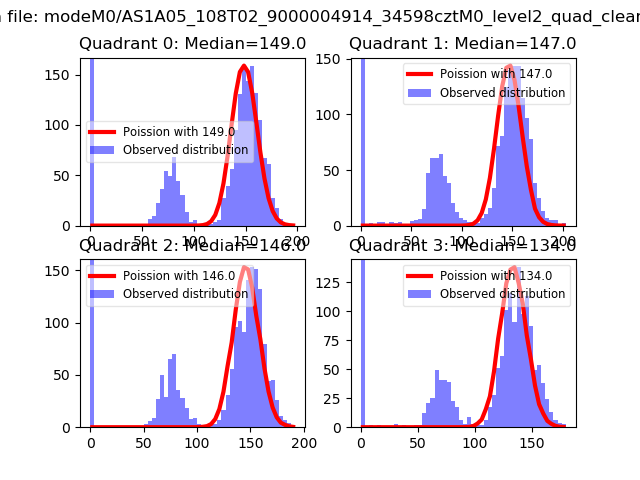 |
 |
| Quadrant-wise count rates Data is divided into 100 sec bins |
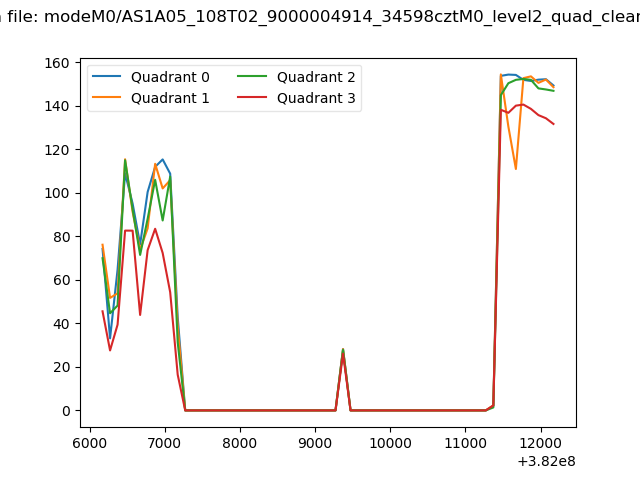 |
|
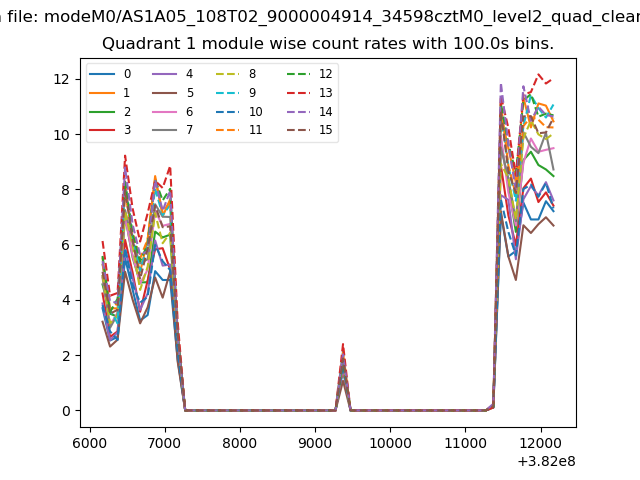
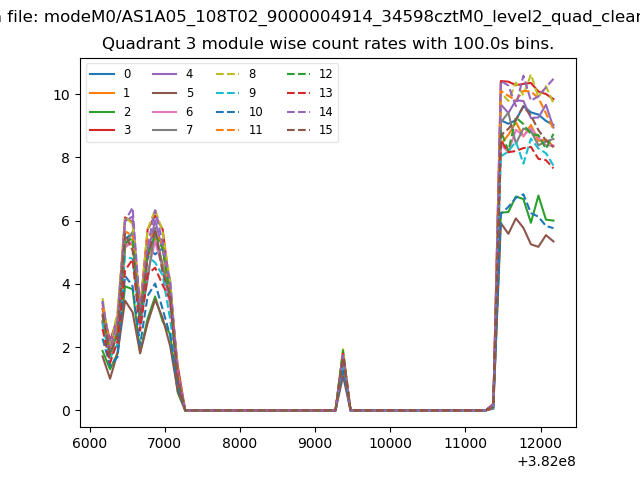
| Module-wise count rates for Quadrant A Data is divided into 100 sec bins |
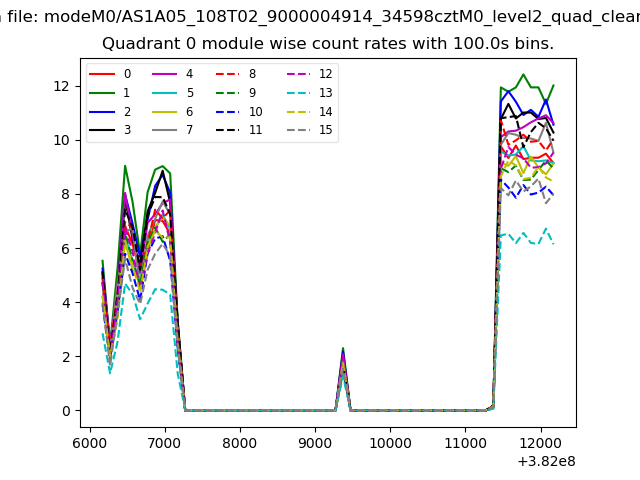 |
 |
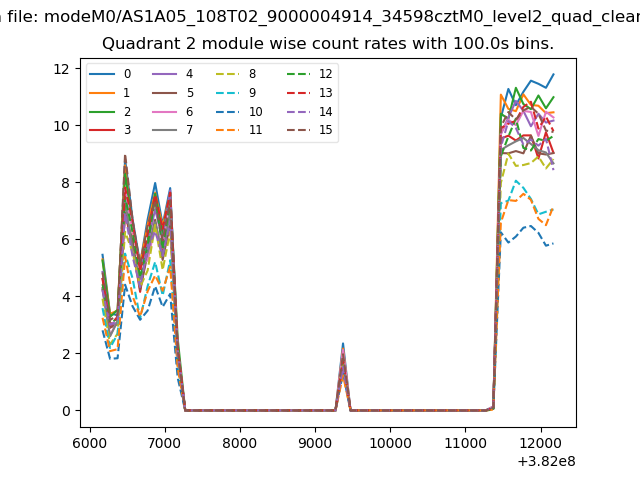
| Module-wise count rates for Quadrant B Data is divided into 100 sec bins |
 |
 |
| Module-wise count rates for Quadrant C Data is divided into 100 sec bins |
 |
 |
| Module-wise count rates for Quadrant D Data is divided into 100 sec bins |
 |
 |
| Parameter | Plot |
|---|---|
| CZT HV Monitor | 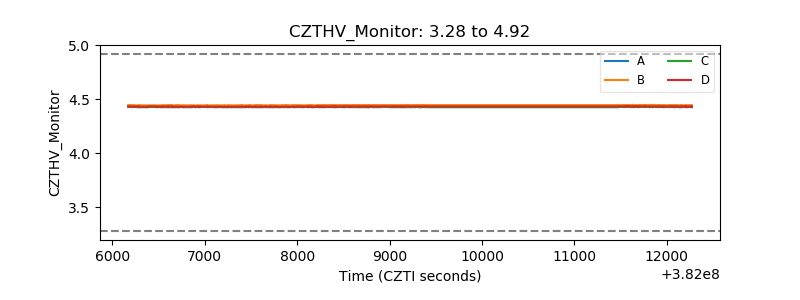 |
| D_VDD | 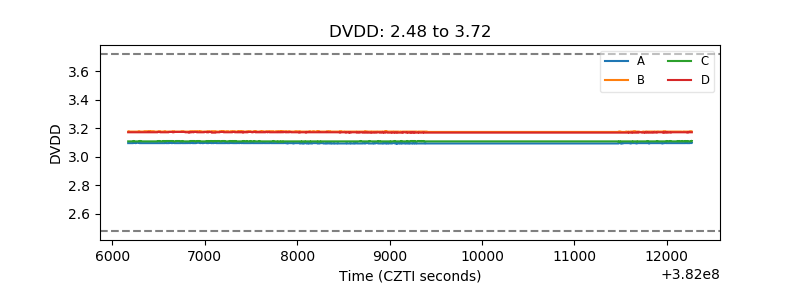 |
| Temperature 1 | 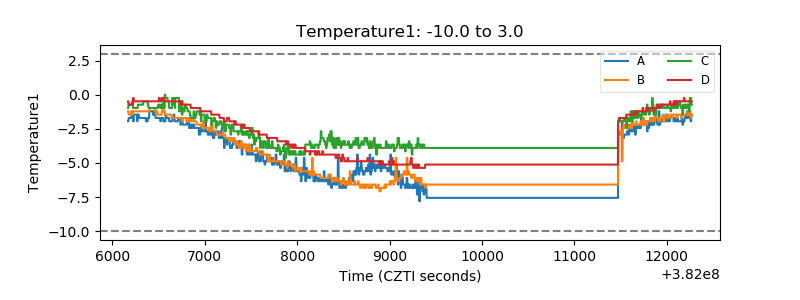 |
| Veto HV Monitor |  |
| Veto LLD | 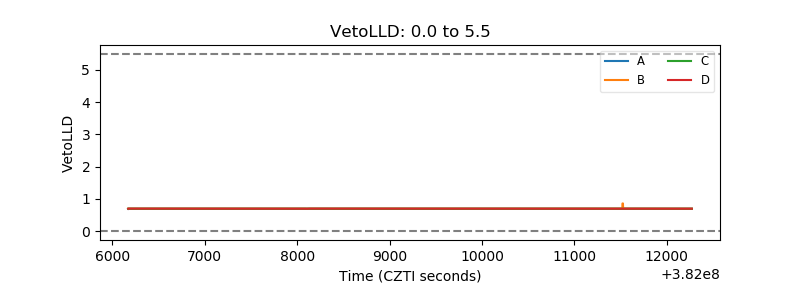 |
| Alpha Counter | 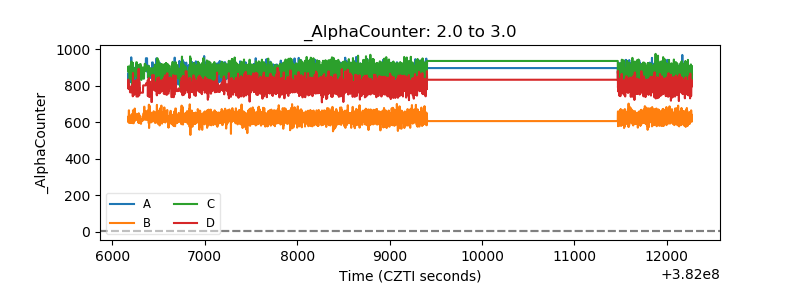 |
| _CPM_Rate | 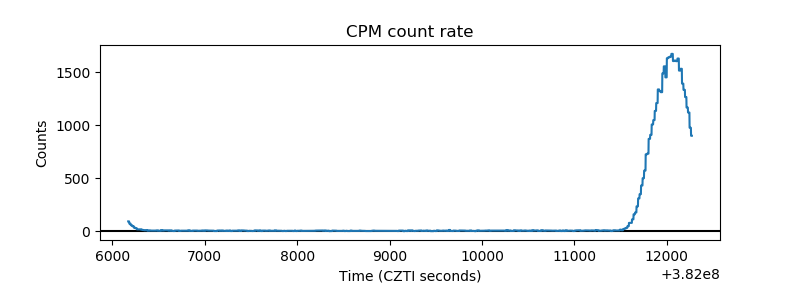 |
| CZT Counter | 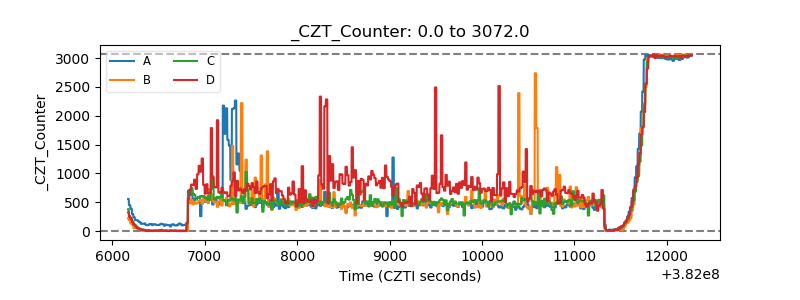 |
| +2.5 Volts monitor | 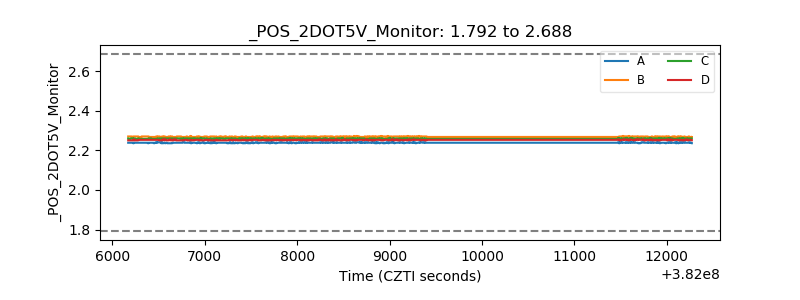 |
| +5 Volts monitor | 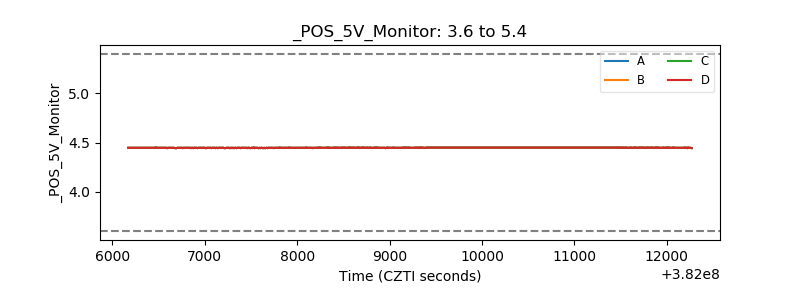 |
| _ROLL_ROT | 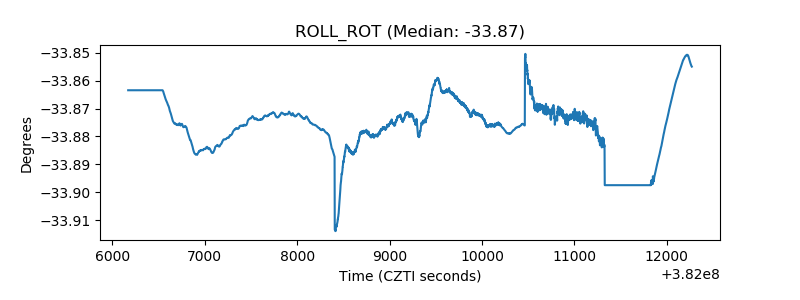 |
| _Roll_DEC | 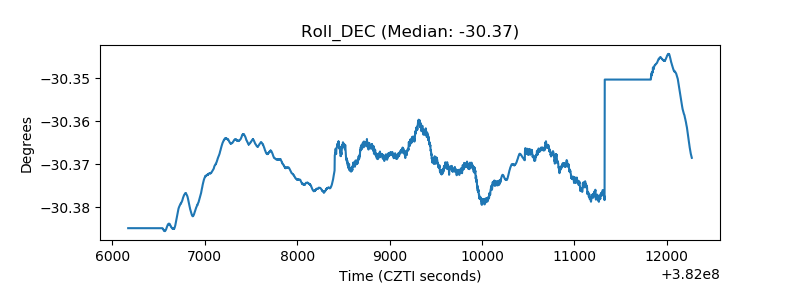 |
| _Roll_RA | 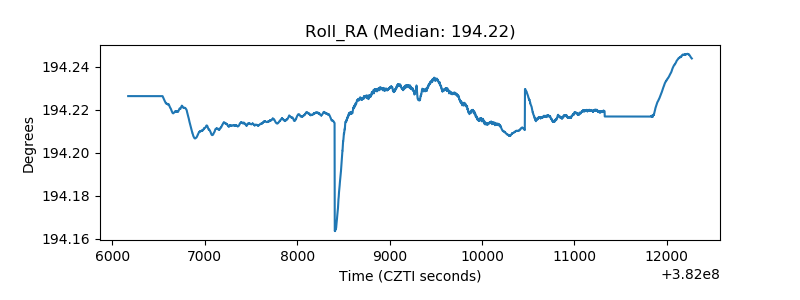 |
| Veto Counter | 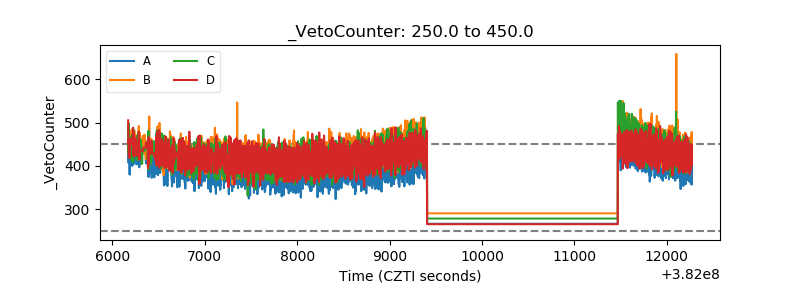 |