| Param | Original file | Final file |
|---|---|---|
| Filename | modeM0/AS1A05_108T02_9000004914_34425cztM0_level2.evt | modeM0/AS1A05_108T02_9000004914_34425cztM0_level2_quad_clean.evt |
| Size (bytes) | 166,380,480 | 37,615,680 |
| Size | 158.7 MB | 35.9 MB |
| Events in quadrant A | 933,060 | 255,352 |
| Events in quadrant B | 1,094,044 | 258,116 |
| Events in quadrant C | 1,076,886 | 250,567 |
| Events in quadrant D | 1,798,059 | 230,624 |
| Mode SS | |||
|---|---|---|---|
| Quadrant | BADHDUFLAG | Total packets | Discarded packets |
| A | 0 | 42 | 0 |
| B | 0 | 42 | 0 |
| C | 0 | 42 | 0 |
| D | 0 | 42 | 0 |
| Mode M9 | |||
|---|---|---|---|
| Quadrant | BADHDUFLAG | Total packets | Discarded packets |
| A | 0 | 21 | 0 |
| B | 0 | 21 | 0 |
| C | 0 | 21 | 0 |
| D | 0 | 21 | 0 |
| Mode M0 | |||
|---|---|---|---|
| Quadrant | BADHDUFLAG | Total packets | Discarded packets |
| A | 0 | 4095 | 1 |
| B | 0 | 4547 | 1 |
| C | 0 | 4395 | 1 |
| D | 0 | 6739 | 1 |
| Quadrant | Total seconds | Saturated seconds | Saturation percentage |
|---|---|---|---|
| A | 1980 | 1 | 0.050505% |
| B | 1980 | 47 | 2.373737% |
| C | 1980 | 32 | 1.616162% |
| D | 1980 | 82 | 4.141414% |
Noise dominated data is calculated using 1-second bins in cleaned event files. If a bin has >2000 counts, and if more than 50% of those come from <1% of pixels, then it is considered to be noise-dominated and hence unusable.
| Quadrant | # 1 sec bins | Bins with >0 counts | Bins with >2000 counts | High rate bins dominated by noise | Noise dominated (total time) | Noise dominated (detector-on time) | Marked lightcurve |
|---|---|---|---|---|---|---|---|
| A | 4073 | 1981 | 0 | 0 | 0.00% | 0.00% | 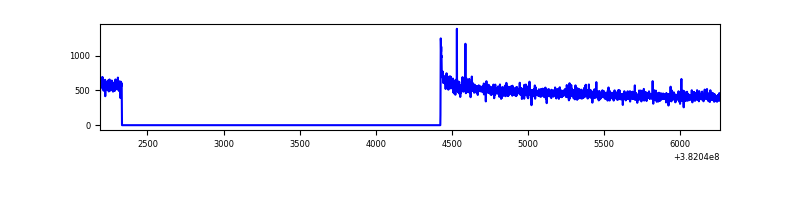 |
| B | 4073 | 1981 | 29 | 29 | 0.71% | 1.46% | 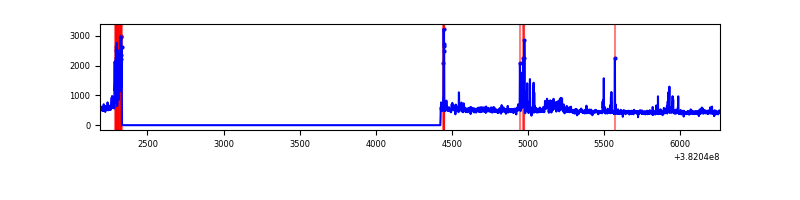 |
| C | 4073 | 1981 | 21 | 21 | 0.52% | 1.06% | 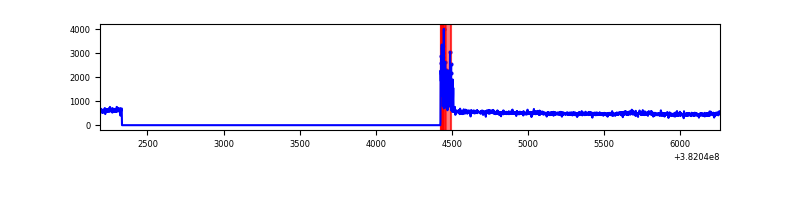 |
| D | 4073 | 1981 | 99 | 99 | 2.43% | 5.00% | 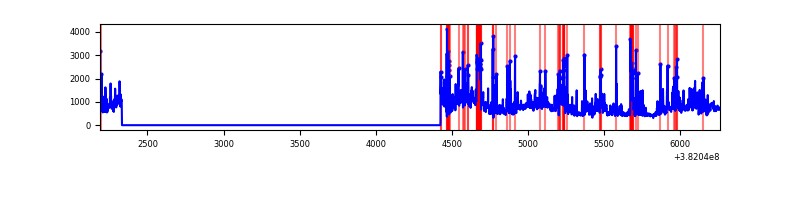 |
Top three noisy pixels from each quadrant. If the there are fewer than three noisy pixels in the level2.evt file, extra rows are filled as -1
| Pixel properties | Quadrant properties | ||||||
|---|---|---|---|---|---|---|---|
| Quadrant | DetID | PixID | Counts | Sigma | Mean | Median | Sigma |
| A | 10 | 83 | 17079 | 349.25 | 233 | 229 | 48.2 |
| A | 13 | 6 | 5746 | 114.35 | 233 | 229 | 48.2 |
| A | 13 | 254 | 3583 | 69.52 | 233 | 229 | 48.2 |
| B | 5 | 172 | 79163 | 1720.17 | 232 | 227 | 45.9 |
| B | 0 | 229 | 37067 | 802.81 | 232 | 227 | 45.9 |
| B | 0 | 190 | 35269 | 763.63 | 232 | 227 | 45.9 |
| C | 0 | 10 | 94468 | 1761.54 | 223 | 225 | 53.5 |
| C | 15 | 214 | 85250 | 1589.24 | 223 | 225 | 53.5 |
| C | 14 | 67 | 21353 | 394.91 | 223 | 225 | 53.5 |
| D | 8 | 195 | 315418 | 5786.5 | 217 | 212 | 54.5 |
| D | 7 | 80 | 244304 | 4481.0 | 217 | 212 | 54.5 |
| D | 2 | 249 | 84062 | 1539.3 | 217 | 212 | 54.5 |
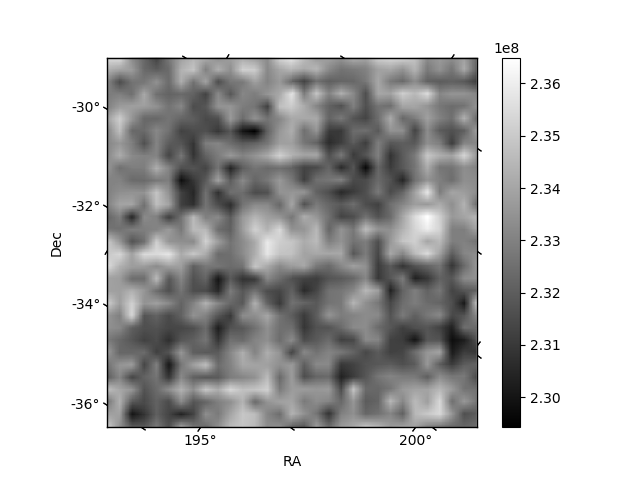
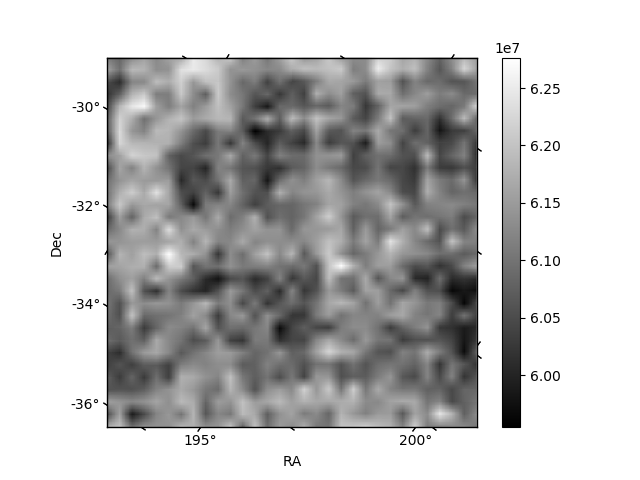
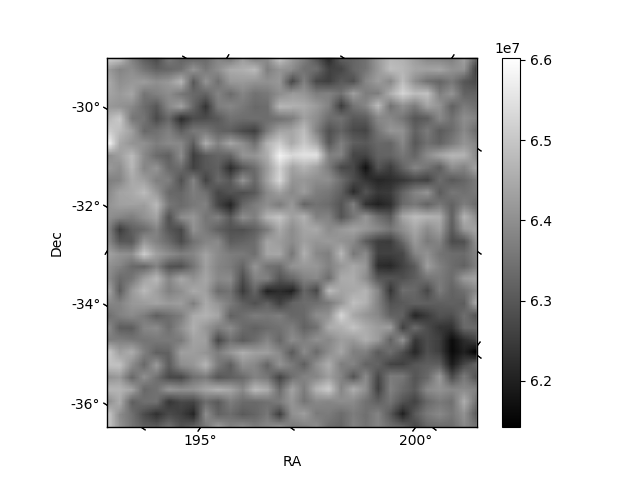
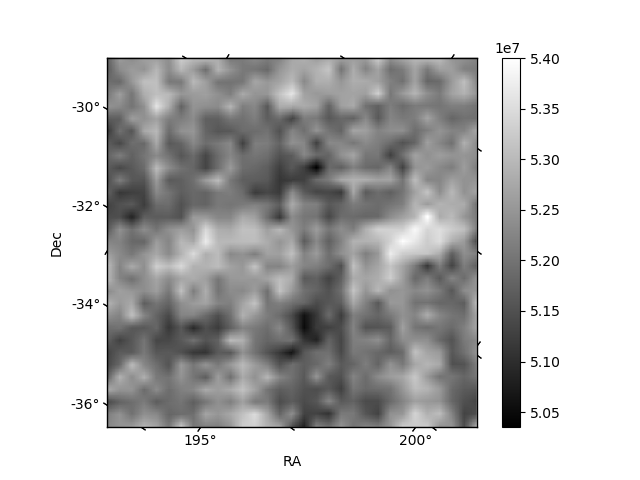
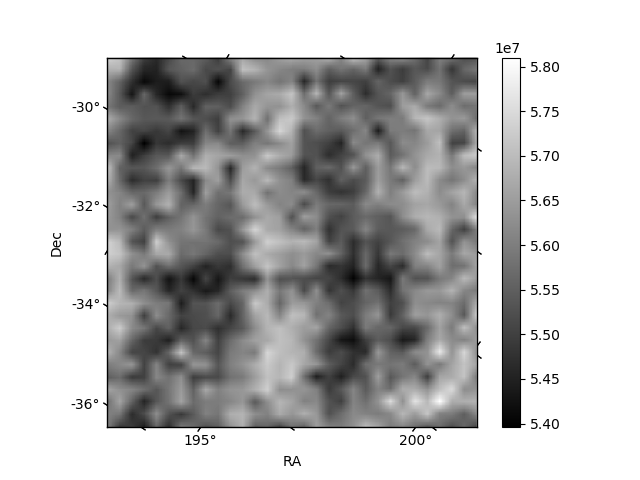
Histogram calculated using DETX and DETY for each event in the final _common_clean file
| Quadrant A | 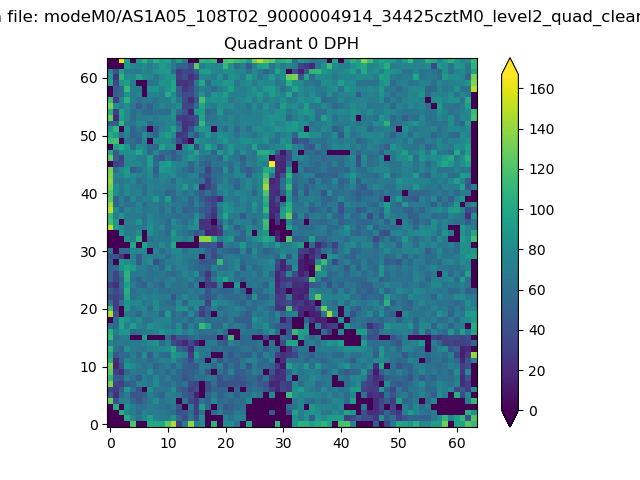 |
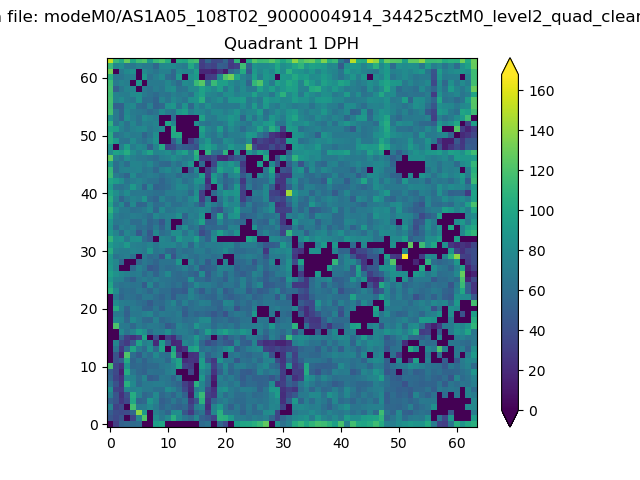 |
Quadrant B |
|---|---|---|---|
| Quadrant D | 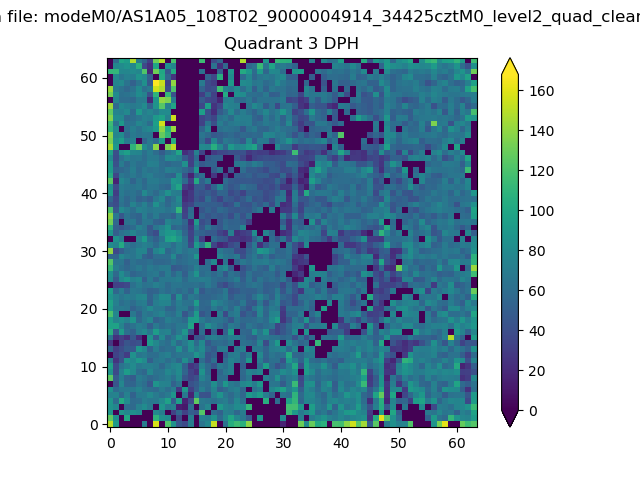 |
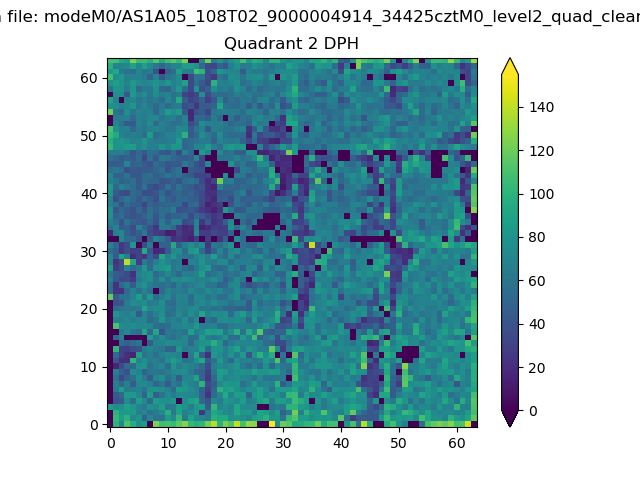 |
Quadrant C |
| Plot type | Count rate plots | Images |
|---|---|---|
| Comparison with Poisson distribution Blue bars denote a histogram of data divided into 1 sec bins. Red curve is a Poisson curve with rate = median count rate of data. |
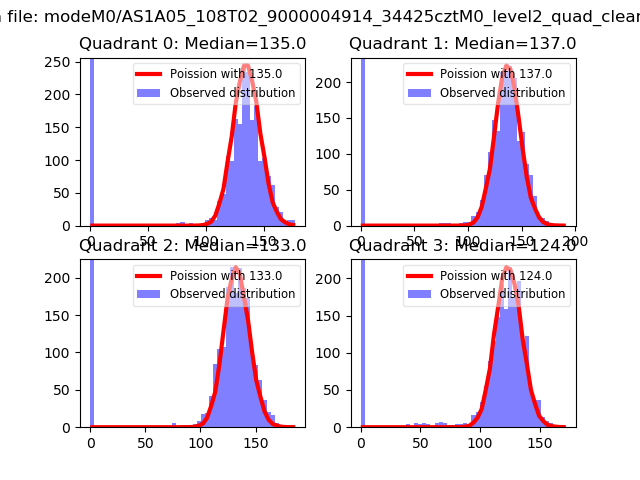 |
 |
| Quadrant-wise count rates Data is divided into 100 sec bins |
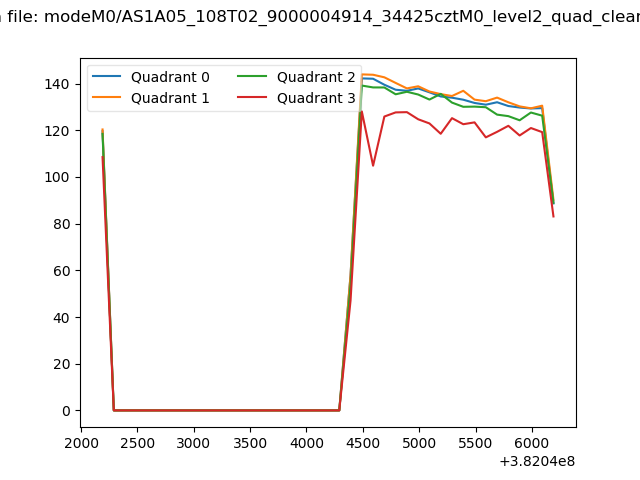 |
|
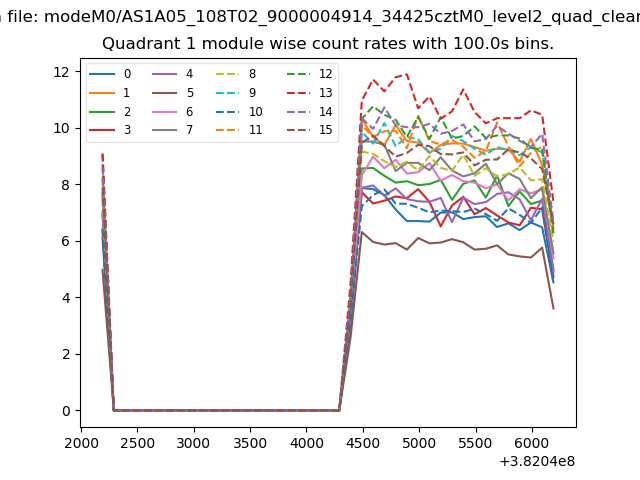
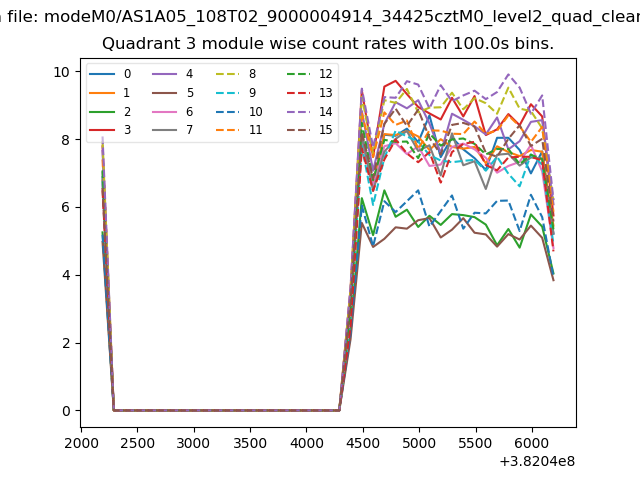
| Module-wise count rates for Quadrant A Data is divided into 100 sec bins |
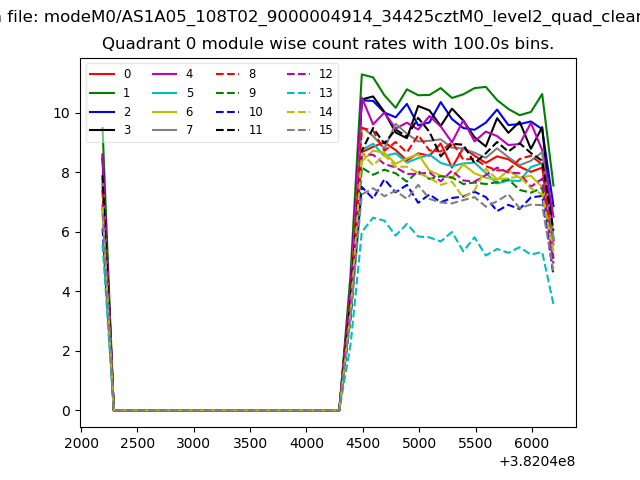 |
 |
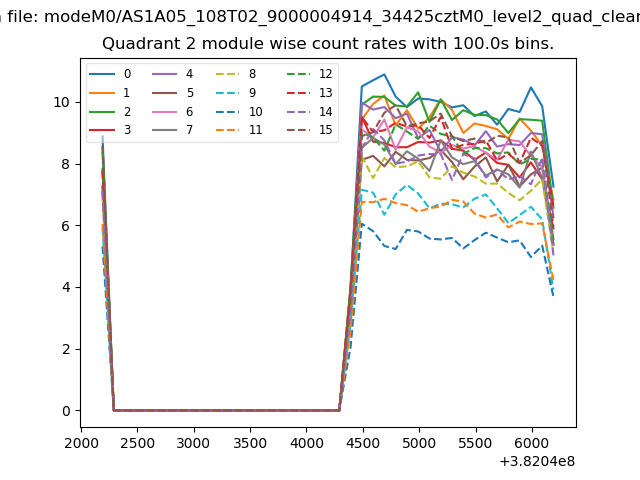
| Module-wise count rates for Quadrant B Data is divided into 100 sec bins |
 |
 |
| Module-wise count rates for Quadrant C Data is divided into 100 sec bins |
 |
 |
| Module-wise count rates for Quadrant D Data is divided into 100 sec bins |
 |
 |
| Parameter | Plot |
|---|---|
| CZT HV Monitor | 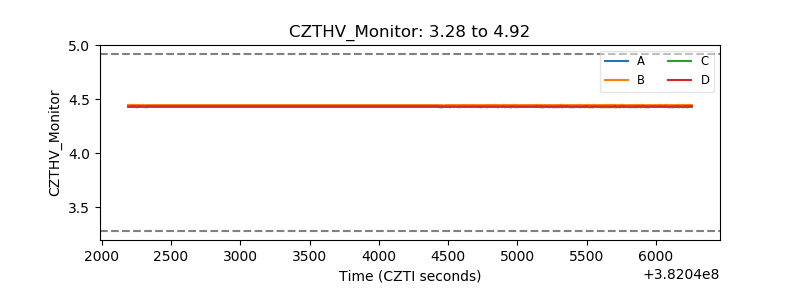 |
| D_VDD | 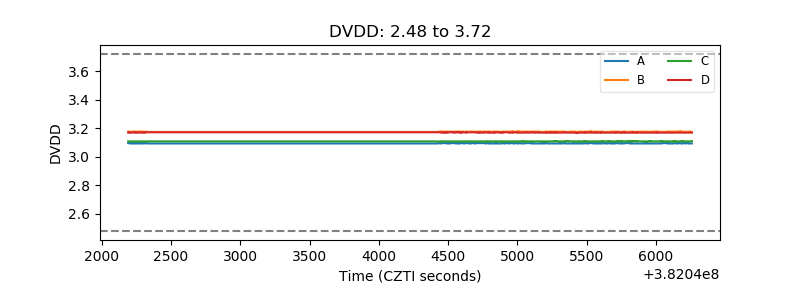 |
| Temperature 1 | 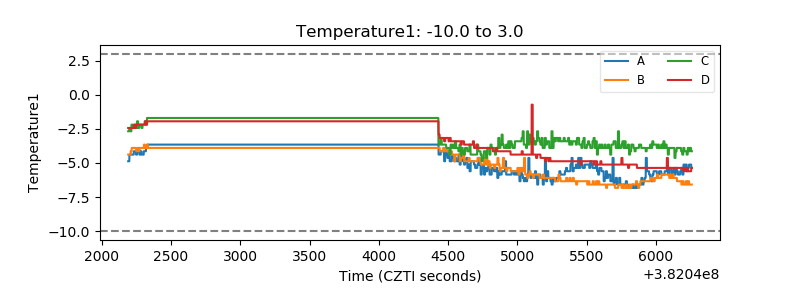 |
| Veto HV Monitor |  |
| Veto LLD | 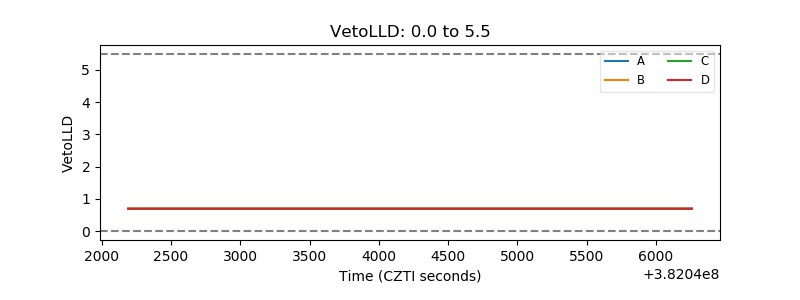 |
| Alpha Counter |  |
| _CPM_Rate | 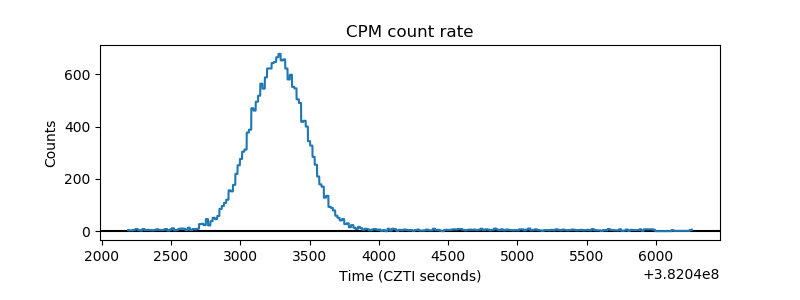 |
| CZT Counter | 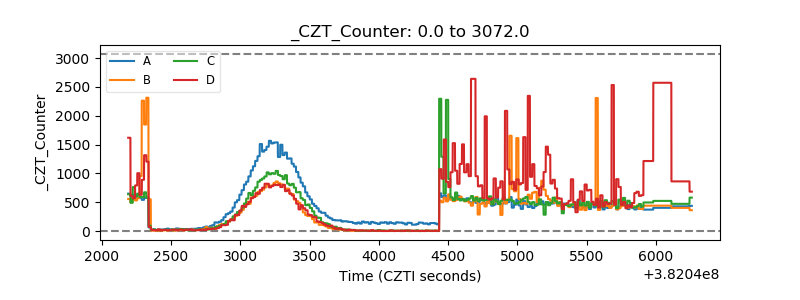 |
| +2.5 Volts monitor | 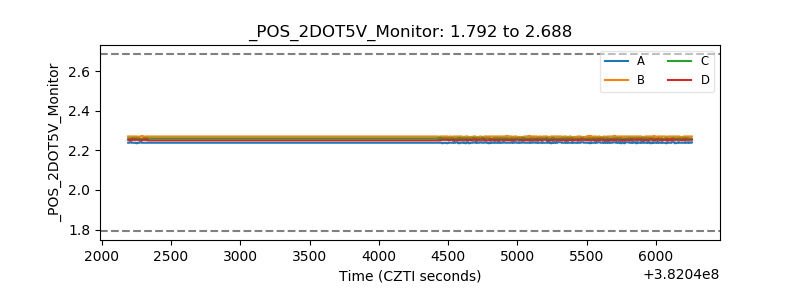 |
| +5 Volts monitor | 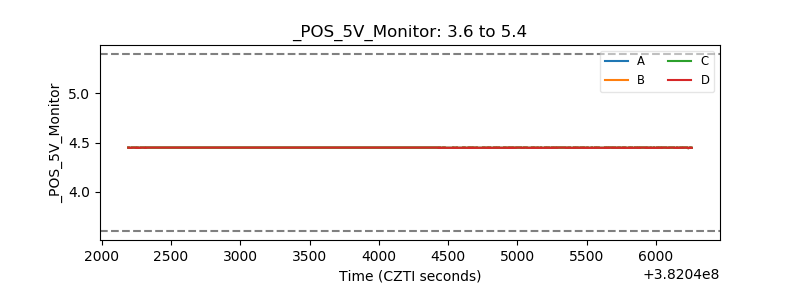 |
| _ROLL_ROT | 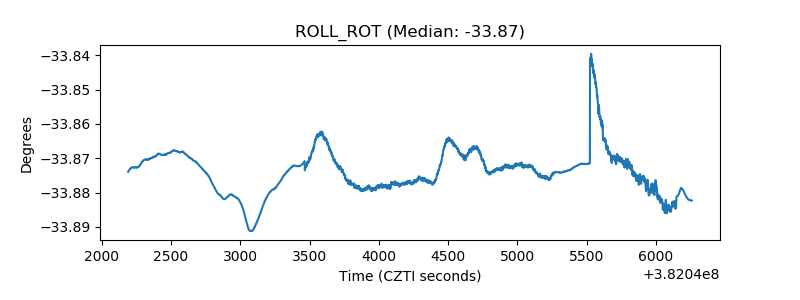 |
| _Roll_DEC | 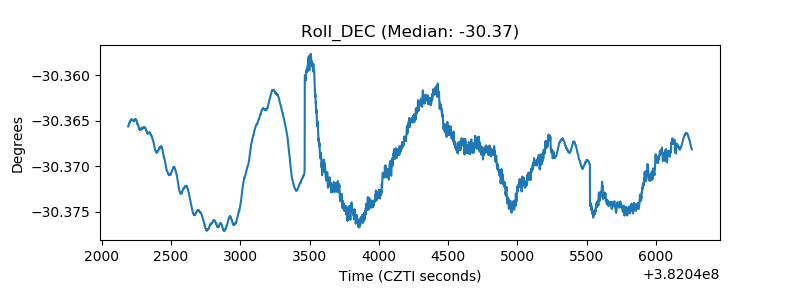 |
| _Roll_RA | 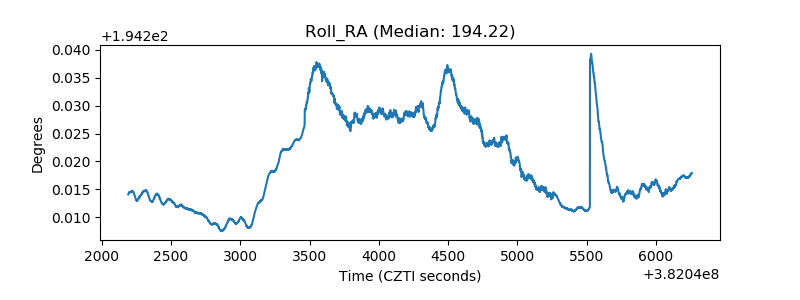 |
| Veto Counter | 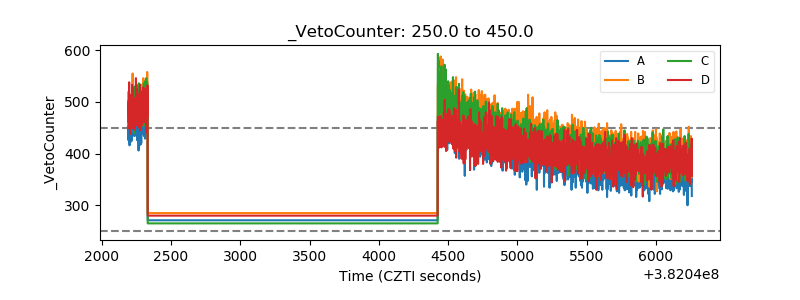 |