| Param | Original file | Final file |
|---|---|---|
| Filename | modeM0/AS1A05_108T02_9000004914_34423cztM0_level2.evt | modeM0/AS1A05_108T02_9000004914_34423cztM0_level2_quad_clean.evt |
| Size (bytes) | 459,547,200 | 79,476,480 |
| Size | 438.3 MB | 75.8 MB |
| Events in quadrant A | 2,555,256 | 535,358 |
| Events in quadrant B | 3,085,784 | 543,883 |
| Events in quadrant C | 2,862,865 | 519,057 |
| Events in quadrant D | 5,082,032 | 465,256 |
| Mode SS | |||
|---|---|---|---|
| Quadrant | BADHDUFLAG | Total packets | Discarded packets |
| A | 0 | 100 | 0 |
| B | 0 | 100 | 0 |
| C | 0 | 100 | 0 |
| D | 0 | 100 | 0 |
| Mode M9 | |||
|---|---|---|---|
| Quadrant | BADHDUFLAG | Total packets | Discarded packets |
| A | 0 | 34 | 0 |
| B | 0 | 34 | 0 |
| C | 0 | 34 | 0 |
| D | 0 | 35 | 0 |
| Mode M0 | |||
|---|---|---|---|
| Quadrant | BADHDUFLAG | Total packets | Discarded packets |
| A | 0 | 10542 | 3 |
| B | 0 | 12149 | 2 |
| C | 0 | 11471 | 2 |
| D | 0 | 18474 | 2 |
| Quadrant | Total seconds | Saturated seconds | Saturation percentage |
|---|---|---|---|
| A | 4888 | 9 | 0.184124% |
| B | 4888 | 112 | 2.291326% |
| C | 4888 | 50 | 1.022913% |
| D | 4888 | 603 | 12.336334% |
Noise dominated data is calculated using 1-second bins in cleaned event files. If a bin has >2000 counts, and if more than 50% of those come from <1% of pixels, then it is considered to be noise-dominated and hence unusable.
| Quadrant | # 1 sec bins | Bins with >0 counts | Bins with >2000 counts | High rate bins dominated by noise | Noise dominated (total time) | Noise dominated (detector-on time) | Marked lightcurve |
|---|---|---|---|---|---|---|---|
| A | 7011 | 4889 | 0 | 0 | 0.00% | 0.00% | 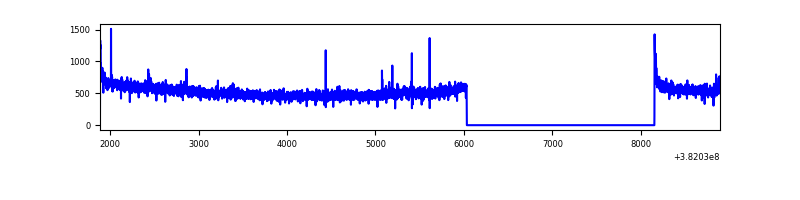 |
| B | 7011 | 4889 | 64 | 64 | 0.91% | 1.31% | 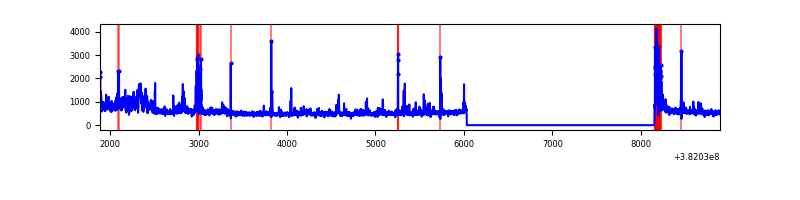 |
| C | 7011 | 4889 | 36 | 36 | 0.51% | 0.74% | 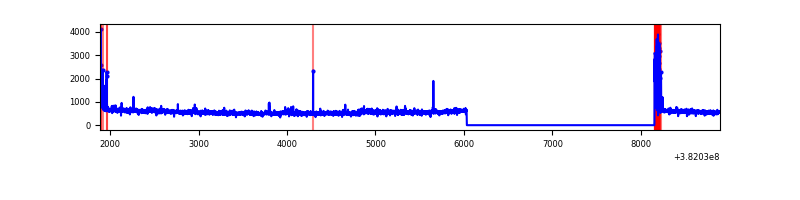 |
| D | 7011 | 4889 | 535 | 535 | 7.63% | 10.94% | 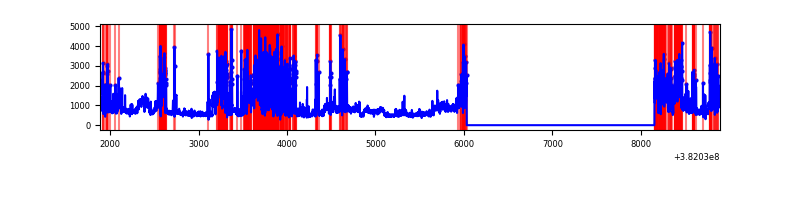 |
Top three noisy pixels from each quadrant. If the there are fewer than three noisy pixels in the level2.evt file, extra rows are filled as -1
| Pixel properties | Quadrant properties | ||||||
|---|---|---|---|---|---|---|---|
| Quadrant | DetID | PixID | Counts | Sigma | Mean | Median | Sigma |
| A | 10 | 83 | 36244 | 278.29 | 645 | 636 | 128.0 |
| A | 13 | 6 | 11439 | 84.43 | 645 | 636 | 128.0 |
| A | 9 | 143 | 10710 | 78.73 | 645 | 636 | 128.0 |
| B | 5 | 172 | 213181 | 1776.23 | 637 | 623 | 119.7 |
| B | 0 | 190 | 199052 | 1658.16 | 637 | 623 | 119.7 |
| B | 0 | 229 | 65071 | 538.56 | 637 | 623 | 119.7 |
| C | 15 | 214 | 206852 | 1466.35 | 614 | 620 | 140.6 |
| C | 0 | 10 | 151241 | 1070.95 | 614 | 620 | 140.6 |
| C | 14 | 67 | 74891 | 528.08 | 614 | 620 | 140.6 |
| D | 10 | 230 | 960328 | 6627.82 | 589 | 576 | 144.8 |
| D | 8 | 195 | 766770 | 5291.15 | 589 | 576 | 144.8 |
| D | 7 | 80 | 331320 | 2284.04 | 589 | 576 | 144.8 |
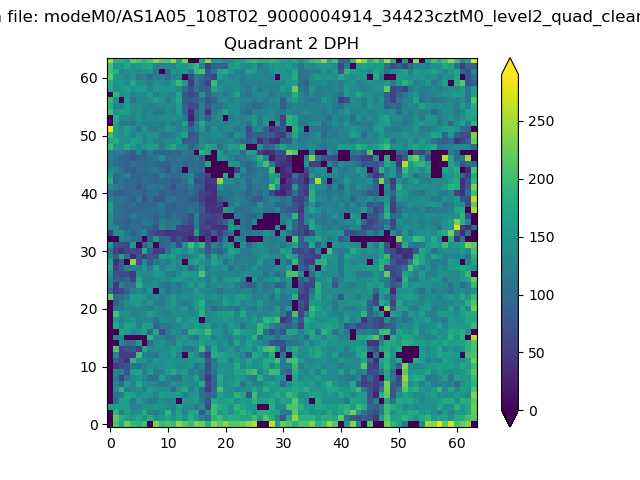
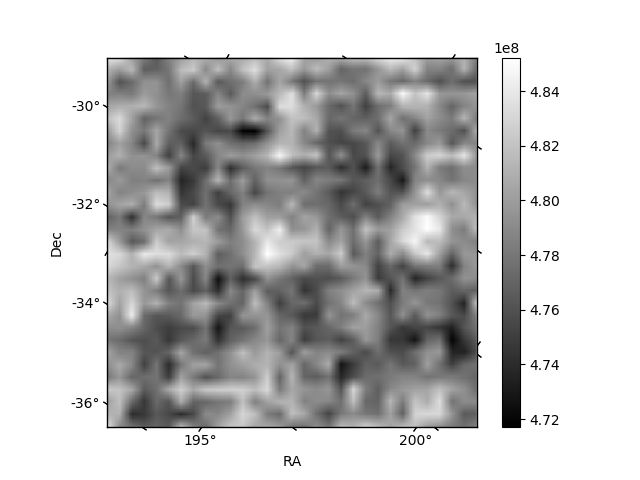
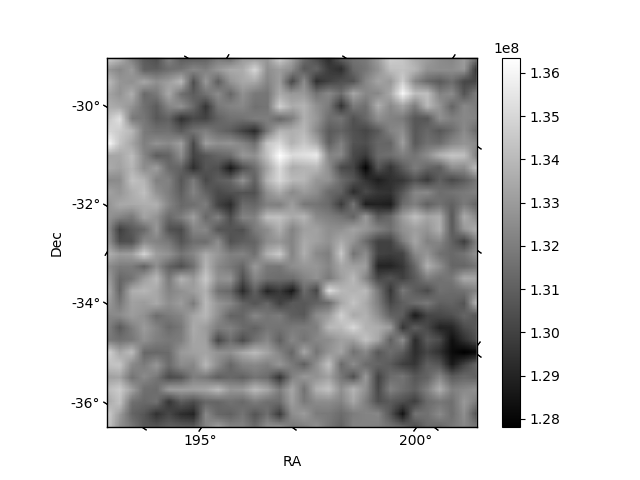
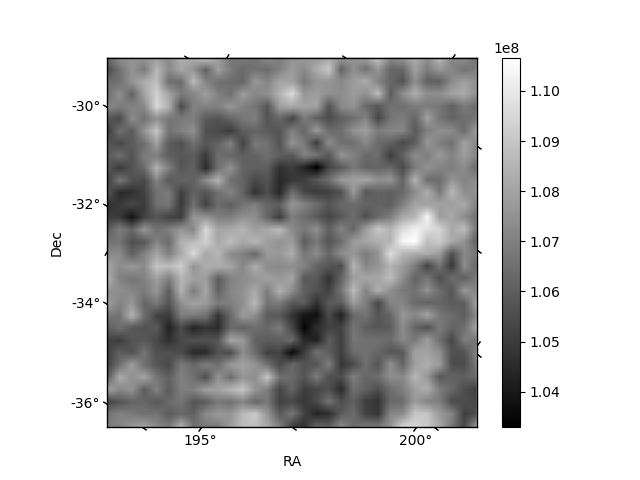
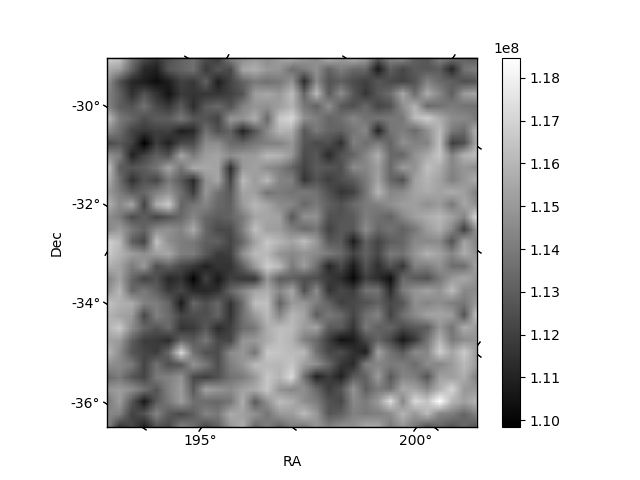
Histogram calculated using DETX and DETY for each event in the final _common_clean file
| Quadrant A | 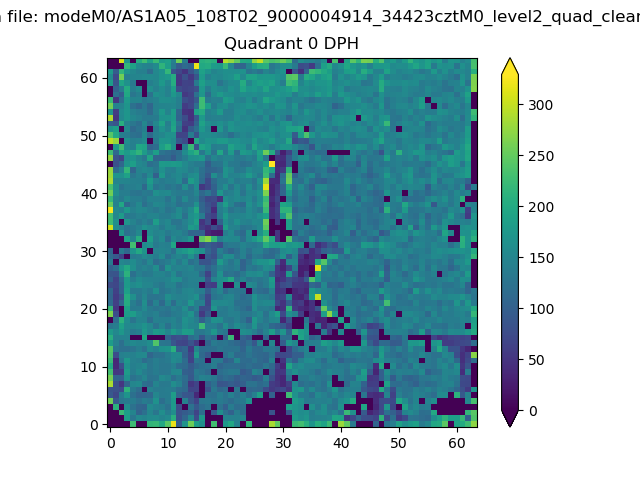 |
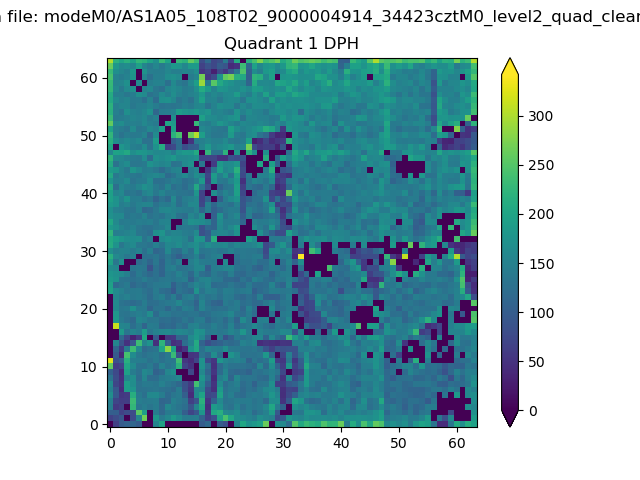 |
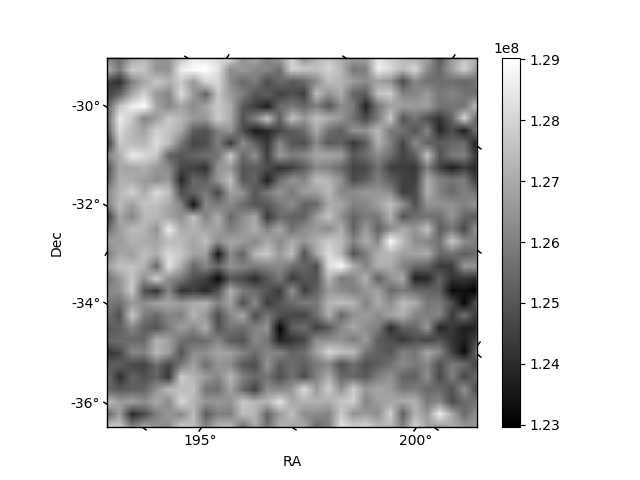
Quadrant B |
|---|---|---|---|
| Quadrant D | 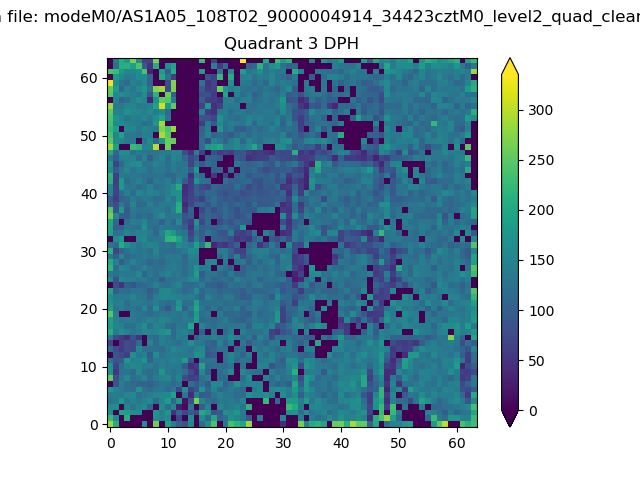 |
 |
Quadrant C |
| Plot type | Count rate plots | Images |
|---|---|---|
| Comparison with Poisson distribution Blue bars denote a histogram of data divided into 1 sec bins. Red curve is a Poisson curve with rate = median count rate of data. |
 |
 |
| Quadrant-wise count rates Data is divided into 100 sec bins |
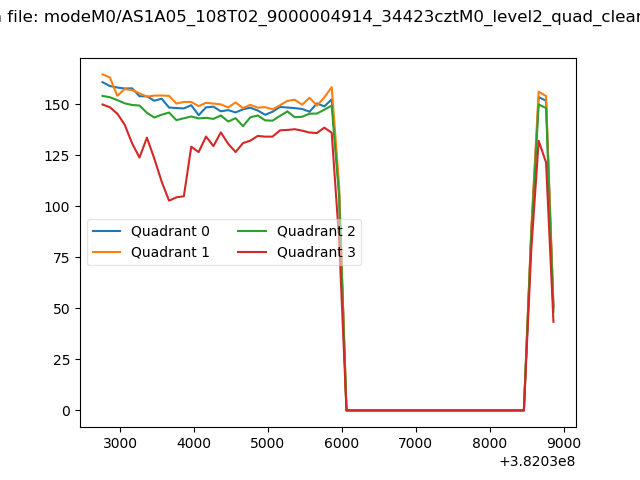 |
|
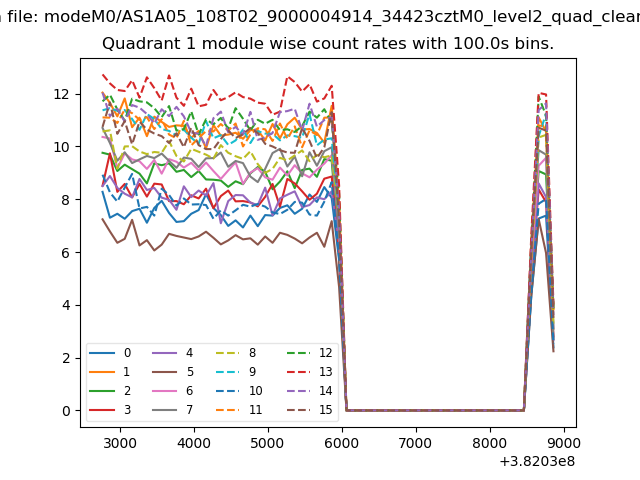
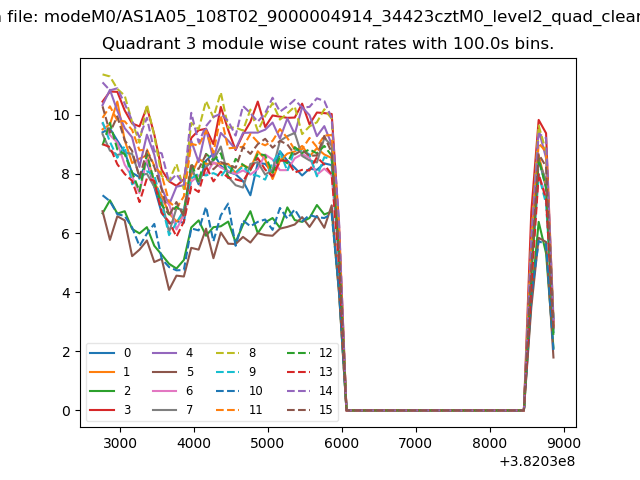
| Module-wise count rates for Quadrant A Data is divided into 100 sec bins |
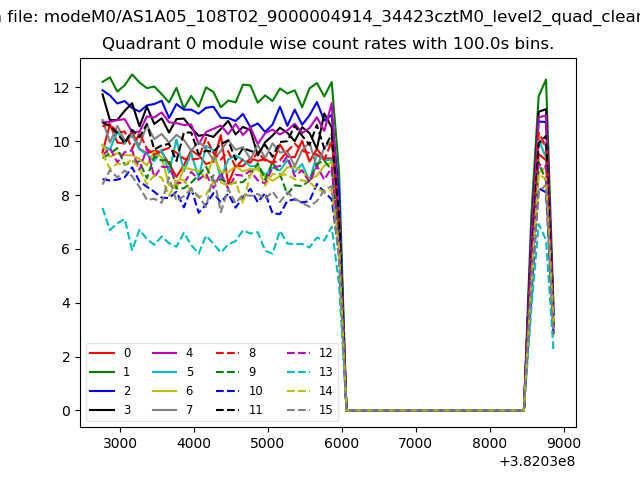 |
 |
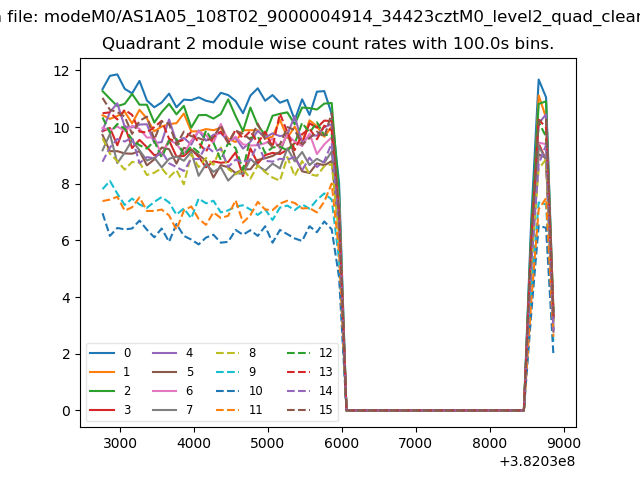
| Module-wise count rates for Quadrant B Data is divided into 100 sec bins |
 |
 |
| Module-wise count rates for Quadrant C Data is divided into 100 sec bins |
 |
 |
| Module-wise count rates for Quadrant D Data is divided into 100 sec bins |
 |
 |
| Parameter | Plot |
|---|---|
| CZT HV Monitor | 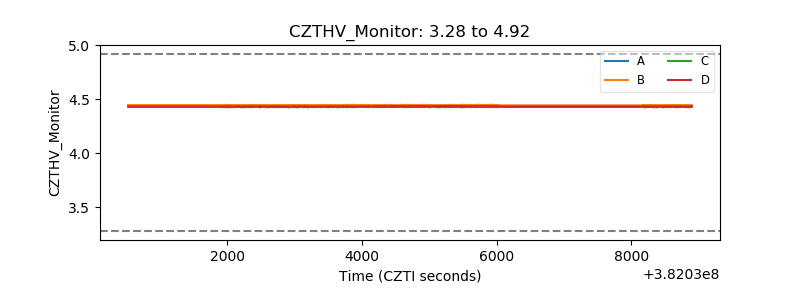 |
| D_VDD | 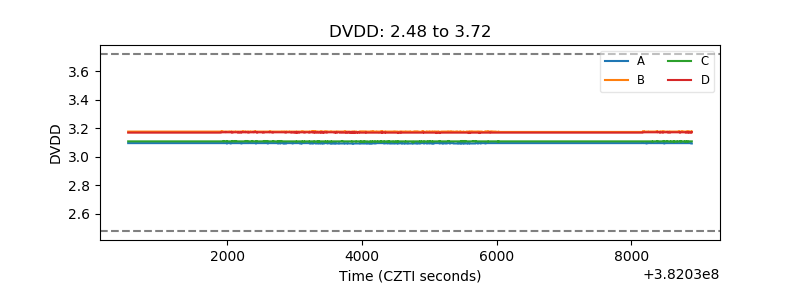 |
| Temperature 1 | 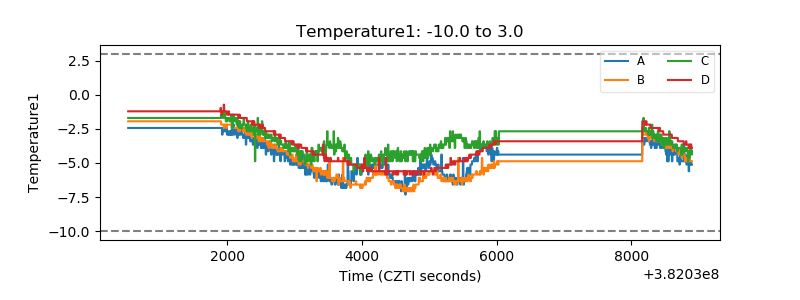 |
| Veto HV Monitor | 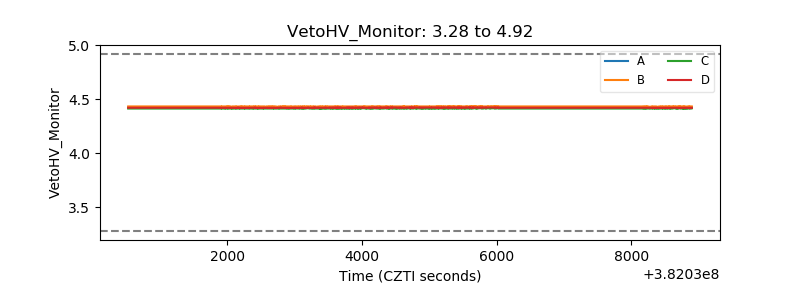 |
| Veto LLD | 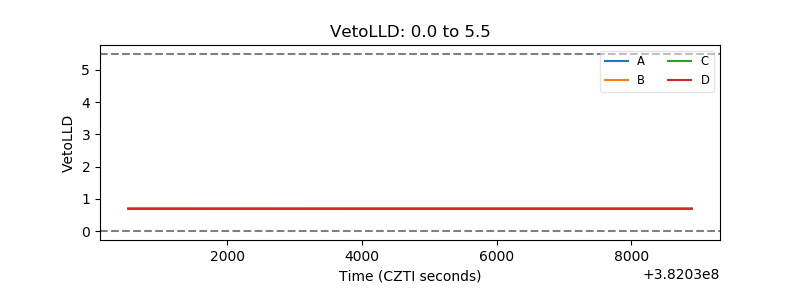 |
| Alpha Counter |  |
| _CPM_Rate | 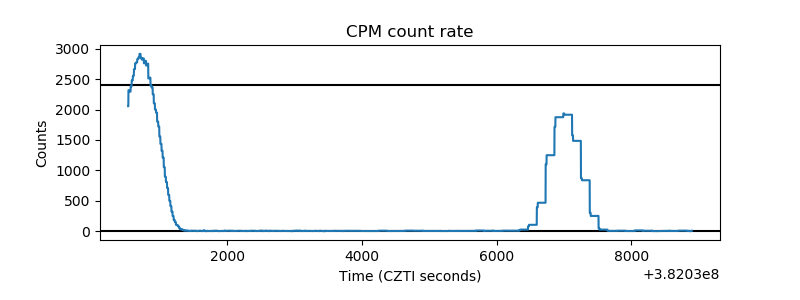 |
| CZT Counter | 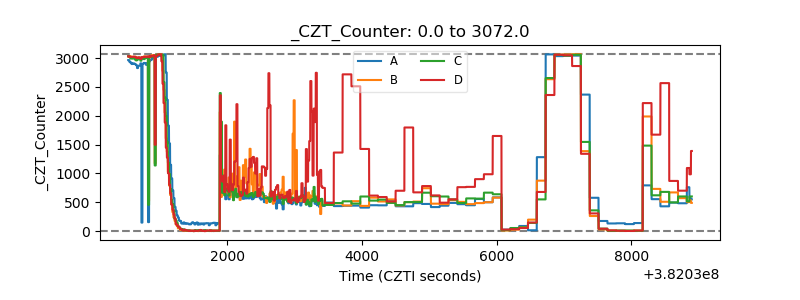 |
| +2.5 Volts monitor | 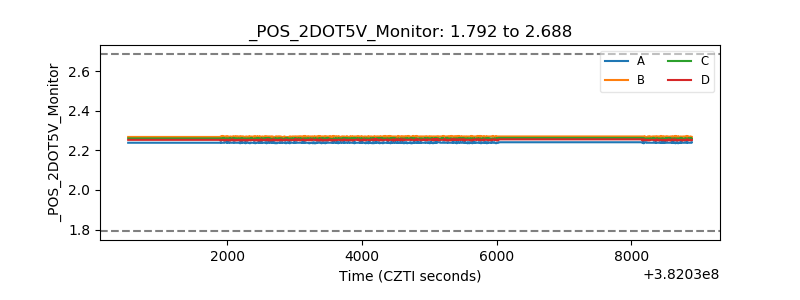 |
| +5 Volts monitor | 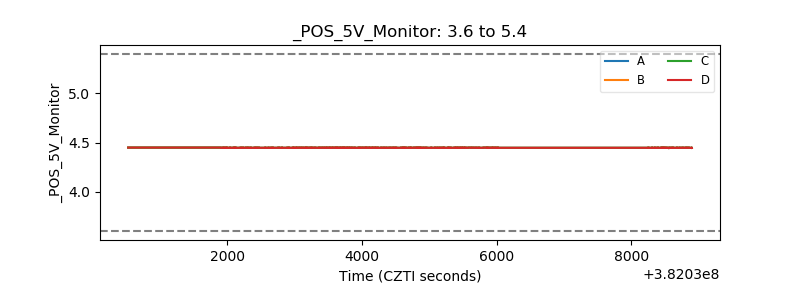 |
| _ROLL_ROT |  |
| _Roll_DEC | 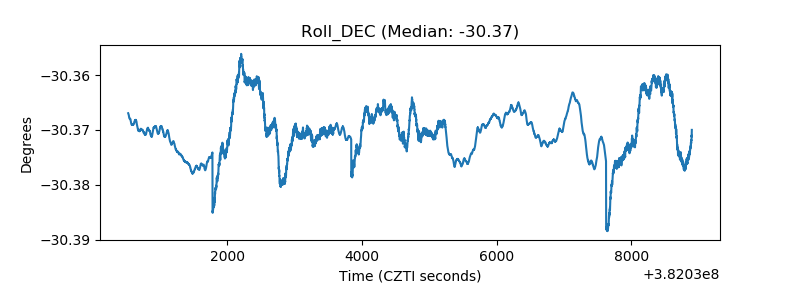 |
| _Roll_RA | 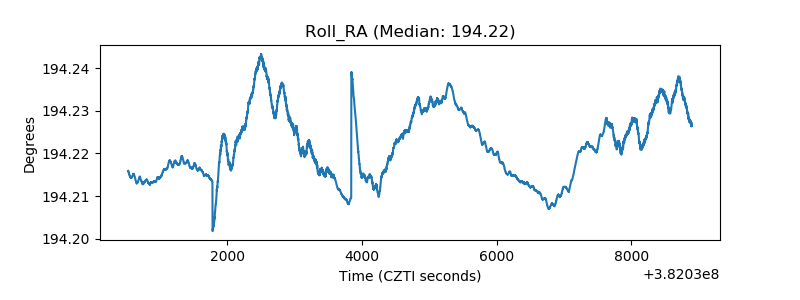 |
| Veto Counter | 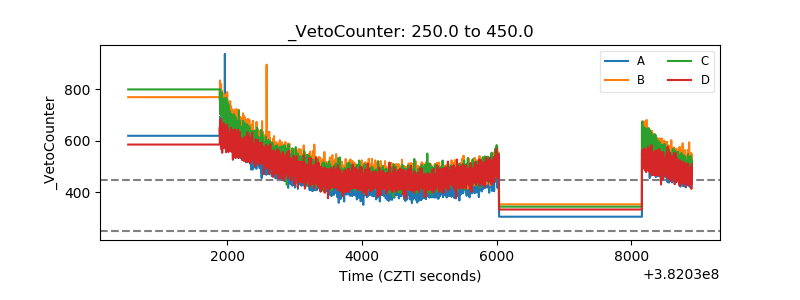 |