| Param | Original file | Final file |
|---|---|---|
| Filename | modeM0/AS1A05_108T02_9000004914_34421cztM0_level2.evt | modeM0/AS1A05_108T02_9000004914_34421cztM0_level2_quad_clean.evt |
| Size (bytes) | 527,322,240 | 58,976,640 |
| Size | 502.9 MB | 56.2 MB |
| Events in quadrant A | 2,898,938 | 366,290 |
| Events in quadrant B | 4,434,729 | 347,125 |
| Events in quadrant C | 3,182,400 | 357,715 |
| Events in quadrant D | 5,090,631 | 338,378 |
| Mode SS | |||
|---|---|---|---|
| Quadrant | BADHDUFLAG | Total packets | Discarded packets |
| A | 0 | 108 | 0 |
| B | 0 | 108 | 0 |
| C | 0 | 108 | 0 |
| D | 0 | 108 | 0 |
| Mode M9 | |||
|---|---|---|---|
| Quadrant | BADHDUFLAG | Total packets | Discarded packets |
| A | 0 | 31 | 0 |
| B | 0 | 31 | 0 |
| C | 0 | 31 | 0 |
| D | 0 | 32 | 0 |
| Mode M0 | |||
|---|---|---|---|
| Quadrant | BADHDUFLAG | Total packets | Discarded packets |
| A | 0 | 11973 | 3 |
| B | 0 | 16911 | 2 |
| C | 0 | 12874 | 2 |
| D | 0 | 19042 | 2 |
| Quadrant | Total seconds | Saturated seconds | Saturation percentage |
|---|---|---|---|
| A | 5374 | 17 | 0.316338% |
| B | 5374 | 464 | 8.634164% |
| C | 5374 | 48 | 0.893189% |
| D | 5374 | 355 | 6.605880% |
Noise dominated data is calculated using 1-second bins in cleaned event files. If a bin has >2000 counts, and if more than 50% of those come from <1% of pixels, then it is considered to be noise-dominated and hence unusable.
| Quadrant | # 1 sec bins | Bins with >0 counts | Bins with >2000 counts | High rate bins dominated by noise | Noise dominated (total time) | Noise dominated (detector-on time) | Marked lightcurve |
|---|---|---|---|---|---|---|---|
| A | 7377 | 5375 | 2 | 2 | 0.03% | 0.04% | 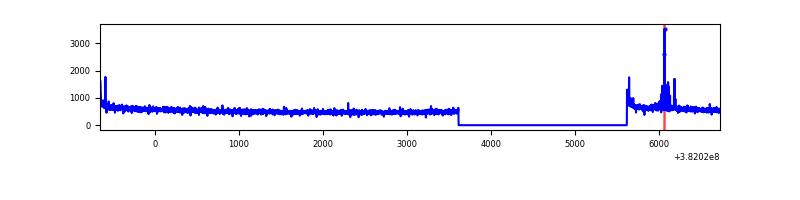 |
| B | 7377 | 5375 | 323 | 323 | 4.38% | 6.01% | 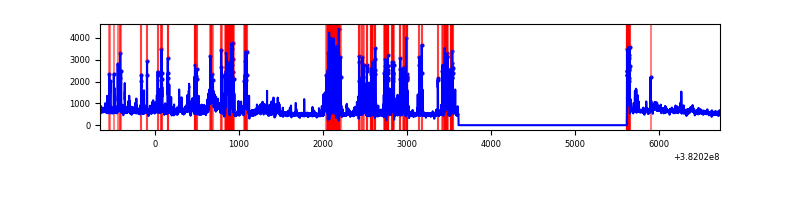 |
| C | 7377 | 5375 | 31 | 31 | 0.42% | 0.58% | 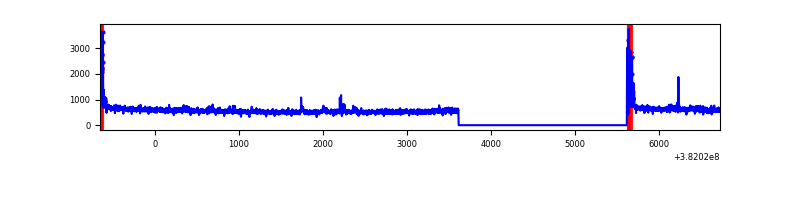 |
| D | 7377 | 5375 | 294 | 294 | 3.99% | 5.47% | 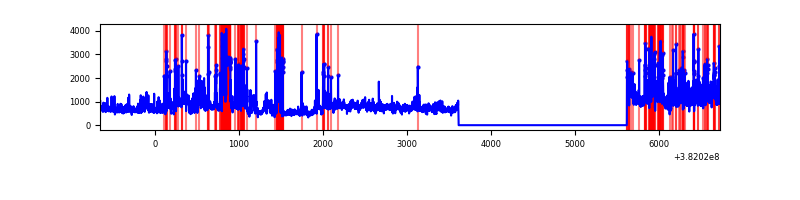 |
Top three noisy pixels from each quadrant. If the there are fewer than three noisy pixels in the level2.evt file, extra rows are filled as -1
| Pixel properties | Quadrant properties | ||||||
|---|---|---|---|---|---|---|---|
| Quadrant | DetID | PixID | Counts | Sigma | Mean | Median | Sigma |
| A | 9 | 143 | 41054 | 281.46 | 726 | 713 | 143.3 |
| A | 10 | 83 | 36523 | 249.85 | 726 | 713 | 143.3 |
| A | 13 | 6 | 17157 | 114.73 | 726 | 713 | 143.3 |
| B | 5 | 172 | 966466 | 7497.77 | 694 | 680 | 128.8 |
| B | 0 | 229 | 436793 | 3385.72 | 694 | 680 | 128.8 |
| B | 0 | 190 | 267963 | 2075.02 | 694 | 680 | 128.8 |
| C | 15 | 214 | 226715 | 1440.81 | 692 | 700 | 156.9 |
| C | 0 | 10 | 147918 | 938.49 | 692 | 700 | 156.9 |
| C | 14 | 67 | 64622 | 407.49 | 692 | 700 | 156.9 |
| D | 8 | 195 | 1130939 | 6785.69 | 678 | 661 | 166.6 |
| D | 13 | 249 | 623665 | 3740.24 | 678 | 661 | 166.6 |
| D | 2 | 250 | 159178 | 951.67 | 678 | 661 | 166.6 |
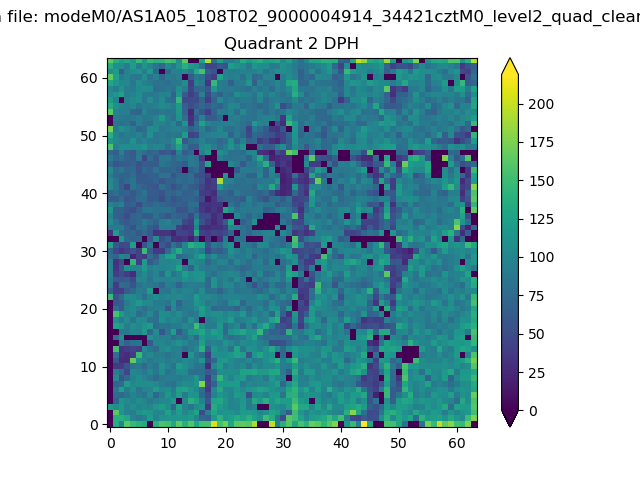
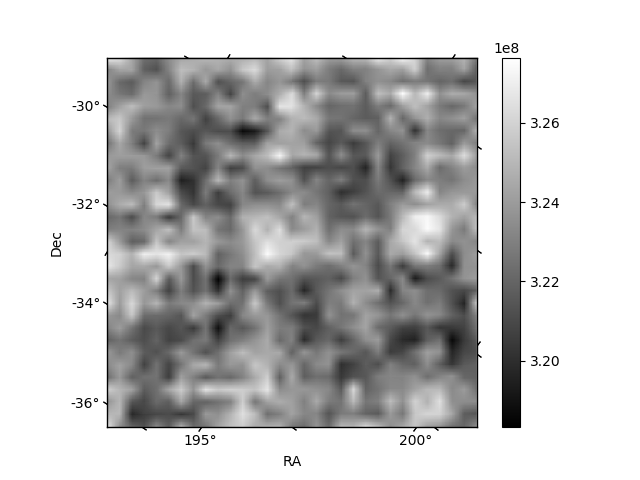
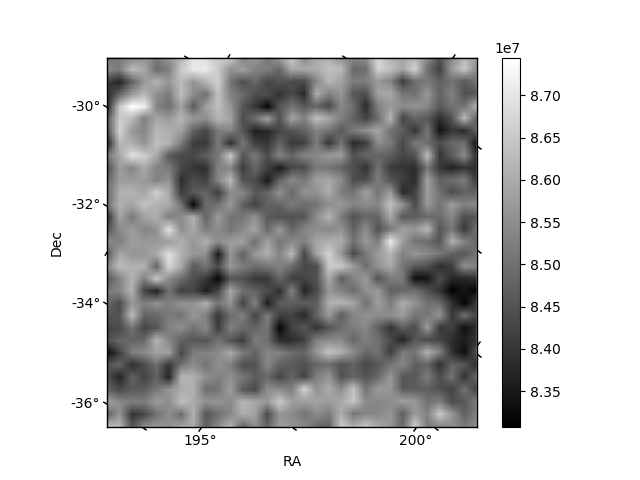
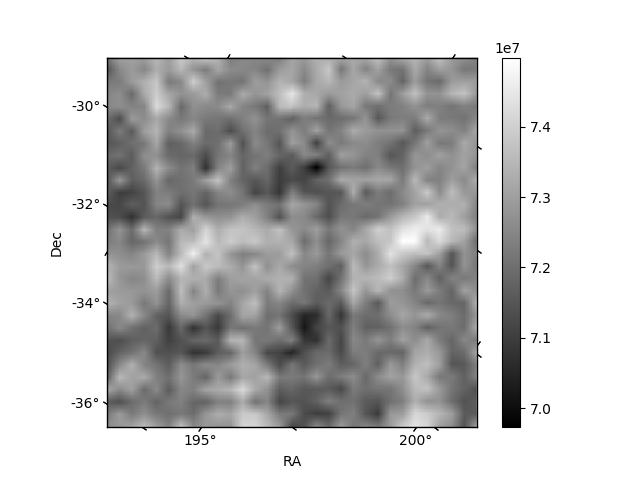
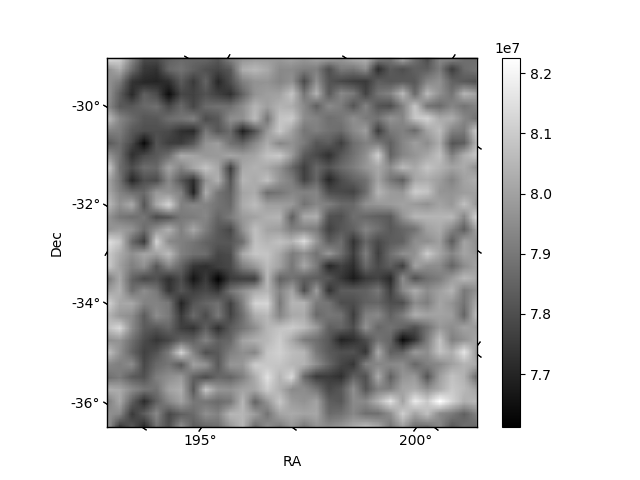
Histogram calculated using DETX and DETY for each event in the final _common_clean file
| Quadrant A | 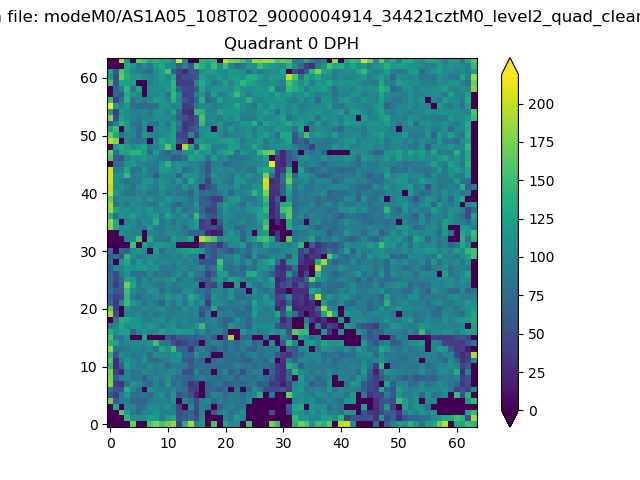 |
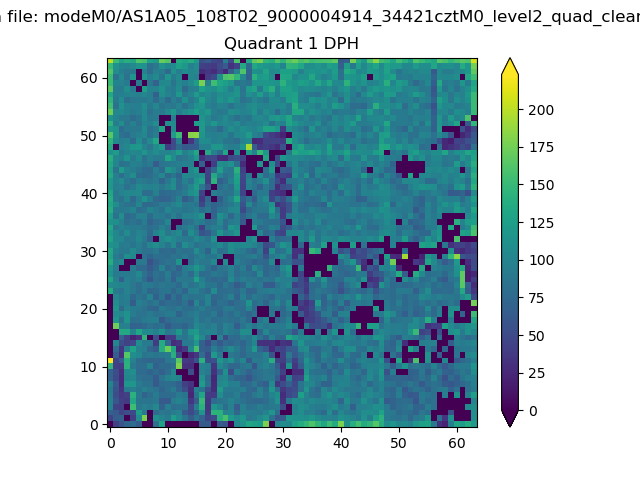 |
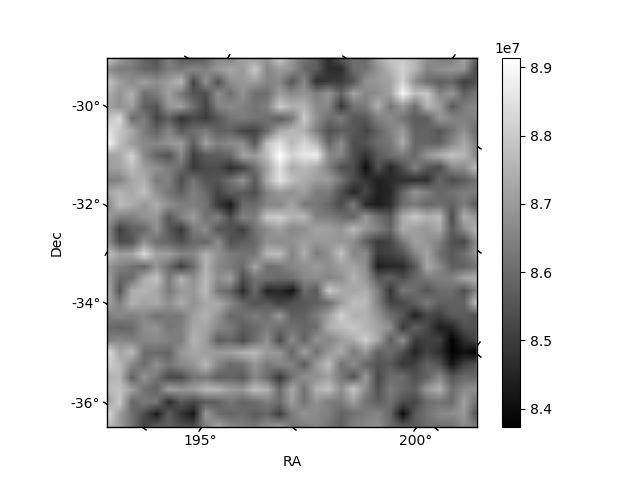
Quadrant B |
|---|---|---|---|
| Quadrant D | 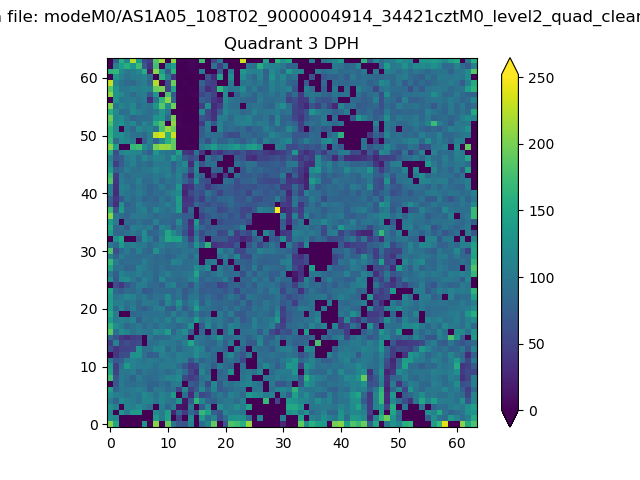 |
 |
Quadrant C |
| Plot type | Count rate plots | Images |
|---|---|---|
| Comparison with Poisson distribution Blue bars denote a histogram of data divided into 1 sec bins. Red curve is a Poisson curve with rate = median count rate of data. |
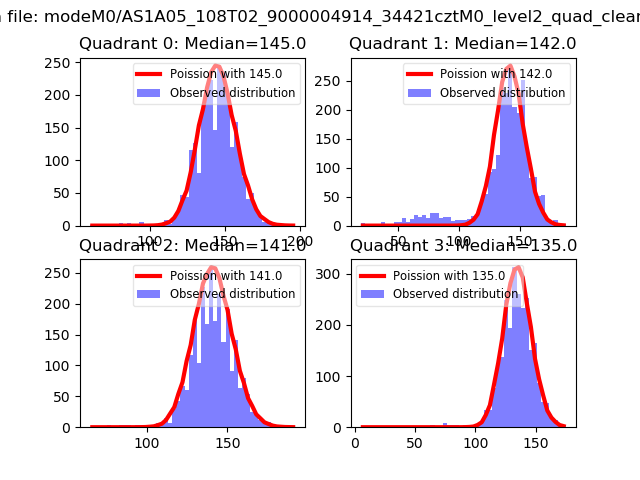 |
 |
| Quadrant-wise count rates Data is divided into 100 sec bins |
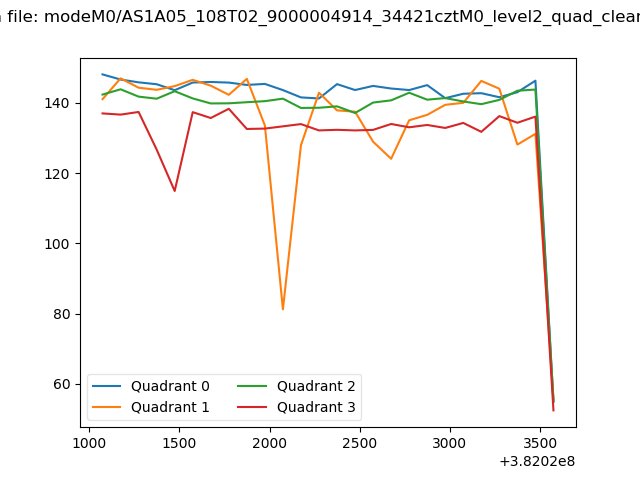 |
|
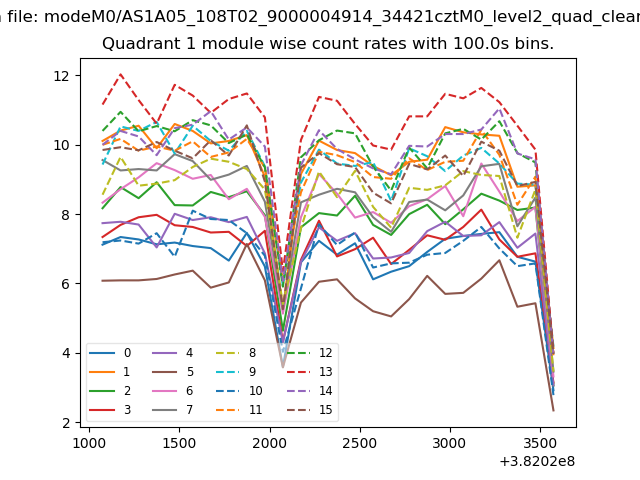
| Module-wise count rates for Quadrant A Data is divided into 100 sec bins |
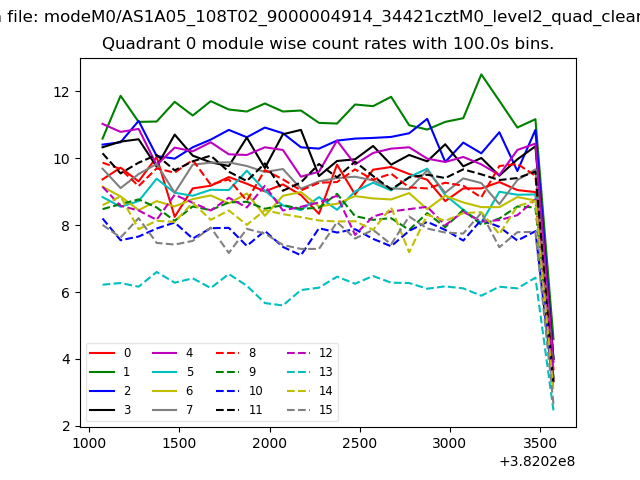 |
 |
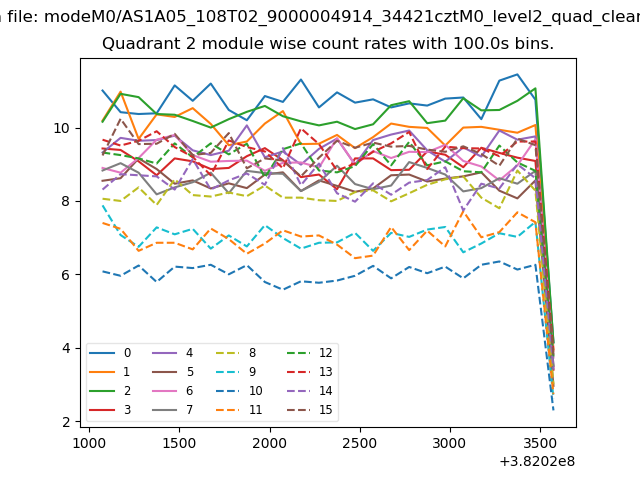
| Module-wise count rates for Quadrant B Data is divided into 100 sec bins |
 |
 |
| Module-wise count rates for Quadrant C Data is divided into 100 sec bins |
 |
 |
| Module-wise count rates for Quadrant D Data is divided into 100 sec bins |
 |
 |
| Parameter | Plot |
|---|---|
| CZT HV Monitor | 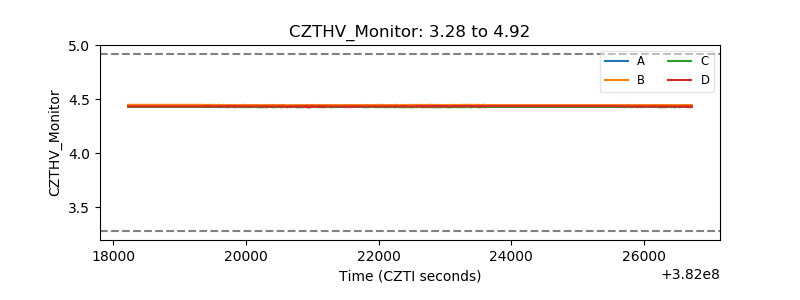 |
| D_VDD | 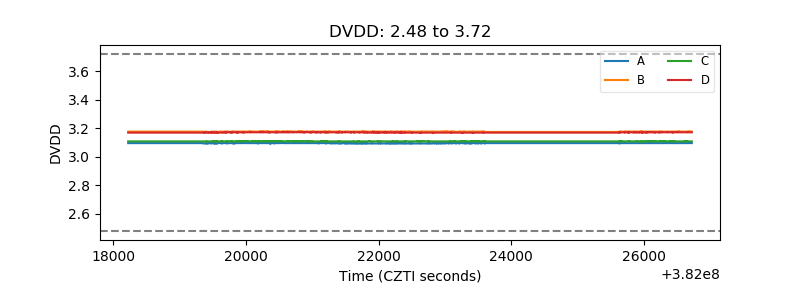 |
| Temperature 1 | 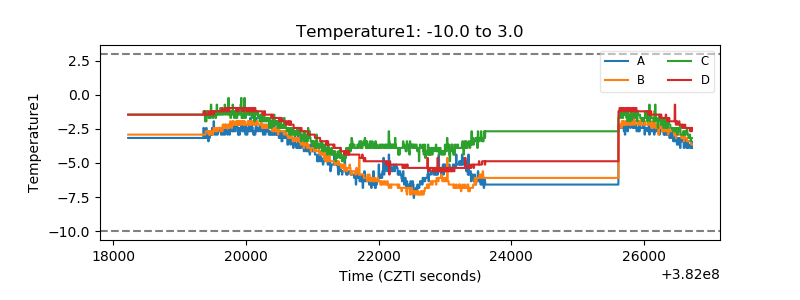 |
| Veto HV Monitor | 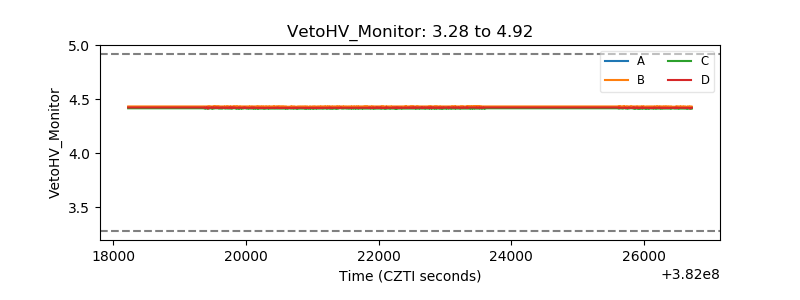 |
| Veto LLD | 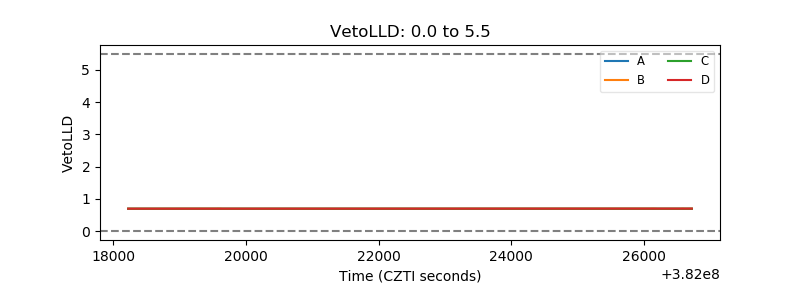 |
| Alpha Counter | 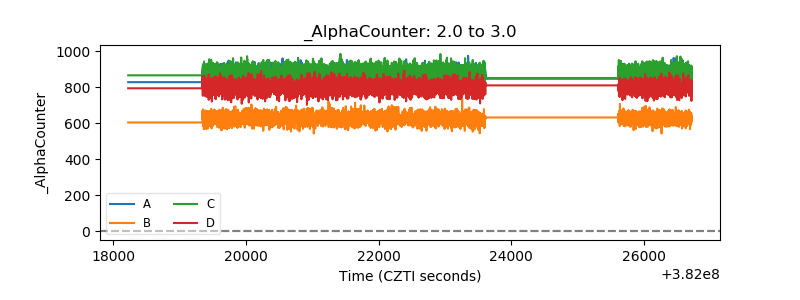 |
| _CPM_Rate | 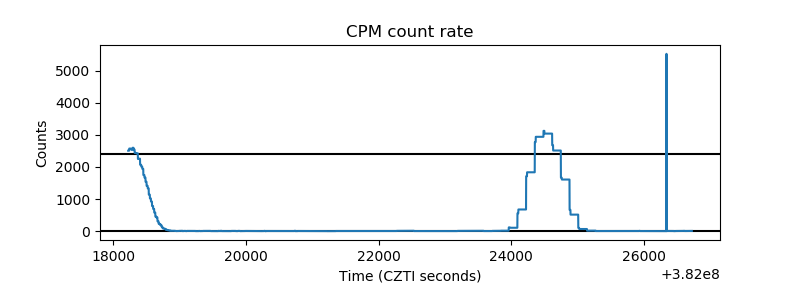 |
| CZT Counter | 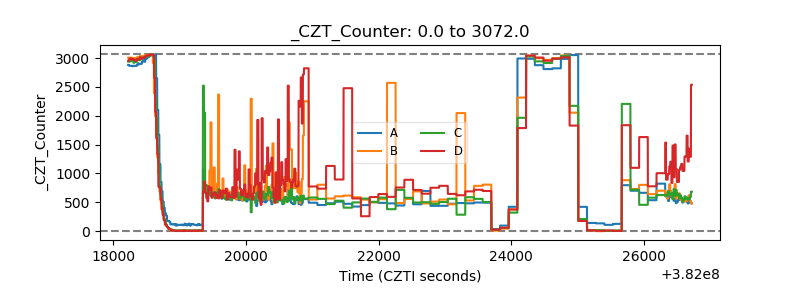 |
| +2.5 Volts monitor | 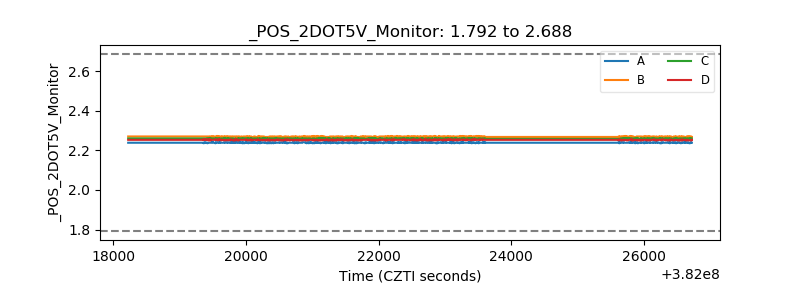 |
| +5 Volts monitor | 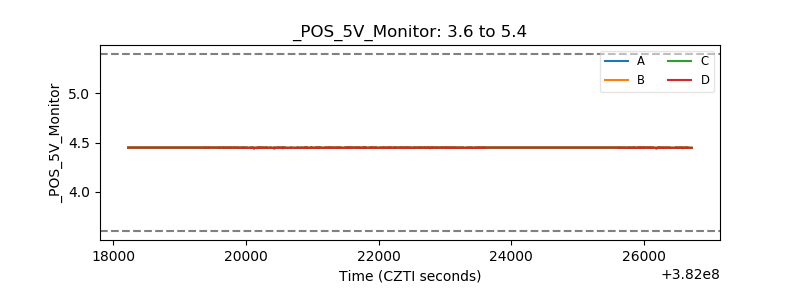 |
| _ROLL_ROT | 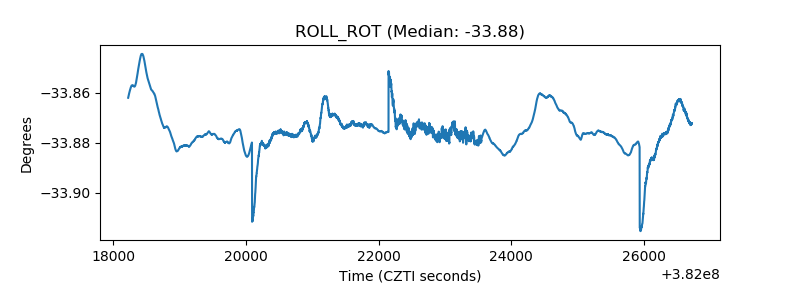 |
| _Roll_DEC | 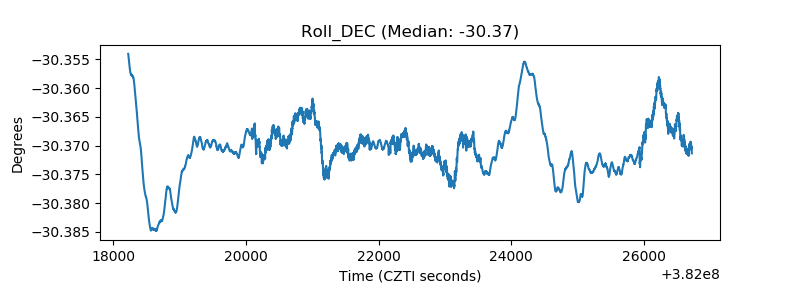 |
| _Roll_RA | 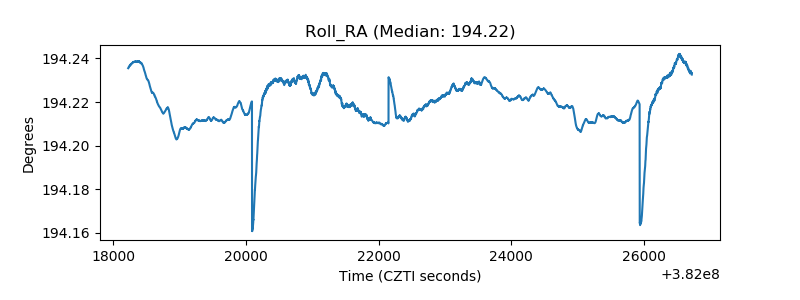 |
| Veto Counter | 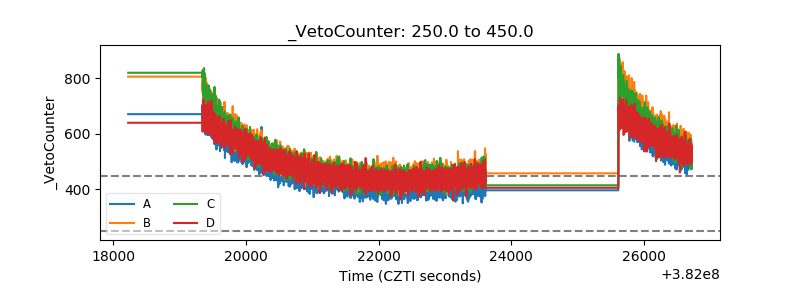 |