| Param | Original file | Final file |
|---|---|---|
| Filename | modeM0/AS1A05_108T02_9000004914_34420cztM0_level2.evt | modeM0/AS1A05_108T02_9000004914_34420cztM0_level2_quad_clean.evt |
| Size (bytes) | 482,466,240 | 51,943,680 |
| Size | 460.1 MB | 49.5 MB |
| Events in quadrant A | 2,851,597 | 302,849 |
| Events in quadrant B | 3,802,638 | 298,447 |
| Events in quadrant C | 3,192,190 | 299,727 |
| Events in quadrant D | 4,387,683 | 281,750 |
| Mode SS | |||
|---|---|---|---|
| Quadrant | BADHDUFLAG | Total packets | Discarded packets |
| A | 0 | 114 | 0 |
| B | 0 | 114 | 0 |
| C | 0 | 114 | 0 |
| D | 0 | 114 | 0 |
| Mode M9 | |||
|---|---|---|---|
| Quadrant | BADHDUFLAG | Total packets | Discarded packets |
| A | 0 | 30 | 0 |
| B | 0 | 30 | 0 |
| C | 0 | 30 | 0 |
| D | 0 | 31 | 0 |
| Mode M0 | |||
|---|---|---|---|
| Quadrant | BADHDUFLAG | Total packets | Discarded packets |
| A | 0 | 11894 | 3 |
| B | 0 | 14876 | 2 |
| C | 0 | 12854 | 2 |
| D | 0 | 17133 | 2 |
| Quadrant | Total seconds | Saturated seconds | Saturation percentage |
|---|---|---|---|
| A | 5566 | 12 | 0.215595% |
| B | 5566 | 229 | 4.114265% |
| C | 5566 | 33 | 0.592885% |
| D | 5566 | 100 | 1.796622% |
Noise dominated data is calculated using 1-second bins in cleaned event files. If a bin has >2000 counts, and if more than 50% of those come from <1% of pixels, then it is considered to be noise-dominated and hence unusable.
| Quadrant | # 1 sec bins | Bins with >0 counts | Bins with >2000 counts | High rate bins dominated by noise | Noise dominated (total time) | Noise dominated (detector-on time) | Marked lightcurve |
|---|---|---|---|---|---|---|---|
| A | 7449 | 5567 | 2 | 2 | 0.03% | 0.04% | 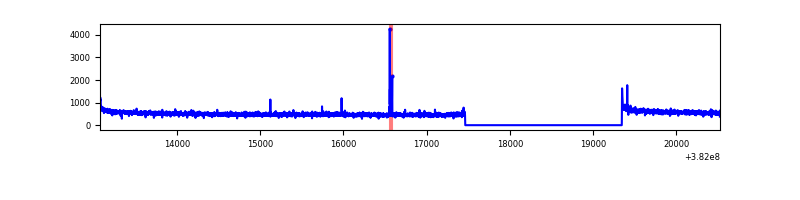 |
| B | 7449 | 5567 | 141 | 141 | 1.89% | 2.53% | 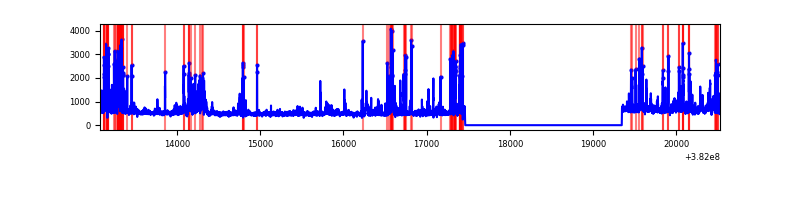 |
| C | 7449 | 5567 | 21 | 21 | 0.28% | 0.38% | 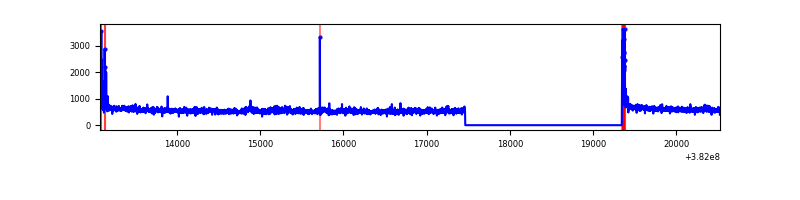 |
| D | 7449 | 5567 | 89 | 89 | 1.19% | 1.60% | 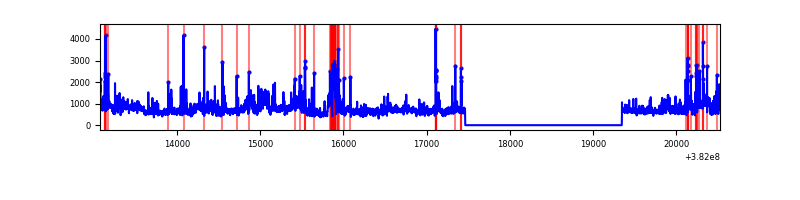 |
Top three noisy pixels from each quadrant. If the there are fewer than three noisy pixels in the level2.evt file, extra rows are filled as -1
| Pixel properties | Quadrant properties | ||||||
|---|---|---|---|---|---|---|---|
| Quadrant | DetID | PixID | Counts | Sigma | Mean | Median | Sigma |
| A | 10 | 83 | 36001 | 248.76 | 720 | 708 | 141.9 |
| A | 9 | 143 | 16968 | 114.61 | 720 | 708 | 141.9 |
| A | 13 | 6 | 15219 | 102.28 | 720 | 708 | 141.9 |
| B | 5 | 172 | 814794 | 6235.87 | 699 | 681 | 130.6 |
| B | 0 | 190 | 73695 | 559.27 | 699 | 681 | 130.6 |
| B | 0 | 229 | 73286 | 556.13 | 699 | 681 | 130.6 |
| C | 15 | 214 | 235406 | 1490.13 | 693 | 699 | 157.5 |
| C | 14 | 67 | 134834 | 851.61 | 693 | 699 | 157.5 |
| C | 0 | 10 | 99304 | 626.03 | 693 | 699 | 157.5 |
| D | 8 | 195 | 876632 | 5133.77 | 692 | 673 | 170.6 |
| D | 2 | 207 | 163120 | 952.06 | 692 | 673 | 170.6 |
| D | 14 | 52 | 121087 | 705.71 | 692 | 673 | 170.6 |
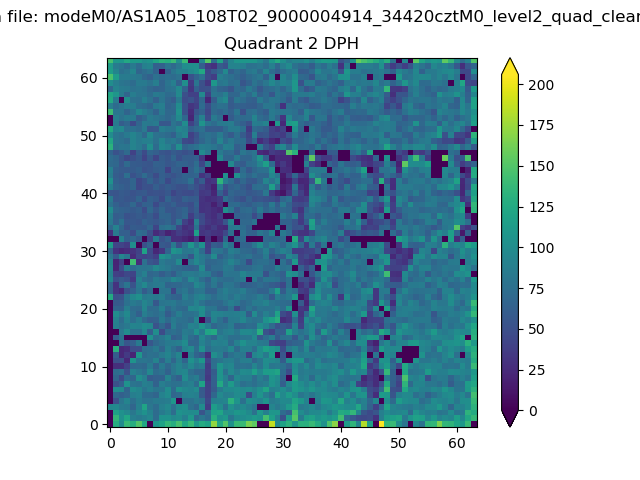
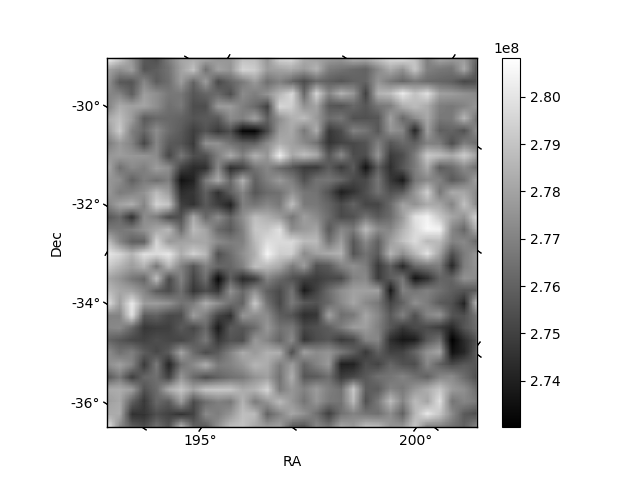
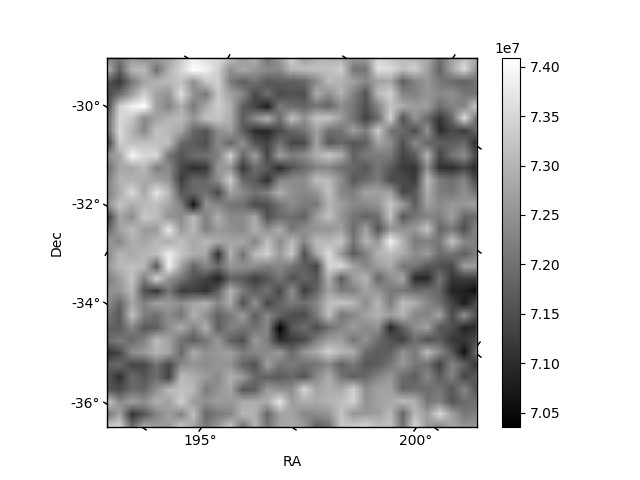
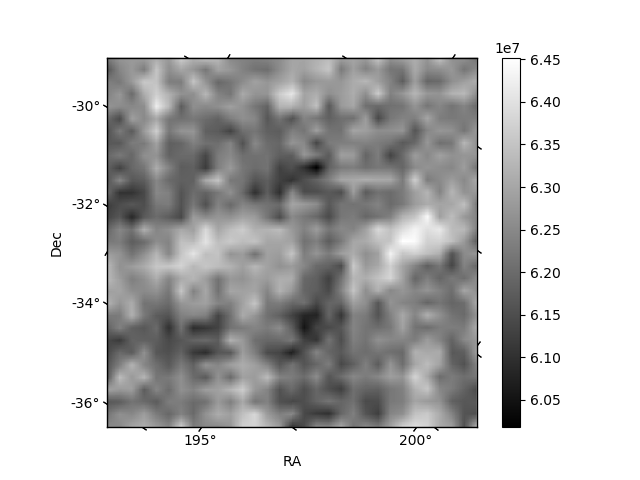
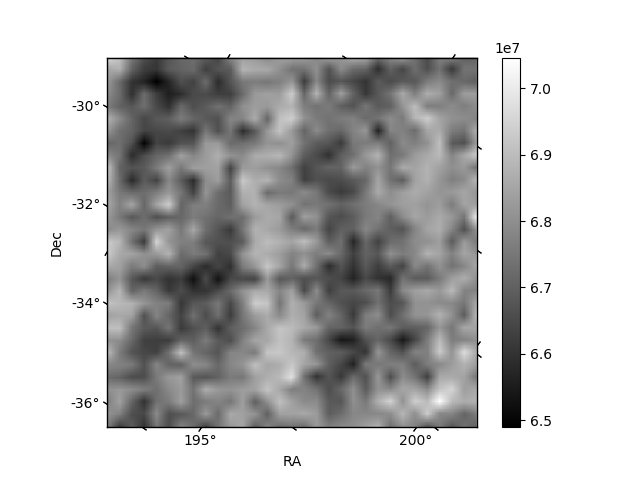
Histogram calculated using DETX and DETY for each event in the final _common_clean file
| Quadrant A | 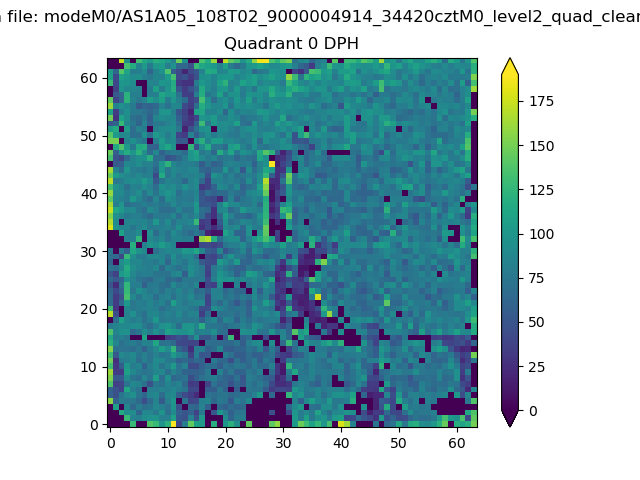 |
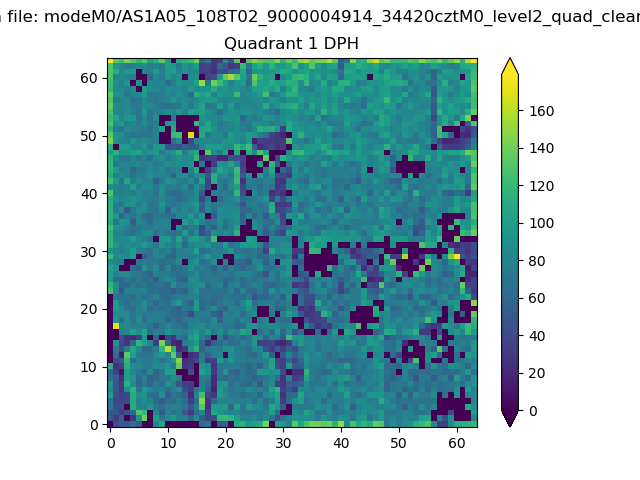 |
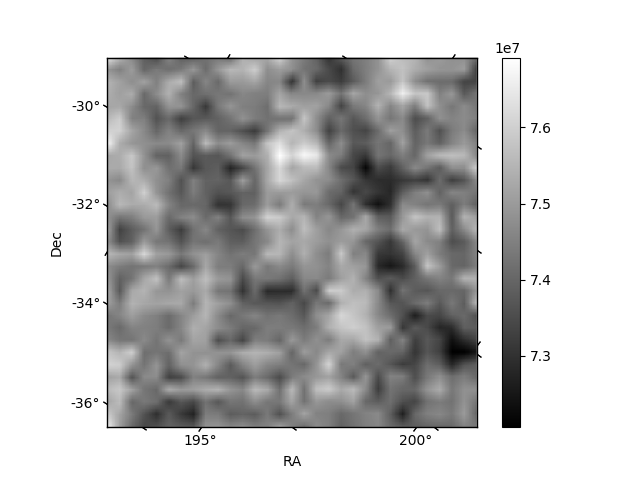
Quadrant B |
|---|---|---|---|
| Quadrant D | 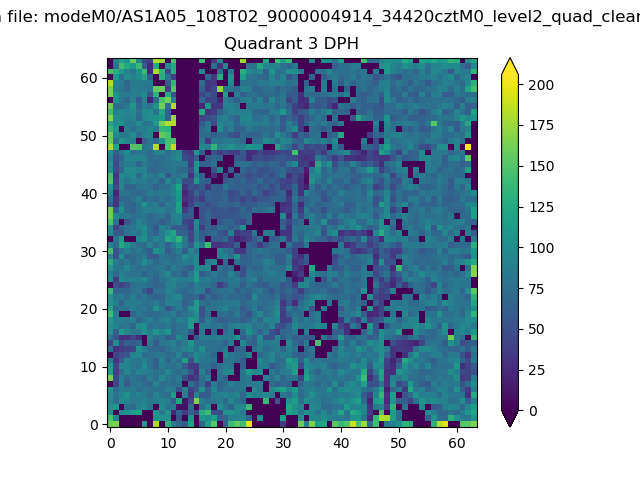 |
 |
Quadrant C |
| Plot type | Count rate plots | Images |
|---|---|---|
| Comparison with Poisson distribution Blue bars denote a histogram of data divided into 1 sec bins. Red curve is a Poisson curve with rate = median count rate of data. |
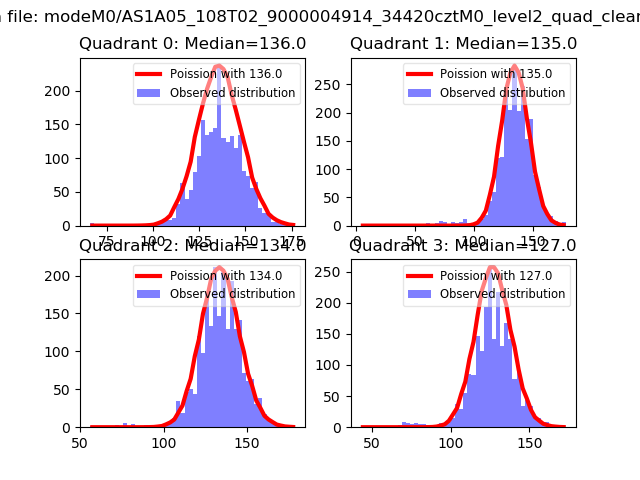 |
 |
| Quadrant-wise count rates Data is divided into 100 sec bins |
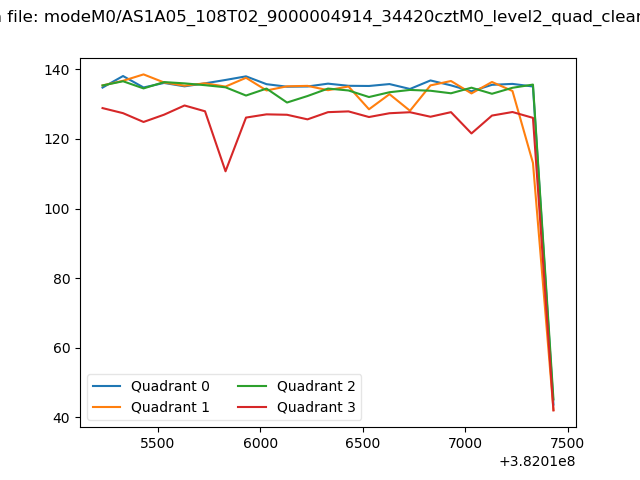 |
|
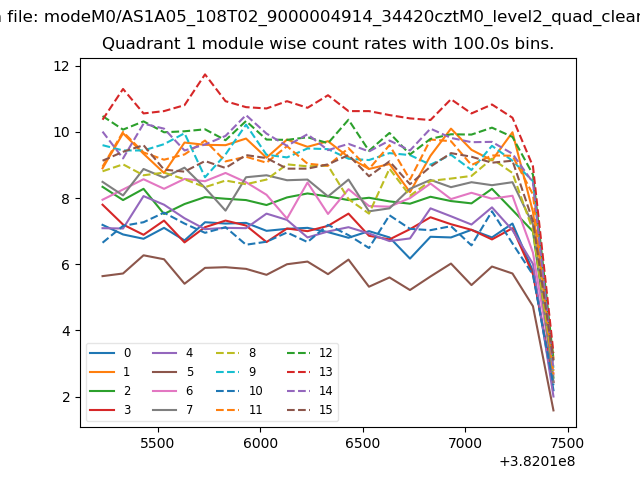
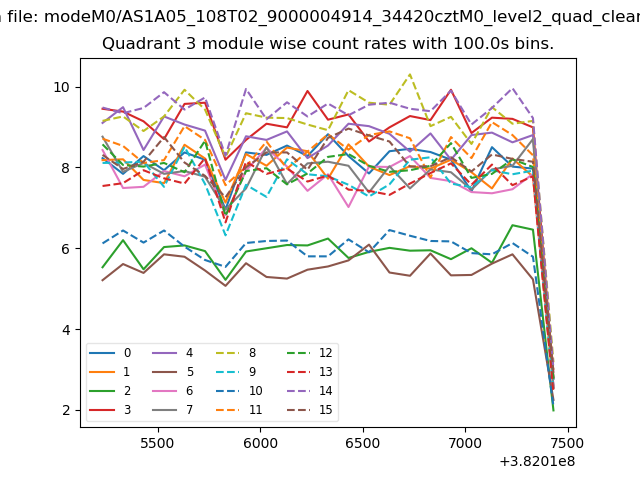
| Module-wise count rates for Quadrant A Data is divided into 100 sec bins |
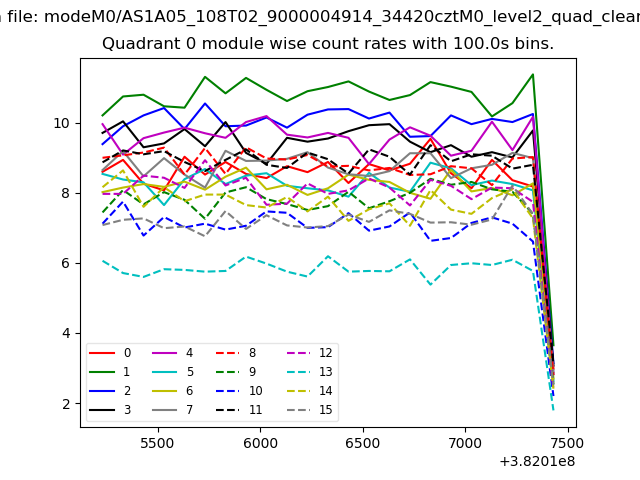 |
 |
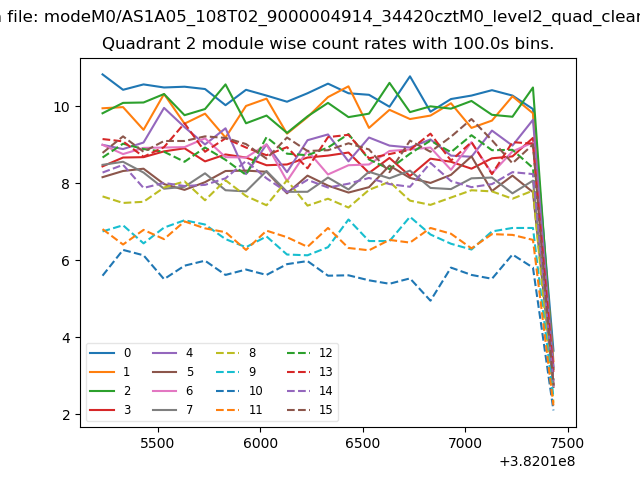
| Module-wise count rates for Quadrant B Data is divided into 100 sec bins |
 |
 |
| Module-wise count rates for Quadrant C Data is divided into 100 sec bins |
 |
 |
| Module-wise count rates for Quadrant D Data is divided into 100 sec bins |
 |
 |
| Parameter | Plot |
|---|---|
| CZT HV Monitor |  |
| D_VDD | 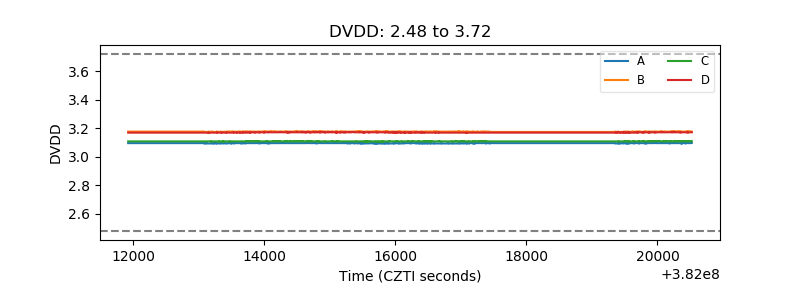 |
| Temperature 1 | 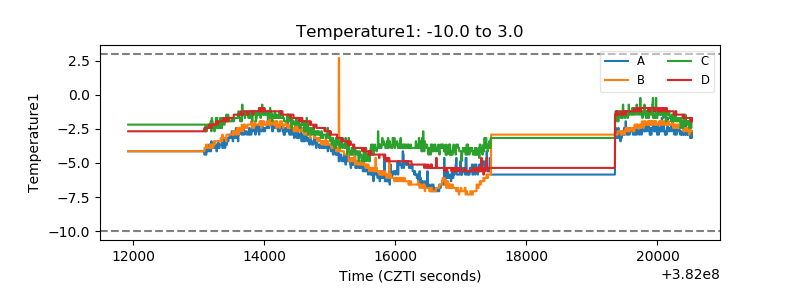 |
| Veto HV Monitor | 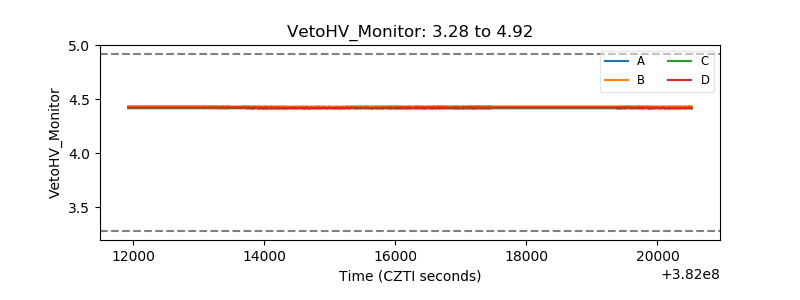 |
| Veto LLD | 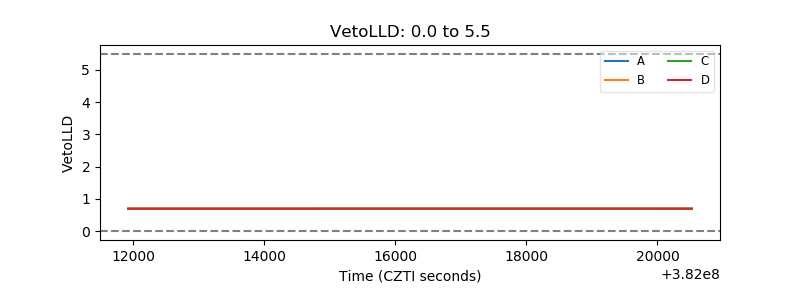 |
| Alpha Counter | 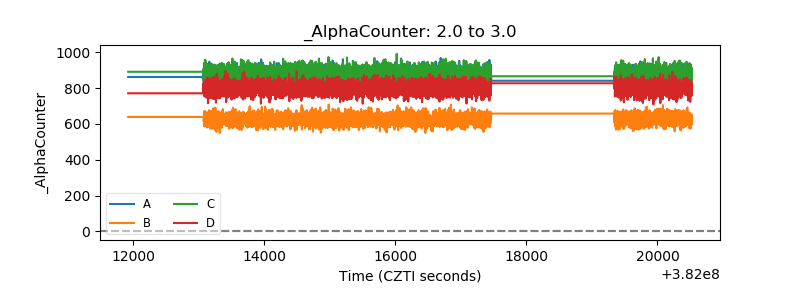 |
| _CPM_Rate | 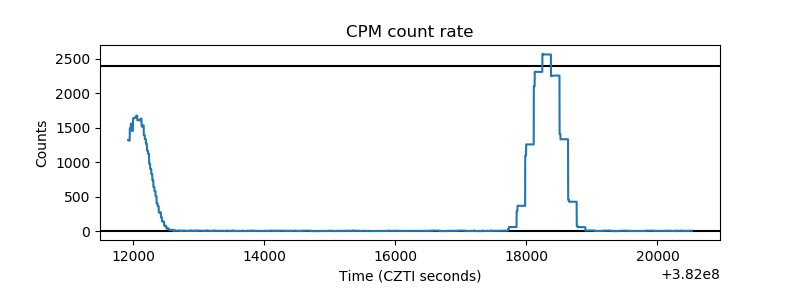 |
| CZT Counter | 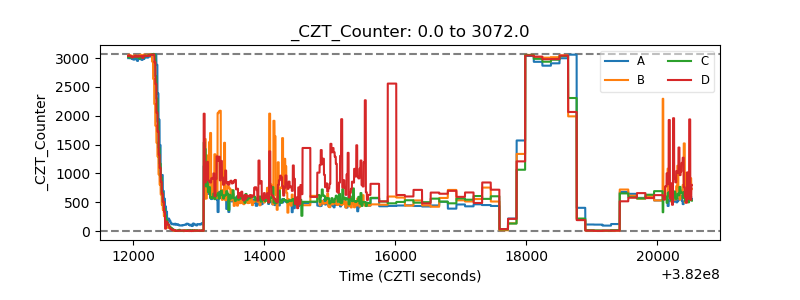 |
| +2.5 Volts monitor | 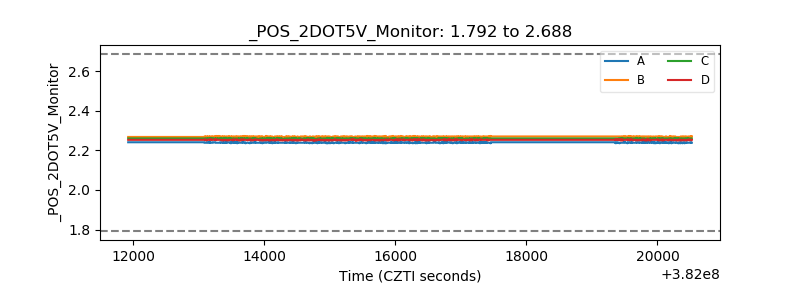 |
| +5 Volts monitor | 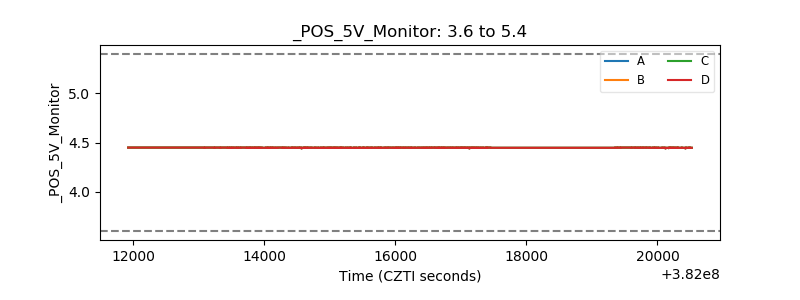 |
| _ROLL_ROT | 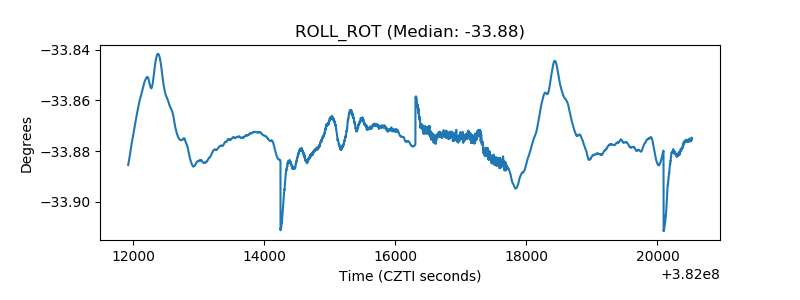 |
| _Roll_DEC | 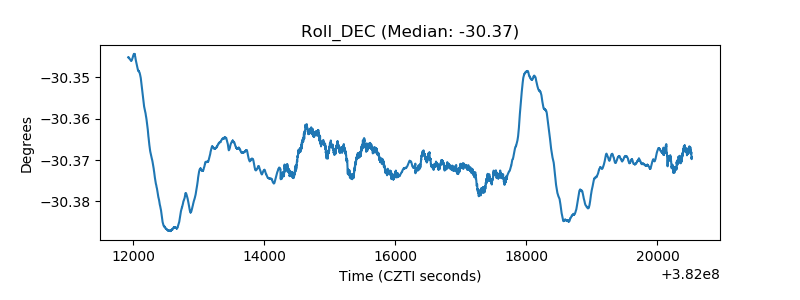 |
| _Roll_RA | 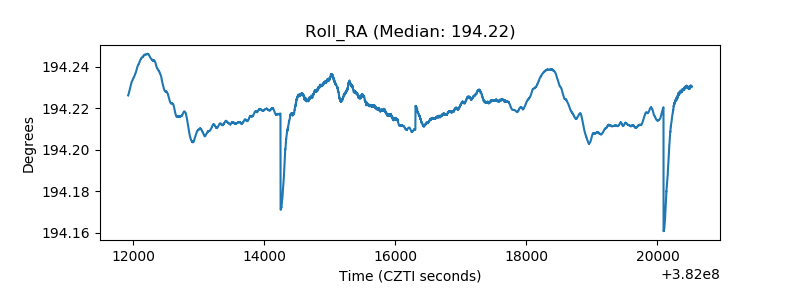 |
| Veto Counter | 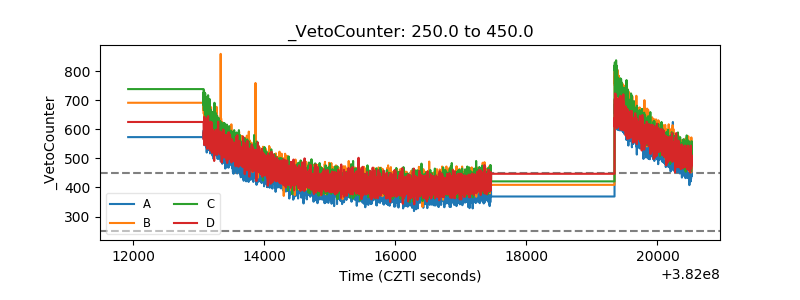 |