| Param | Original file | Final file |
|---|---|---|
| Filename | modeM0/AS1A05_108T02_9000004914_34417cztM0_level2.evt | modeM0/AS1A05_108T02_9000004914_34417cztM0_level2_quad_clean.evt |
| Size (bytes) | 482,734,080 | 61,283,520 |
| Size | 460.4 MB | 58.4 MB |
| Events in quadrant A | 2,807,676 | 374,315 |
| Events in quadrant B | 3,298,137 | 378,926 |
| Events in quadrant C | 3,782,973 | 367,279 |
| Events in quadrant D | 4,359,330 | 351,253 |
| Mode SS | |||
|---|---|---|---|
| Quadrant | BADHDUFLAG | Total packets | Discarded packets |
| A | 0 | 112 | 0 |
| B | 0 | 112 | 0 |
| C | 0 | 112 | 0 |
| D | 0 | 112 | 0 |
| Mode M9 | |||
|---|---|---|---|
| Quadrant | BADHDUFLAG | Total packets | Discarded packets |
| A | 0 | 16 | 0 |
| B | 0 | 16 | 0 |
| C | 0 | 16 | 0 |
| D | 0 | 16 | 0 |
| Mode M0 | |||
|---|---|---|---|
| Quadrant | BADHDUFLAG | Total packets | Discarded packets |
| A | 0 | 11840 | 3 |
| B | 0 | 13184 | 2 |
| C | 0 | 14721 | 2 |
| D | 0 | 16887 | 2 |
| Quadrant | Total seconds | Saturated seconds | Saturation percentage |
|---|---|---|---|
| A | 5480 | 57 | 1.040146% |
| B | 5480 | 155 | 2.828467% |
| C | 5480 | 107 | 1.952555% |
| D | 5480 | 121 | 2.208029% |
Noise dominated data is calculated using 1-second bins in cleaned event files. If a bin has >2000 counts, and if more than 50% of those come from <1% of pixels, then it is considered to be noise-dominated and hence unusable.
| Quadrant | # 1 sec bins | Bins with >0 counts | Bins with >2000 counts | High rate bins dominated by noise | Noise dominated (total time) | Noise dominated (detector-on time) | Marked lightcurve |
|---|---|---|---|---|---|---|---|
| A | 7092 | 5481 | 40 | 40 | 0.56% | 0.73% | 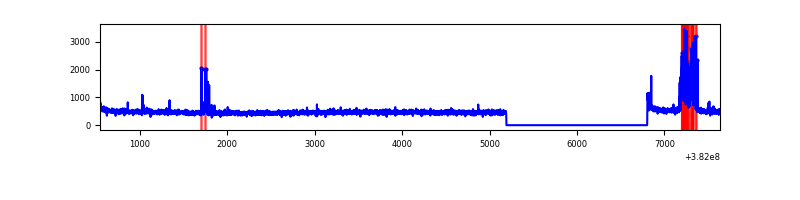 |
| B | 7092 | 5481 | 96 | 96 | 1.35% | 1.75% | 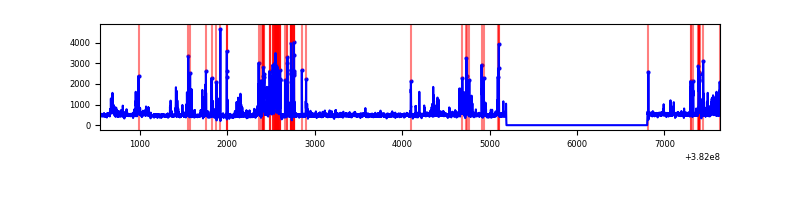 |
| C | 7092 | 5481 | 86 | 86 | 1.21% | 1.57% | 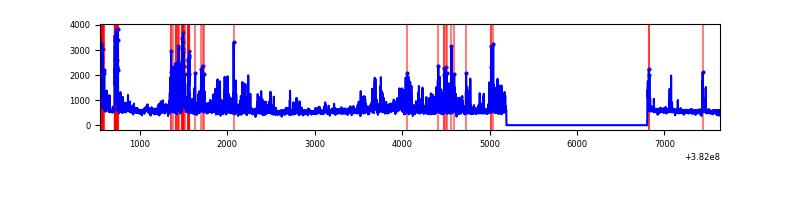 |
| D | 7092 | 5481 | 108 | 108 | 1.52% | 1.97% | 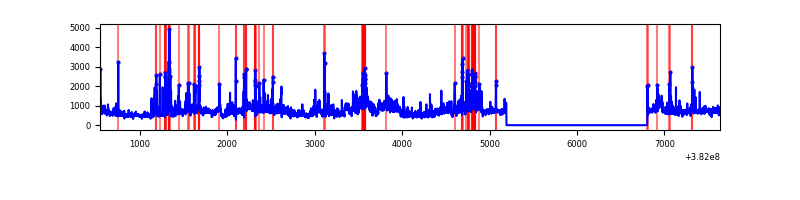 |
Top three noisy pixels from each quadrant. If the there are fewer than three noisy pixels in the level2.evt file, extra rows are filled as -1
| Pixel properties | Quadrant properties | ||||||
|---|---|---|---|---|---|---|---|
| Quadrant | DetID | PixID | Counts | Sigma | Mean | Median | Sigma |
| A | 9 | 143 | 252991 | 1911.26 | 652 | 639 | 132.0 |
| A | 10 | 83 | 31068 | 230.46 | 652 | 639 | 132.0 |
| A | 13 | 254 | 10150 | 72.03 | 652 | 639 | 132.0 |
| B | 5 | 172 | 412827 | 3363.59 | 640 | 622 | 122.5 |
| B | 0 | 229 | 140455 | 1141.04 | 640 | 622 | 122.5 |
| B | 4 | 171 | 85755 | 694.69 | 640 | 622 | 122.5 |
| C | 4 | 254 | 820924 | 5559.03 | 634 | 640 | 147.6 |
| C | 15 | 214 | 232883 | 1573.9 | 634 | 640 | 147.6 |
| C | 14 | 67 | 147981 | 998.52 | 634 | 640 | 147.6 |
| D | 8 | 195 | 918102 | 5870.46 | 635 | 617 | 156.3 |
| D | 14 | 52 | 154605 | 985.28 | 635 | 617 | 156.3 |
| D | 7 | 80 | 151262 | 963.89 | 635 | 617 | 156.3 |
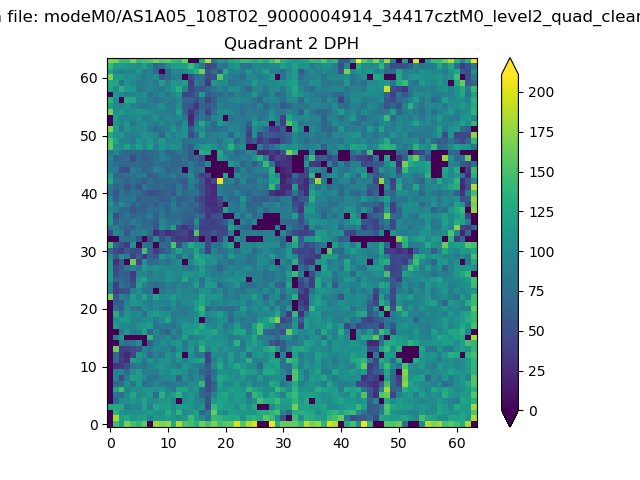
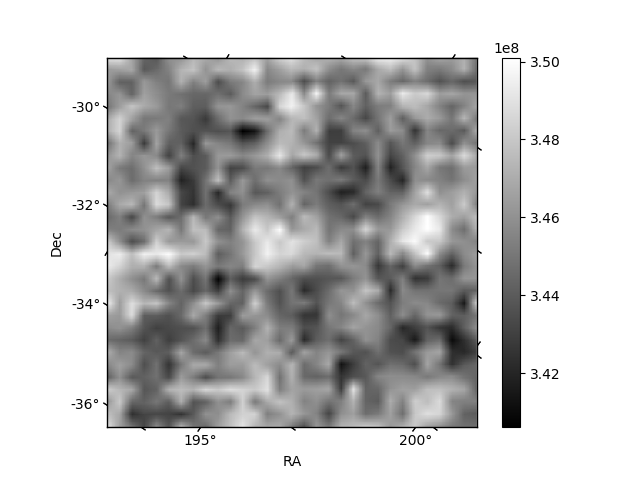
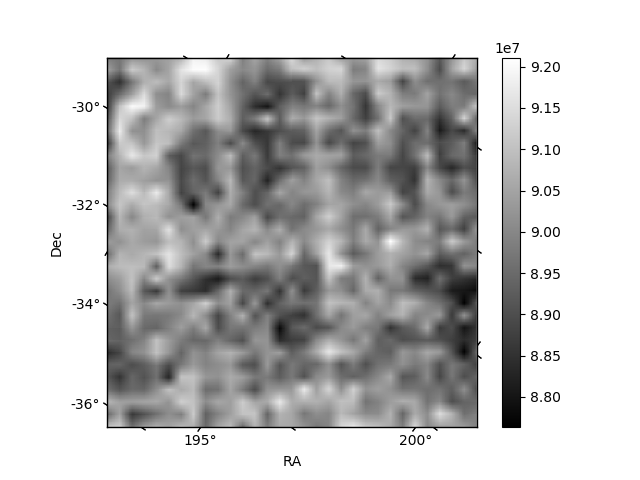
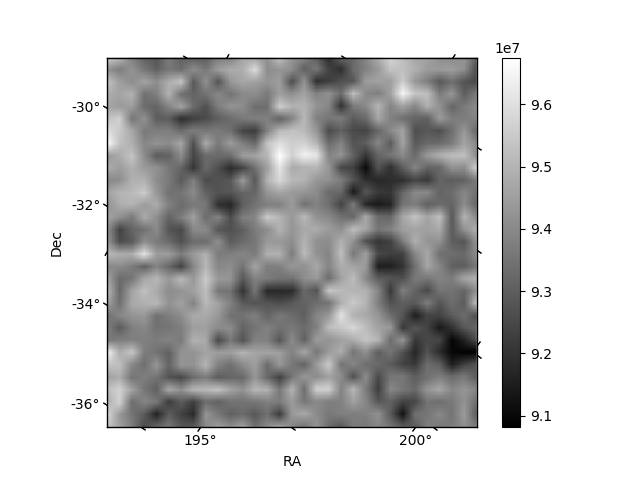
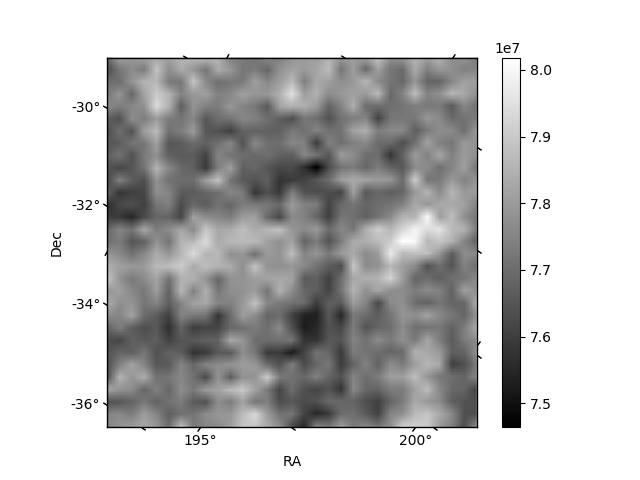
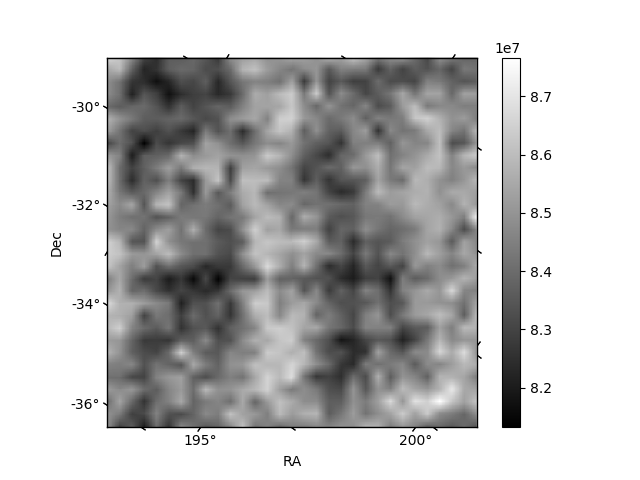
Histogram calculated using DETX and DETY for each event in the final _common_clean file
| Quadrant A | 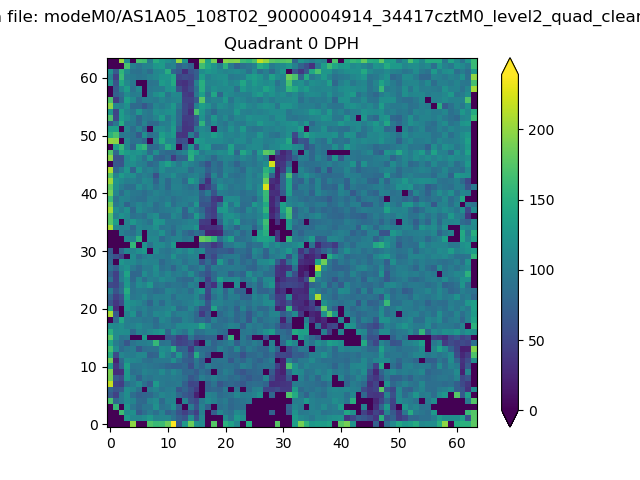 |
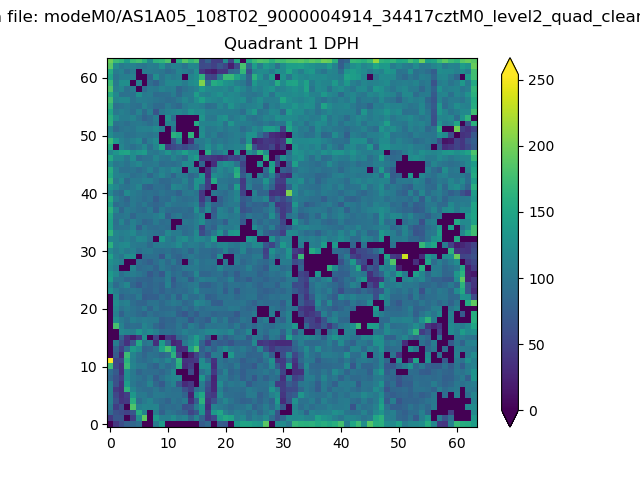 |
Quadrant B |
|---|---|---|---|
| Quadrant D | 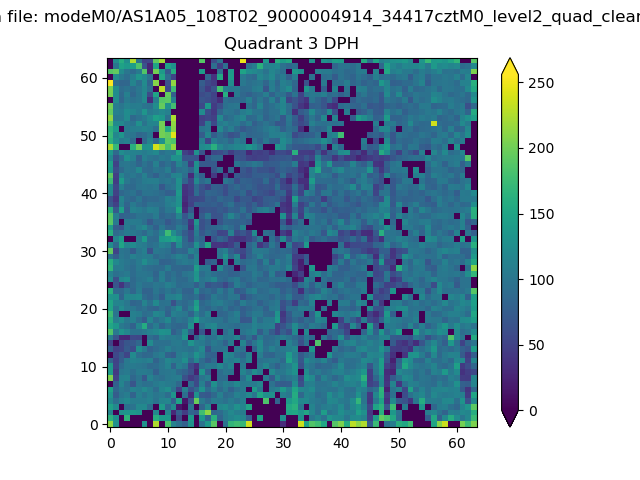 |
 |
Quadrant C |
| Plot type | Count rate plots | Images |
|---|---|---|
| Comparison with Poisson distribution Blue bars denote a histogram of data divided into 1 sec bins. Red curve is a Poisson curve with rate = median count rate of data. |
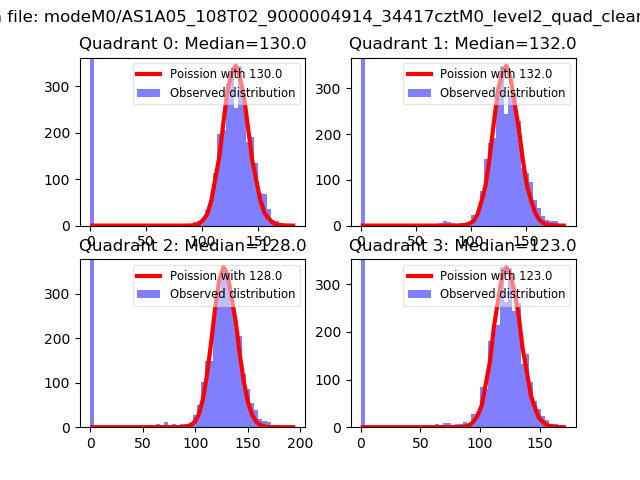 |
 |
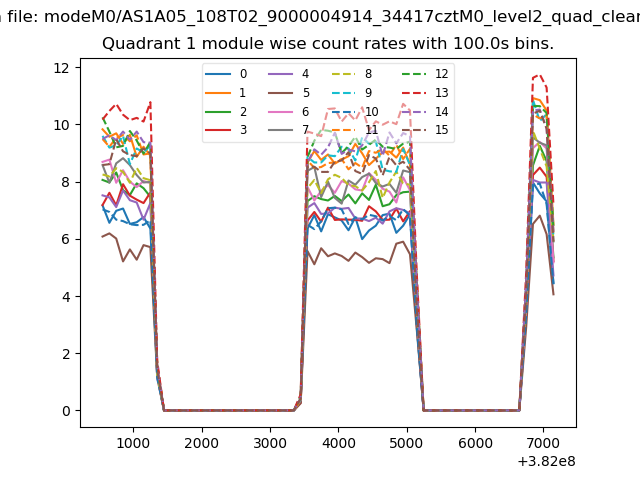
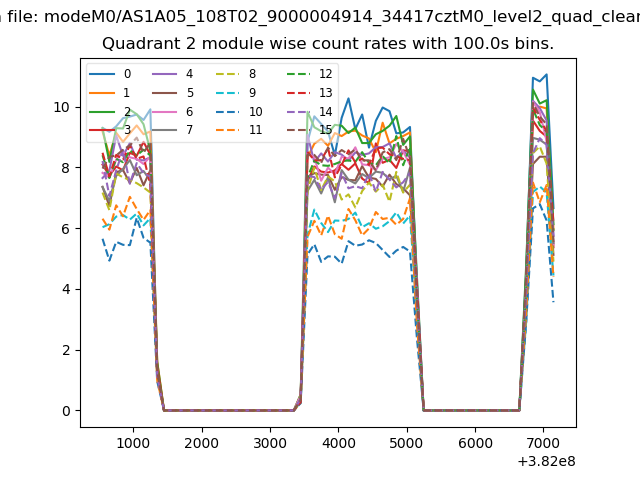
| Quadrant-wise count rates Data is divided into 100 sec bins |
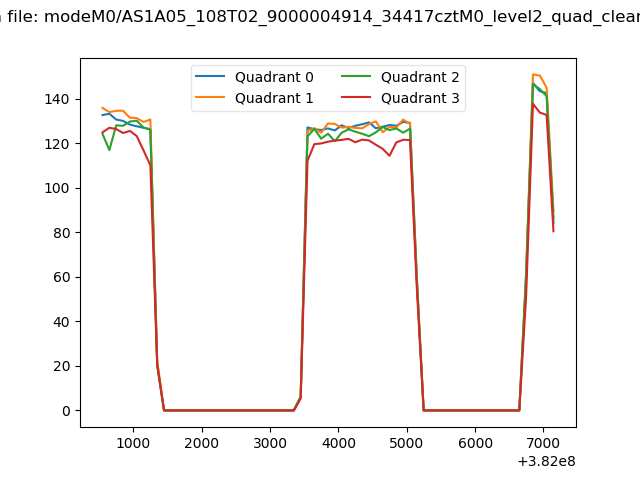 |
|
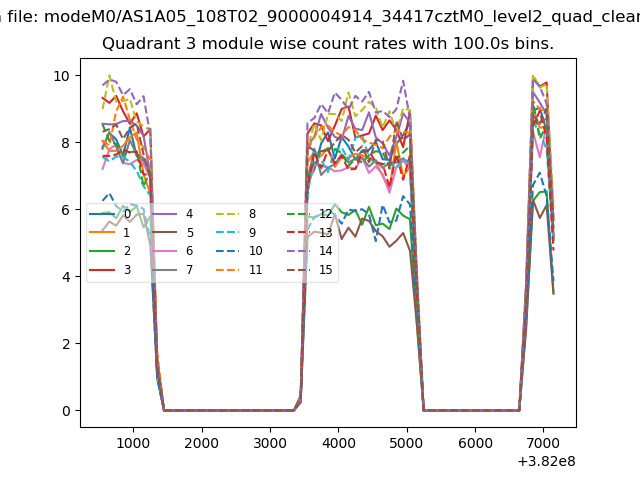
| Module-wise count rates for Quadrant A Data is divided into 100 sec bins |
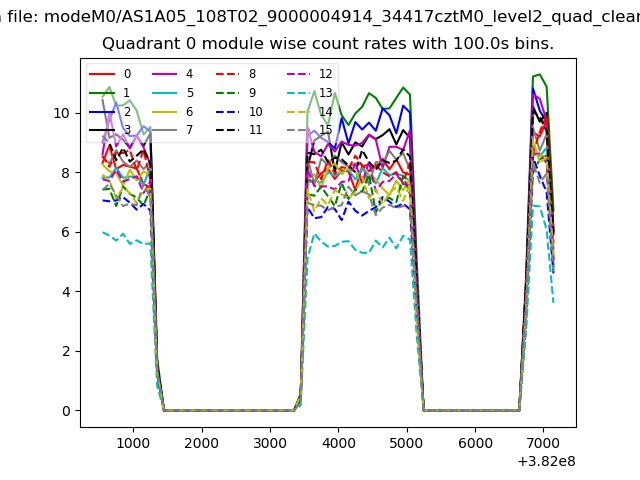 |
 |
| Module-wise count rates for Quadrant B Data is divided into 100 sec bins |
 |
 |
| Module-wise count rates for Quadrant C Data is divided into 100 sec bins |
 |
 |
| Module-wise count rates for Quadrant D Data is divided into 100 sec bins |
 |
 |
| Parameter | Plot |
|---|---|
| CZT HV Monitor | 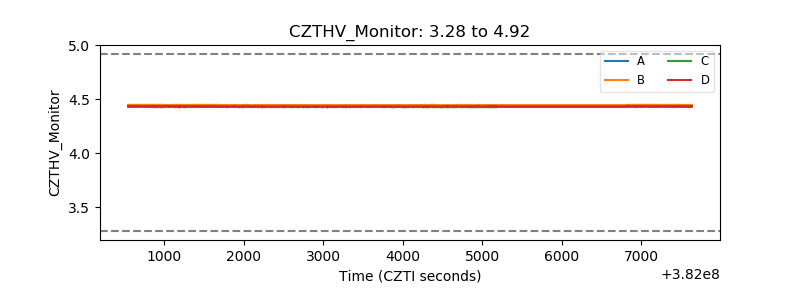 |
| D_VDD | 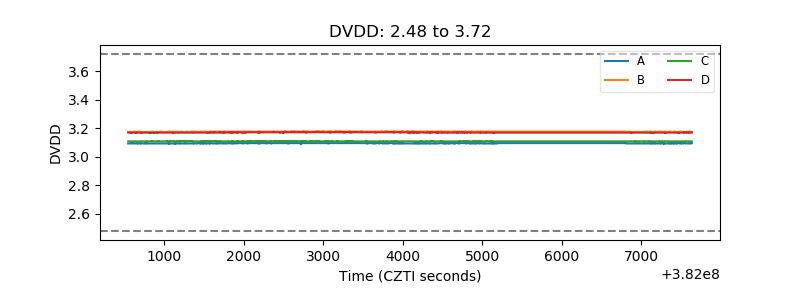 |
| Temperature 1 | 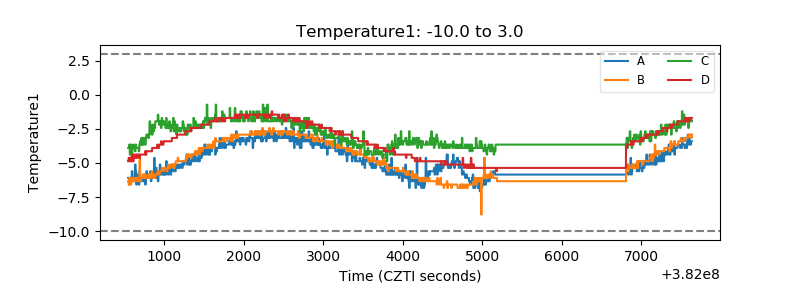 |
| Veto HV Monitor | 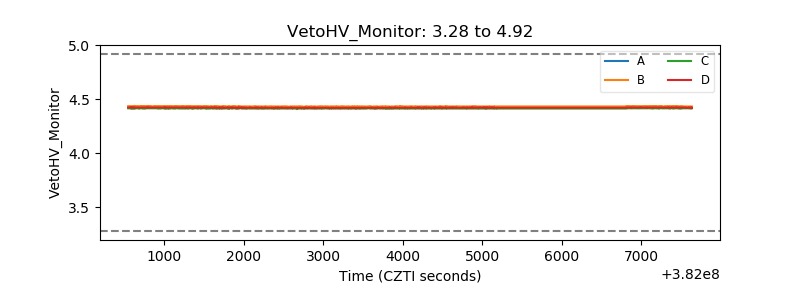 |
| Veto LLD |  |
| Alpha Counter | 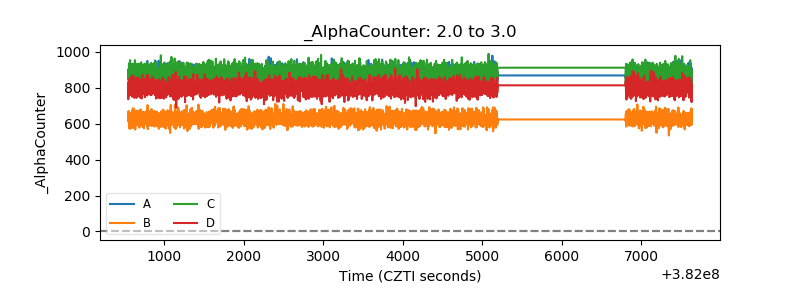 |
| _CPM_Rate | 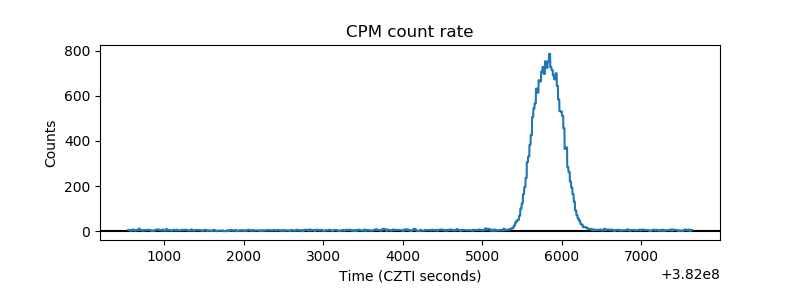 |
| CZT Counter | 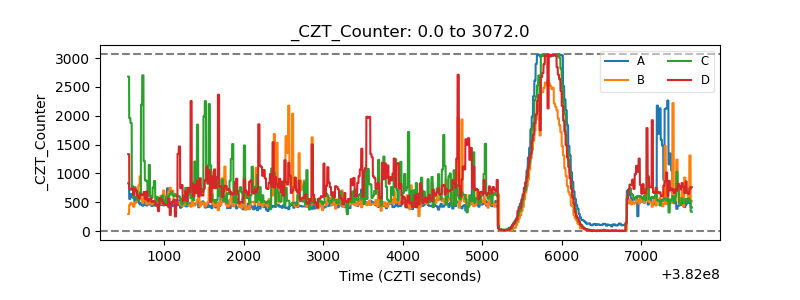 |
| +2.5 Volts monitor | 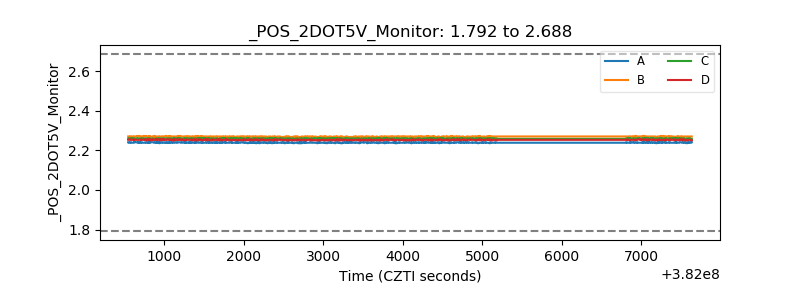 |
| +5 Volts monitor | 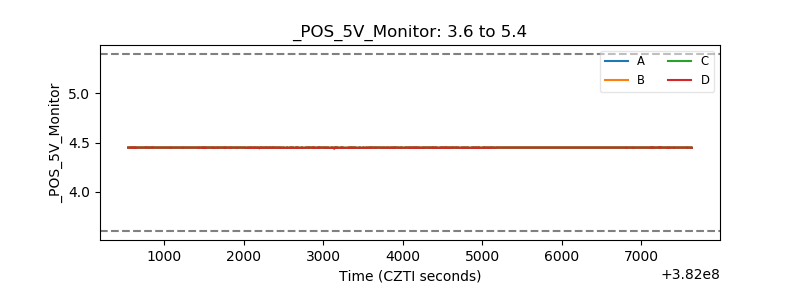 |
| _ROLL_ROT | 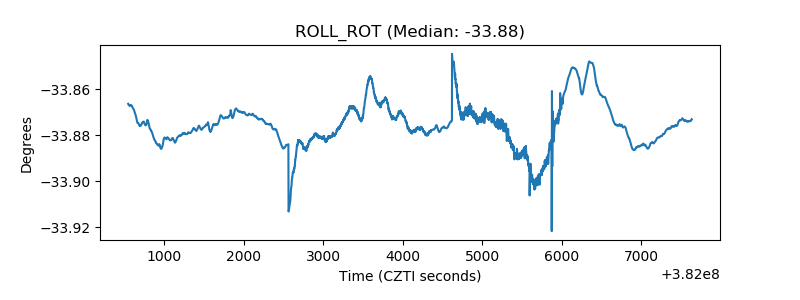 |
| _Roll_DEC | 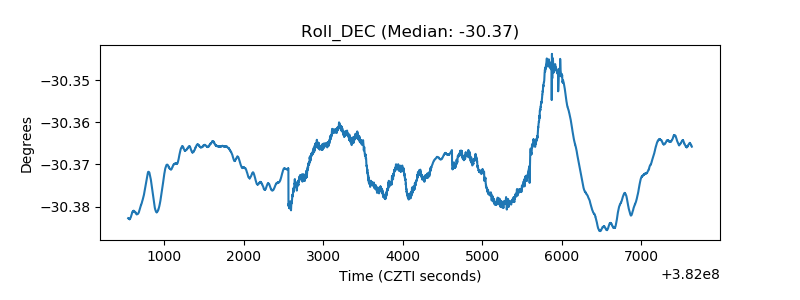 |
| _Roll_RA | 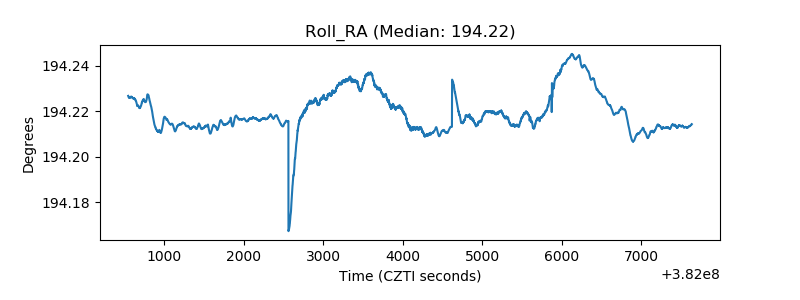 |
| Veto Counter | 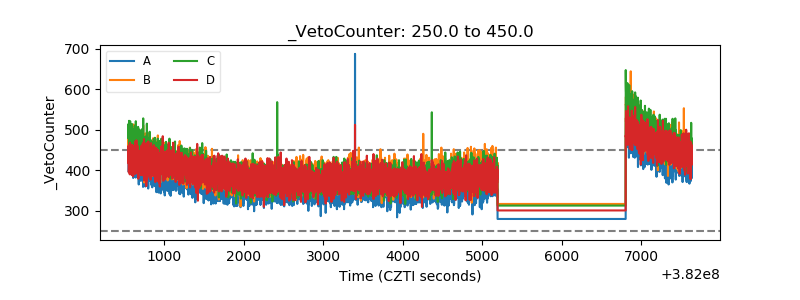 |