| Param | Original file | Final file |
|---|---|---|
| Filename | modeM0/AS1A05_108T02_9000004914_34413cztM0_level2.evt | modeM0/AS1A05_108T02_9000004914_34413cztM0_level2_quad_clean.evt |
| Size (bytes) | 492,955,200 | 77,385,600 |
| Size | 470.1 MB | 73.8 MB |
| Events in quadrant A | 2,921,333 | 480,826 |
| Events in quadrant B | 3,745,142 | 484,379 |
| Events in quadrant C | 3,296,979 | 482,945 |
| Events in quadrant D | 4,536,118 | 453,346 |
| Mode SS | |||
|---|---|---|---|
| Quadrant | BADHDUFLAG | Total packets | Discarded packets |
| A | 0 | 132 | 0 |
| B | 0 | 132 | 0 |
| C | 0 | 132 | 0 |
| D | 0 | 132 | 0 |
| Mode M9 | |||
|---|---|---|---|
| Quadrant | BADHDUFLAG | Total packets | Discarded packets |
| A | 0 | 27 | 0 |
| B | 0 | 27 | 0 |
| C | 0 | 27 | 0 |
| D | 0 | 27 | 0 |
| Mode M0 | |||
|---|---|---|---|
| Quadrant | BADHDUFLAG | Total packets | Discarded packets |
| A | 0 | 12872 | 3 |
| B | 0 | 15247 | 2 |
| C | 0 | 13484 | 2 |
| D | 0 | 17796 | 2 |
| Quadrant | Total seconds | Saturated seconds | Saturation percentage |
|---|---|---|---|
| A | 6326 | 8 | 0.126462% |
| B | 6326 | 272 | 4.299715% |
| C | 6326 | 18 | 0.284540% |
| D | 6326 | 161 | 2.545052% |
Noise dominated data is calculated using 1-second bins in cleaned event files. If a bin has >2000 counts, and if more than 50% of those come from <1% of pixels, then it is considered to be noise-dominated and hence unusable.
| Quadrant | # 1 sec bins | Bins with >0 counts | Bins with >2000 counts | High rate bins dominated by noise | Noise dominated (total time) | Noise dominated (detector-on time) | Marked lightcurve |
|---|---|---|---|---|---|---|---|
| A | 9011 | 6328 | 1 | 1 | 0.01% | 0.02% | 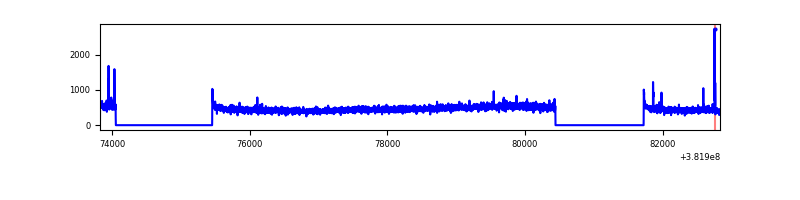 |
| B | 9011 | 6328 | 214 | 214 | 2.37% | 3.38% | 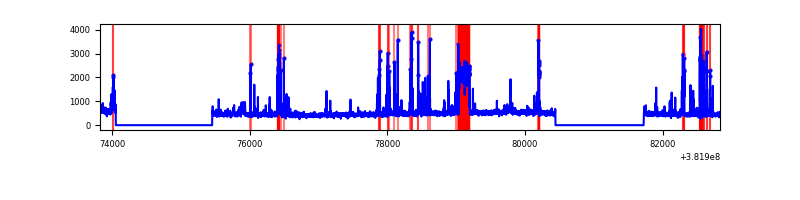 |
| C | 9011 | 6328 | 13 | 13 | 0.14% | 0.21% | 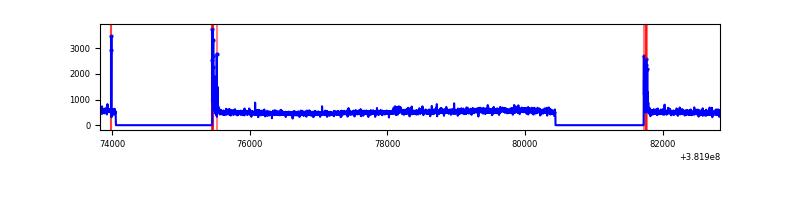 |
| D | 9011 | 6328 | 113 | 113 | 1.25% | 1.79% | 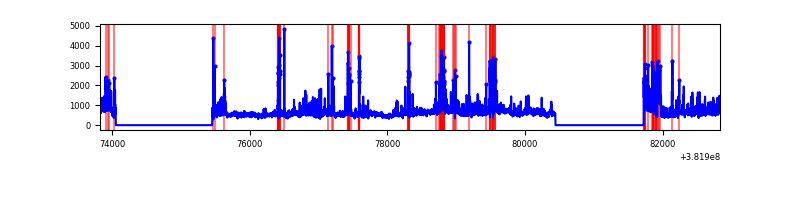 |
Top three noisy pixels from each quadrant. If the there are fewer than three noisy pixels in the level2.evt file, extra rows are filled as -1
| Pixel properties | Quadrant properties | ||||||
|---|---|---|---|---|---|---|---|
| Quadrant | DetID | PixID | Counts | Sigma | Mean | Median | Sigma |
| A | 10 | 83 | 35570 | 235.75 | 737 | 722 | 147.8 |
| A | 9 | 143 | 23947 | 157.12 | 737 | 722 | 147.8 |
| A | 13 | 254 | 11808 | 75.0 | 737 | 722 | 147.8 |
| B | 5 | 172 | 807466 | 5853.68 | 716 | 694 | 137.8 |
| B | 0 | 190 | 51877 | 371.37 | 716 | 694 | 137.8 |
| B | 5 | 255 | 37708 | 268.56 | 716 | 694 | 137.8 |
| C | 15 | 214 | 265787 | 1567.99 | 724 | 729 | 169.0 |
| C | 14 | 67 | 97806 | 574.27 | 724 | 729 | 169.0 |
| C | 0 | 10 | 90532 | 531.24 | 724 | 729 | 169.0 |
| D | 8 | 195 | 688923 | 3917.2 | 716 | 696 | 175.7 |
| D | 2 | 249 | 293672 | 1667.54 | 716 | 696 | 175.7 |
| D | 1 | 47 | 193174 | 1095.53 | 716 | 696 | 175.7 |
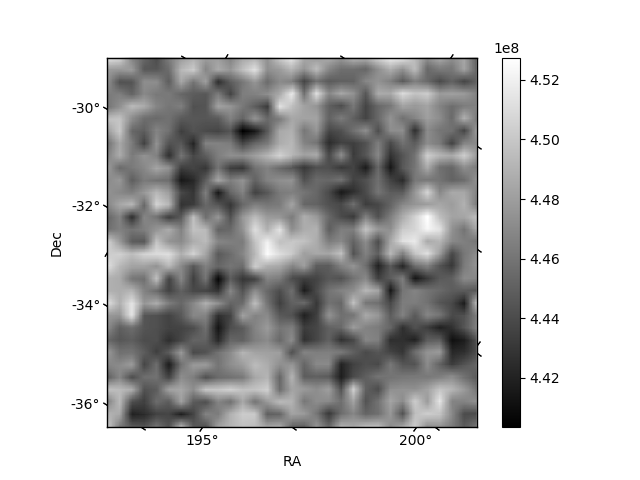
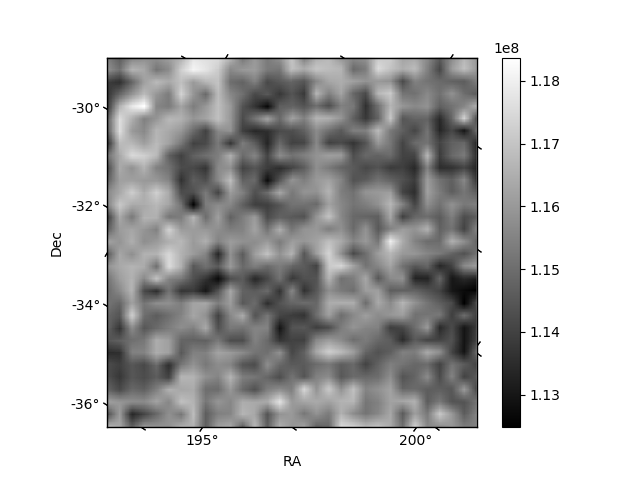
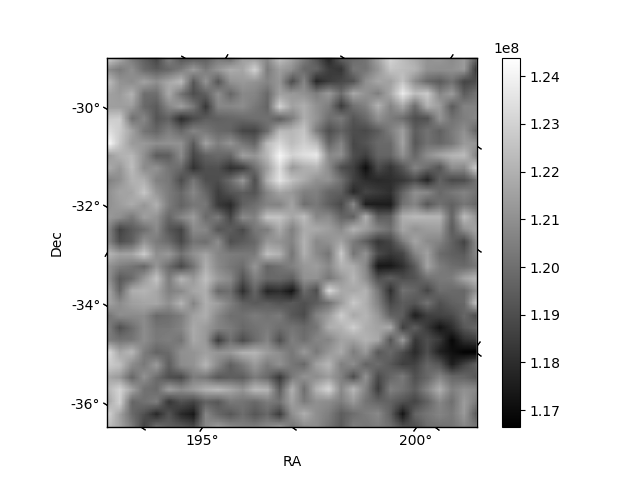
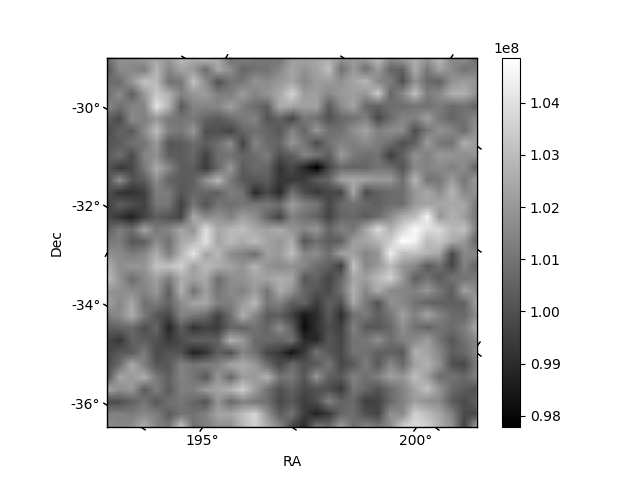
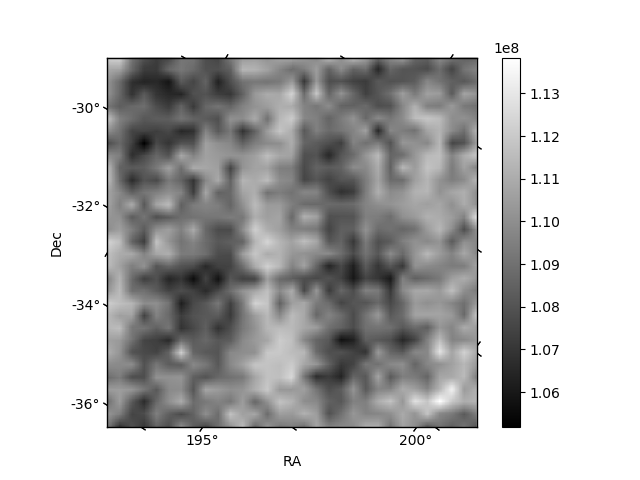
Histogram calculated using DETX and DETY for each event in the final _common_clean file
| Quadrant A | 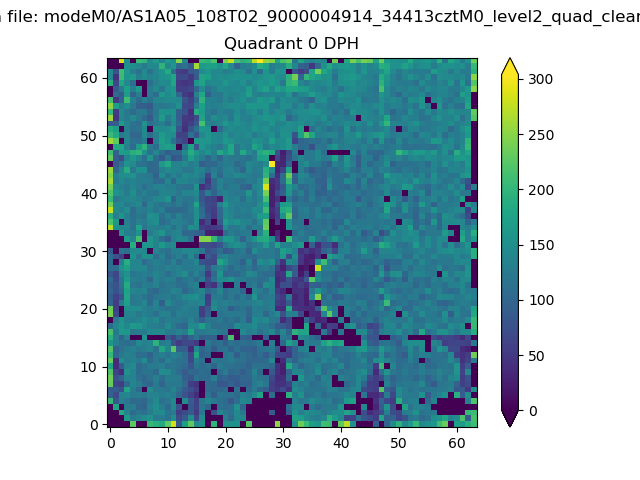 |
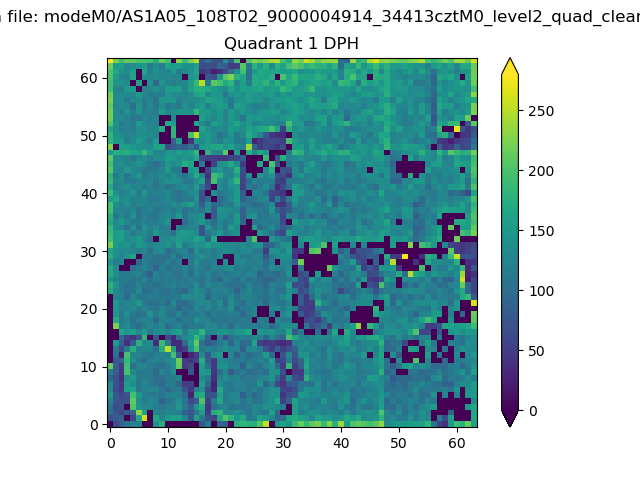 |
Quadrant B |
|---|---|---|---|
| Quadrant D | 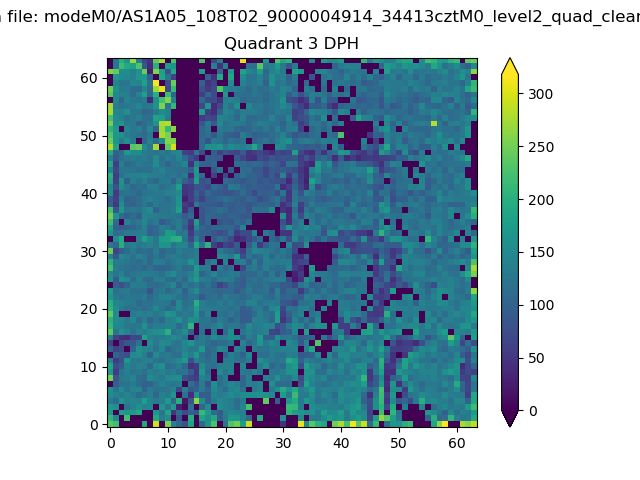 |
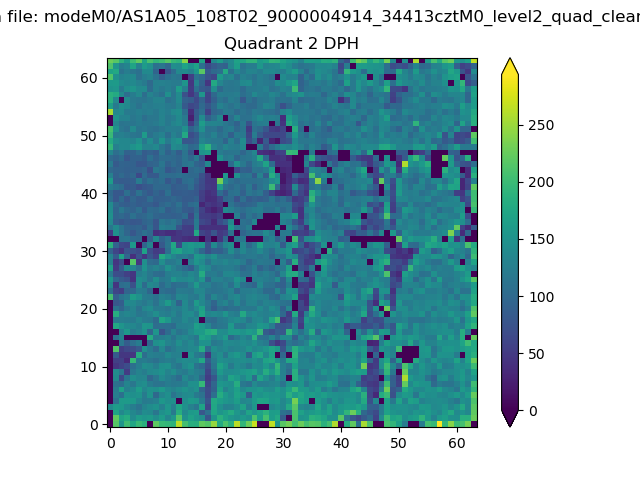 |
Quadrant C |
| Plot type | Count rate plots | Images |
|---|---|---|
| Comparison with Poisson distribution Blue bars denote a histogram of data divided into 1 sec bins. Red curve is a Poisson curve with rate = median count rate of data. |
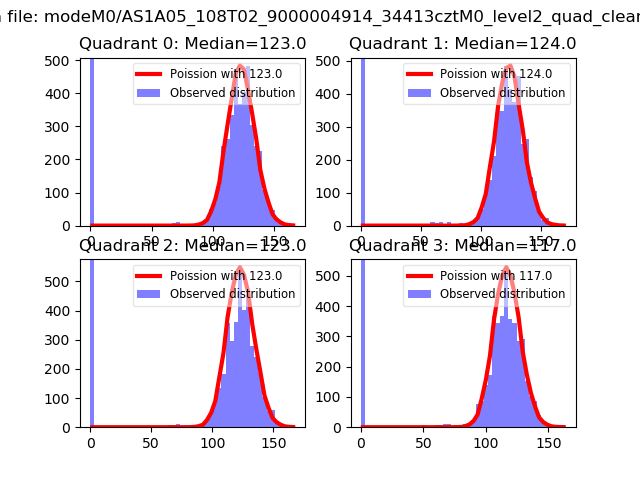 |
 |
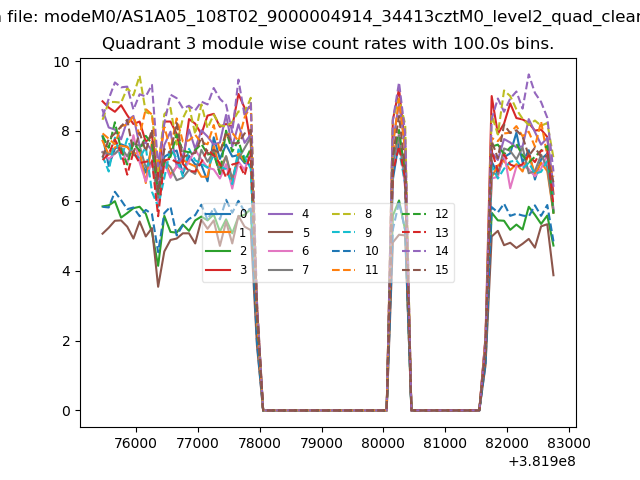
| Quadrant-wise count rates Data is divided into 100 sec bins |
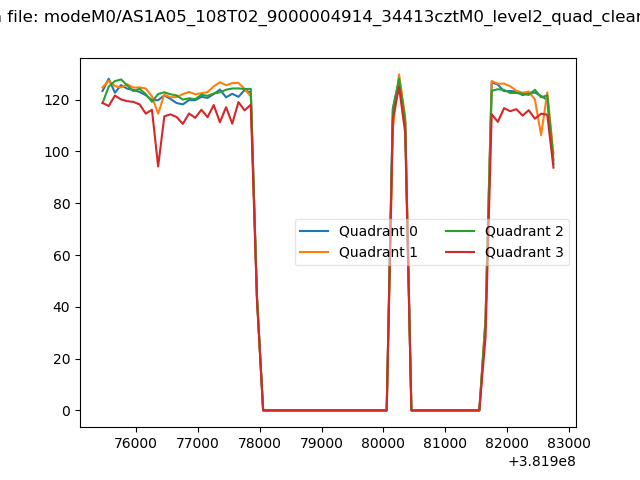 |
|
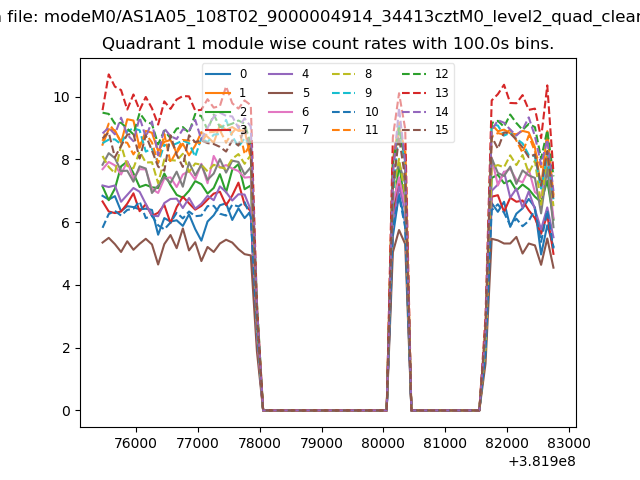
| Module-wise count rates for Quadrant A Data is divided into 100 sec bins |
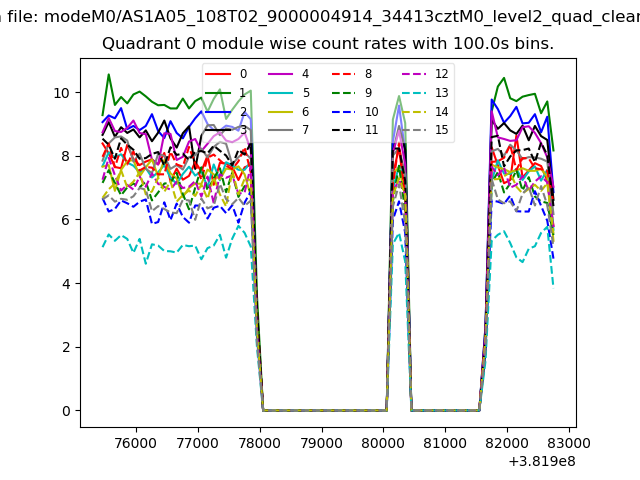 |
 |
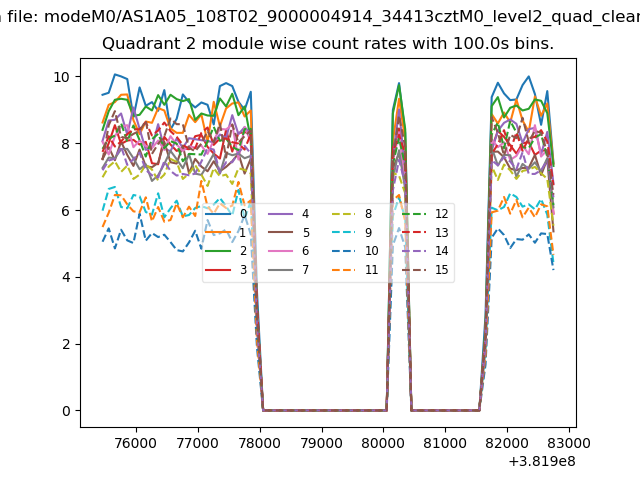
| Module-wise count rates for Quadrant B Data is divided into 100 sec bins |
 |
 |
| Module-wise count rates for Quadrant C Data is divided into 100 sec bins |
 |
 |
| Module-wise count rates for Quadrant D Data is divided into 100 sec bins |
 |
 |
| Parameter | Plot |
|---|---|
| CZT HV Monitor | 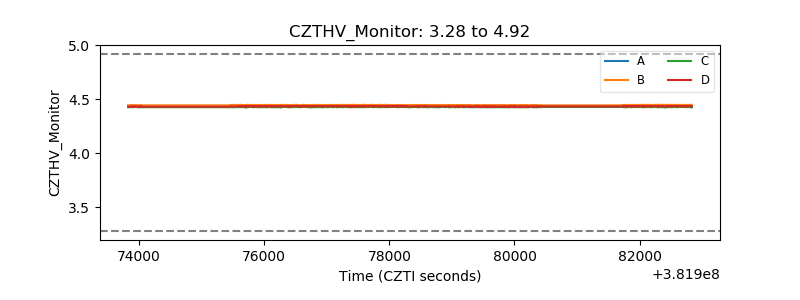 |
| D_VDD | 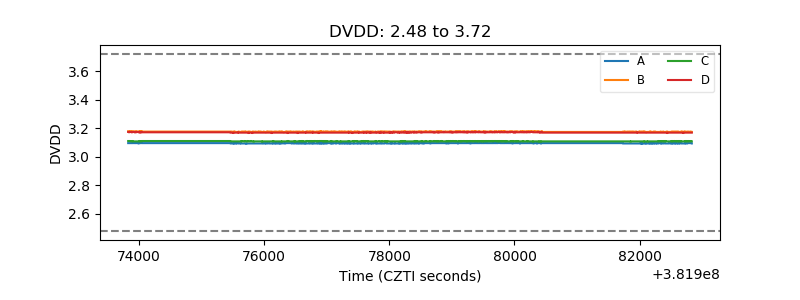 |
| Temperature 1 | 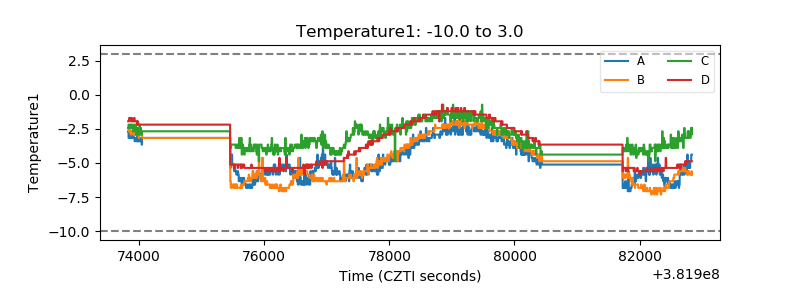 |
| Veto HV Monitor | 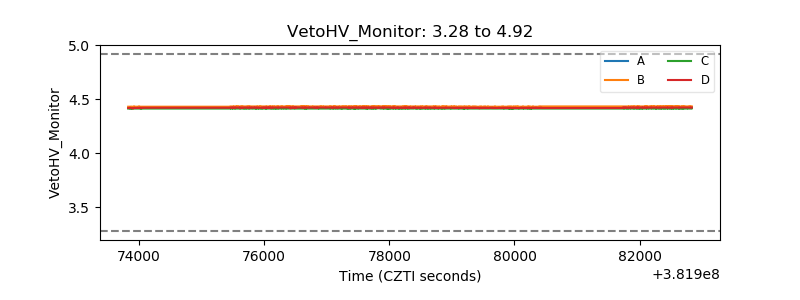 |
| Veto LLD | 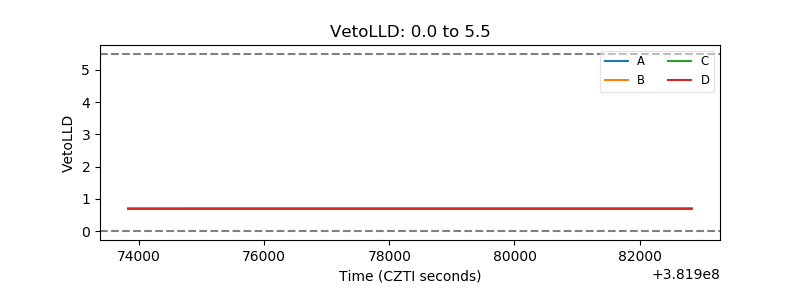 |
| Alpha Counter | 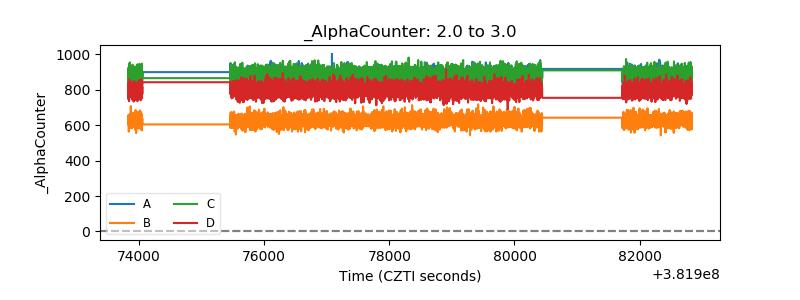 |
| _CPM_Rate | 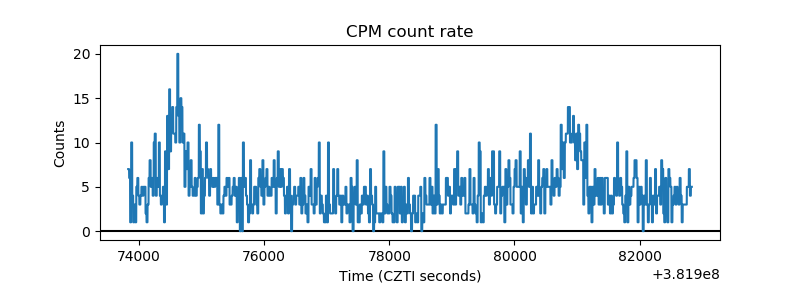 |
| CZT Counter | 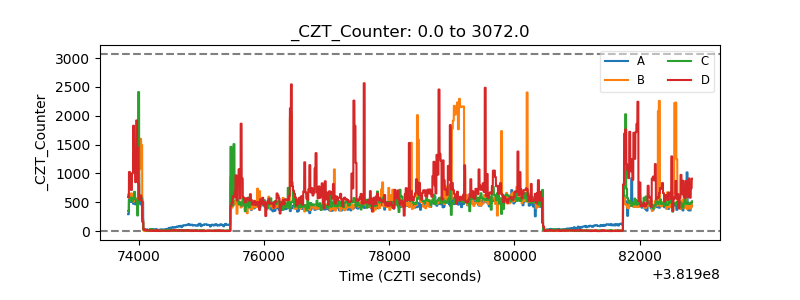 |
| +2.5 Volts monitor | 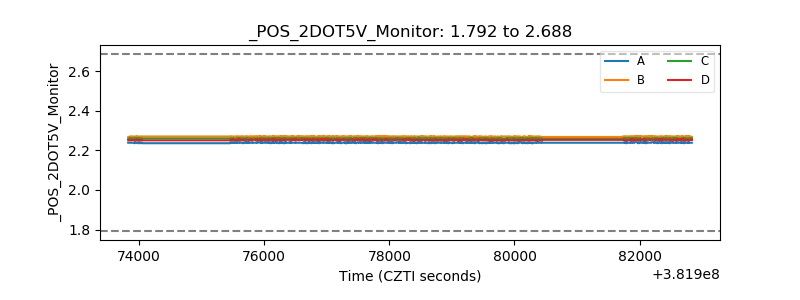 |
| +5 Volts monitor | 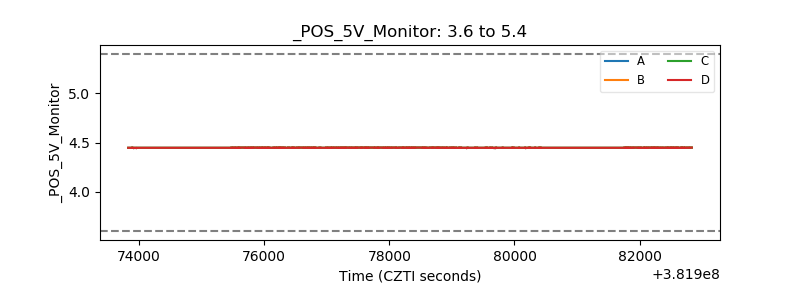 |
| _ROLL_ROT | 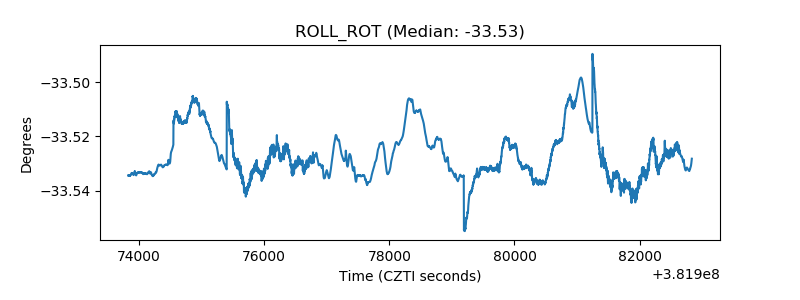 |
| _Roll_DEC | 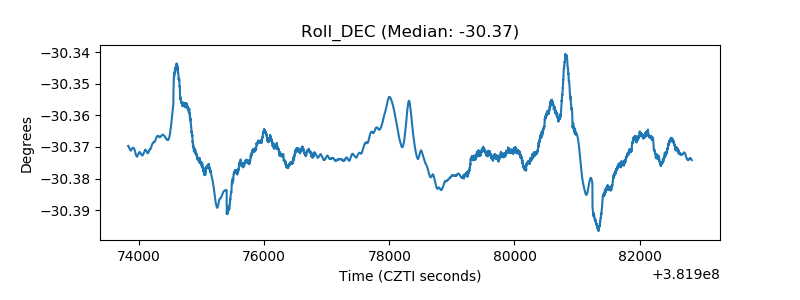 |
| _Roll_RA | 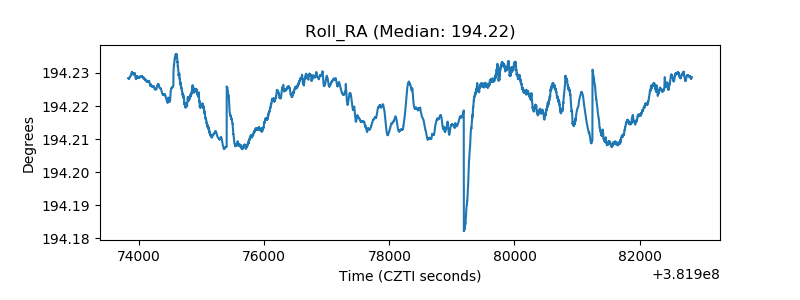 |
| Veto Counter | 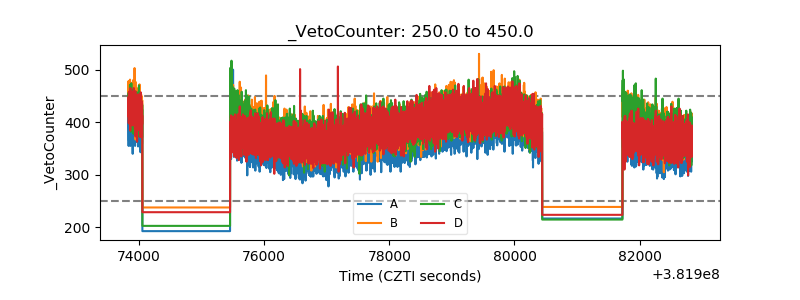 |