| Param | Original file | Final file |
|---|---|---|
| Filename | modeM0/AS1A05_108T02_9000004914_34412cztM0_level2.evt | modeM0/AS1A05_108T02_9000004914_34412cztM0_level2_quad_clean.evt |
| Size (bytes) | 479,522,880 | 81,440,640 |
| Size | 457.3 MB | 77.7 MB |
| Events in quadrant A | 2,877,538 | 513,341 |
| Events in quadrant B | 3,463,613 | 520,175 |
| Events in quadrant C | 3,341,287 | 513,654 |
| Events in quadrant D | 4,416,570 | 483,642 |
| Mode SS | |||
|---|---|---|---|
| Quadrant | BADHDUFLAG | Total packets | Discarded packets |
| A | 0 | 130 | 0 |
| B | 0 | 130 | 0 |
| C | 0 | 130 | 0 |
| D | 0 | 130 | 0 |
| Mode M9 | |||
|---|---|---|---|
| Quadrant | BADHDUFLAG | Total packets | Discarded packets |
| A | 0 | 31 | 0 |
| B | 0 | 31 | 0 |
| C | 0 | 31 | 0 |
| D | 0 | 31 | 0 |
| Mode M0 | |||
|---|---|---|---|
| Quadrant | BADHDUFLAG | Total packets | Discarded packets |
| A | 0 | 12697 | 3 |
| B | 0 | 14489 | 2 |
| C | 0 | 13735 | 2 |
| D | 0 | 17286 | 2 |
| Quadrant | Total seconds | Saturated seconds | Saturation percentage |
|---|---|---|---|
| A | 6231 | 10 | 0.160488% |
| B | 6231 | 138 | 2.214733% |
| C | 6231 | 30 | 0.481464% |
| D | 6231 | 206 | 3.306050% |
Noise dominated data is calculated using 1-second bins in cleaned event files. If a bin has >2000 counts, and if more than 50% of those come from <1% of pixels, then it is considered to be noise-dominated and hence unusable.
| Quadrant | # 1 sec bins | Bins with >0 counts | Bins with >2000 counts | High rate bins dominated by noise | Noise dominated (total time) | Noise dominated (detector-on time) | Marked lightcurve |
|---|---|---|---|---|---|---|---|
| A | 9337 | 6233 | 1 | 1 | 0.01% | 0.02% | 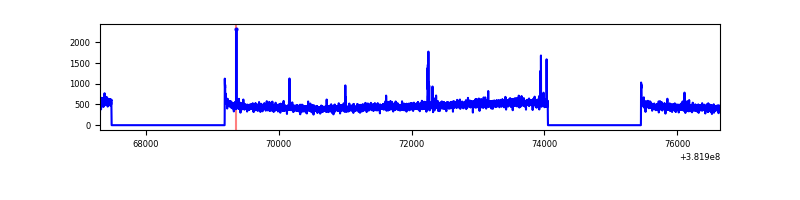 |
| B | 9337 | 6233 | 83 | 83 | 0.89% | 1.33% | 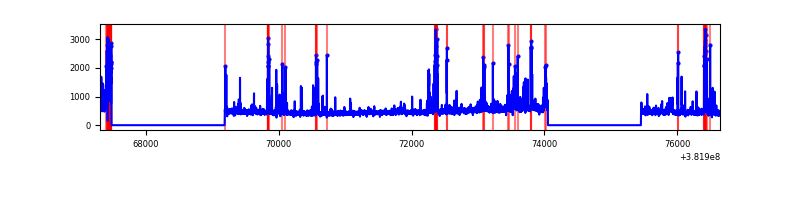 |
| C | 9337 | 6233 | 23 | 23 | 0.25% | 0.37% | 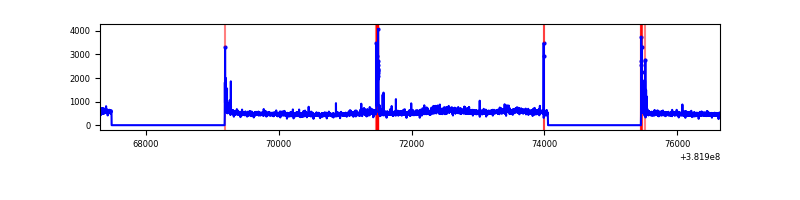 |
| D | 9337 | 6233 | 141 | 141 | 1.51% | 2.26% | 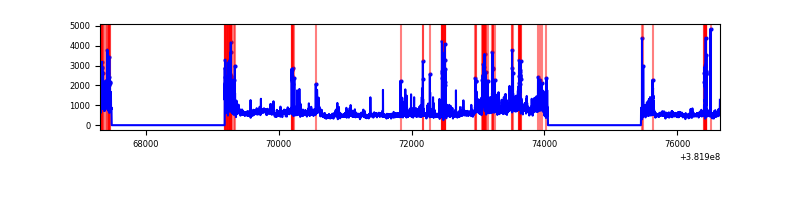 |
Top three noisy pixels from each quadrant. If the there are fewer than three noisy pixels in the level2.evt file, extra rows are filled as -1
| Pixel properties | Quadrant properties | ||||||
|---|---|---|---|---|---|---|---|
| Quadrant | DetID | PixID | Counts | Sigma | Mean | Median | Sigma |
| A | 10 | 83 | 35409 | 237.64 | 725 | 709 | 146.0 |
| A | 9 | 143 | 23521 | 156.22 | 725 | 709 | 146.0 |
| A | 13 | 6 | 14739 | 96.08 | 725 | 709 | 146.0 |
| B | 5 | 172 | 510690 | 3726.44 | 718 | 700 | 136.9 |
| B | 5 | 255 | 51345 | 370.06 | 718 | 700 | 136.9 |
| B | 0 | 190 | 45441 | 326.92 | 718 | 700 | 136.9 |
| C | 15 | 214 | 261040 | 1575.6 | 712 | 718 | 165.2 |
| C | 14 | 67 | 142702 | 859.36 | 712 | 718 | 165.2 |
| C | 0 | 10 | 81422 | 488.46 | 712 | 718 | 165.2 |
| D | 8 | 195 | 700035 | 4080.39 | 699 | 678 | 171.4 |
| D | 2 | 249 | 334114 | 1945.43 | 699 | 678 | 171.4 |
| D | 1 | 47 | 275247 | 1601.97 | 699 | 678 | 171.4 |
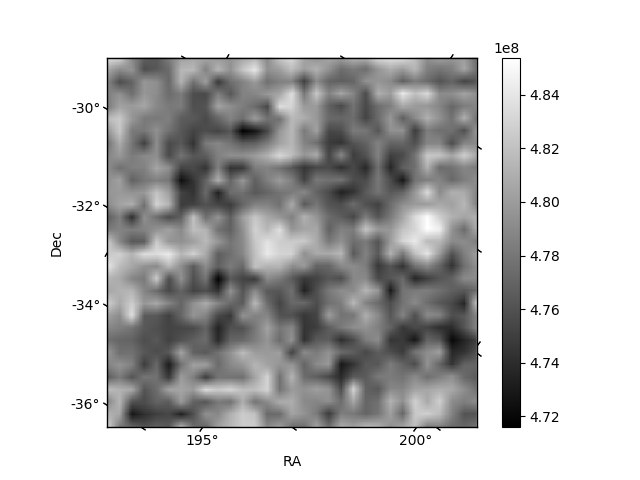
Histogram calculated using DETX and DETY for each event in the final _common_clean file
| Quadrant A | 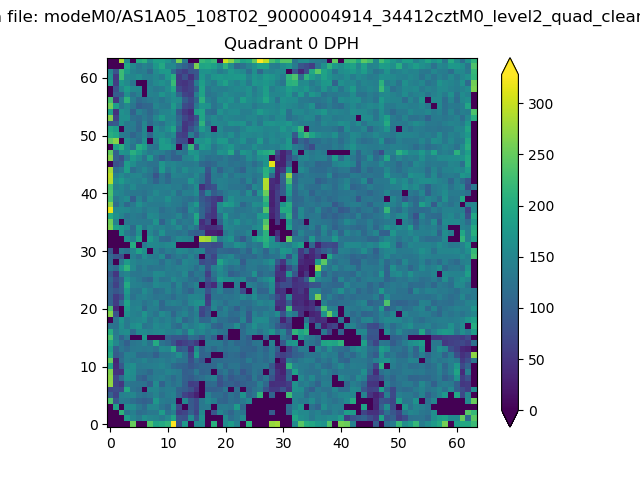 |
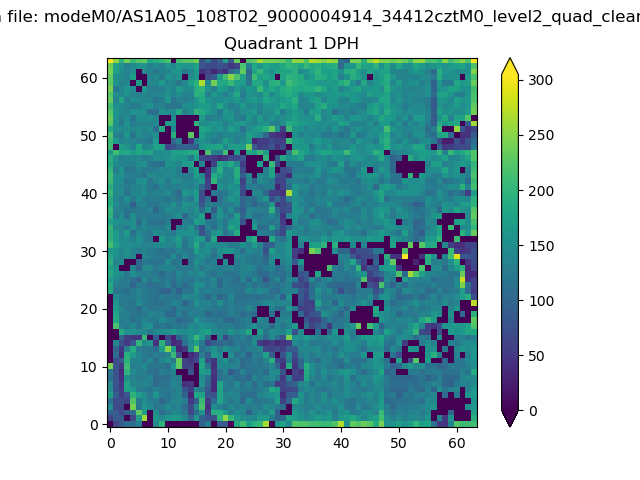 |
Quadrant B |
|---|---|---|---|
| Quadrant D | 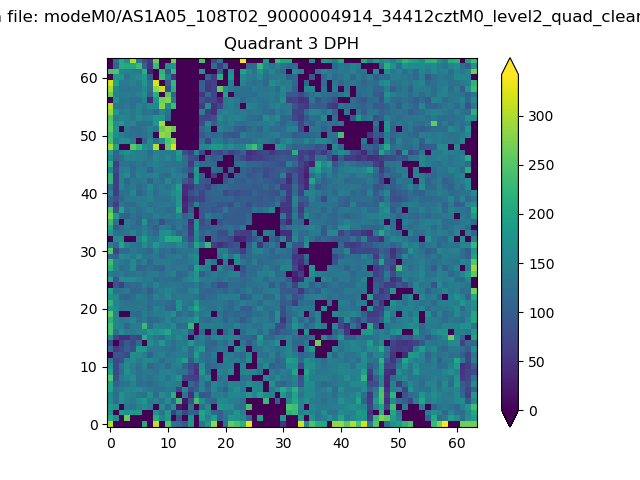 |
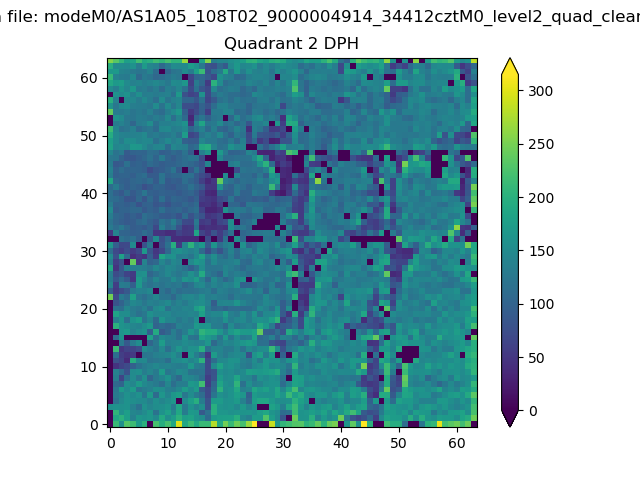 |
Quadrant C |
| Plot type | Count rate plots | Images |
|---|---|---|
| Comparison with Poisson distribution Blue bars denote a histogram of data divided into 1 sec bins. Red curve is a Poisson curve with rate = median count rate of data. |
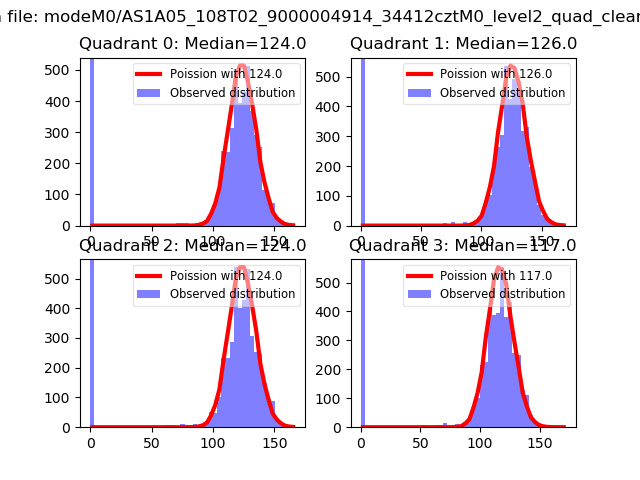 |
 |
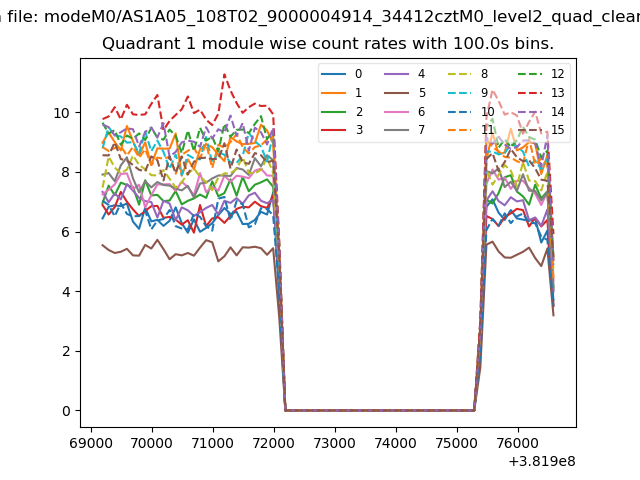
| Quadrant-wise count rates Data is divided into 100 sec bins |
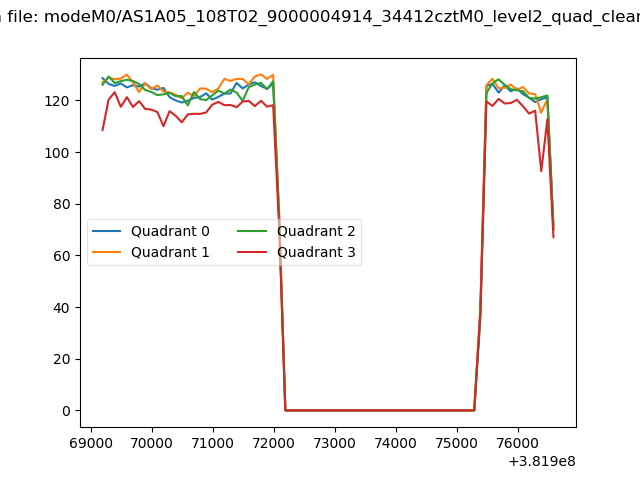 |
|
| Module-wise count rates for Quadrant A Data is divided into 100 sec bins |
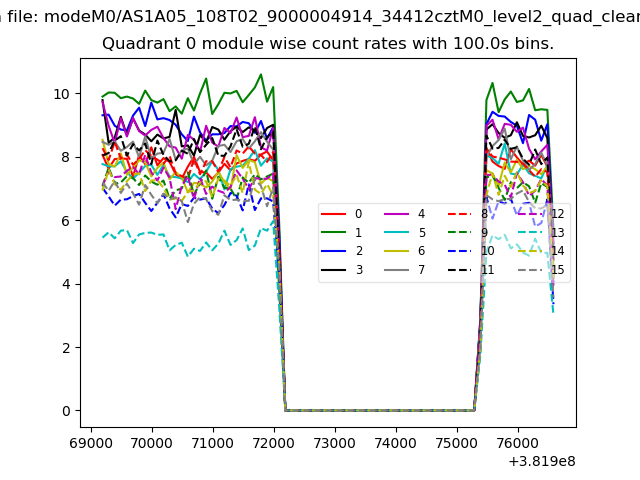 |
 |
| Module-wise count rates for Quadrant B Data is divided into 100 sec bins |
 |
 |
| Module-wise count rates for Quadrant C Data is divided into 100 sec bins |
 |
 |
| Module-wise count rates for Quadrant D Data is divided into 100 sec bins |
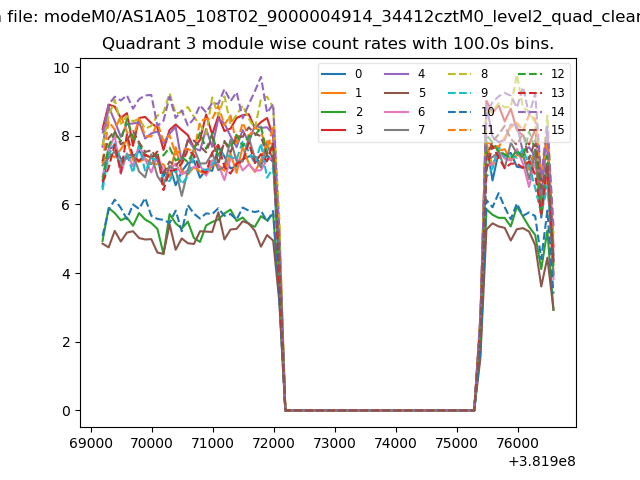 |
 |
| Parameter | Plot |
|---|---|
| CZT HV Monitor | 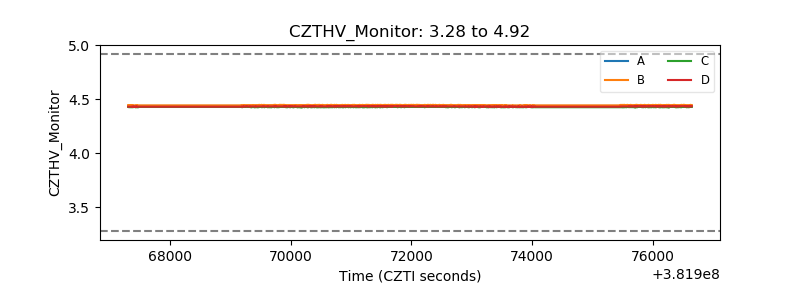 |
| D_VDD | 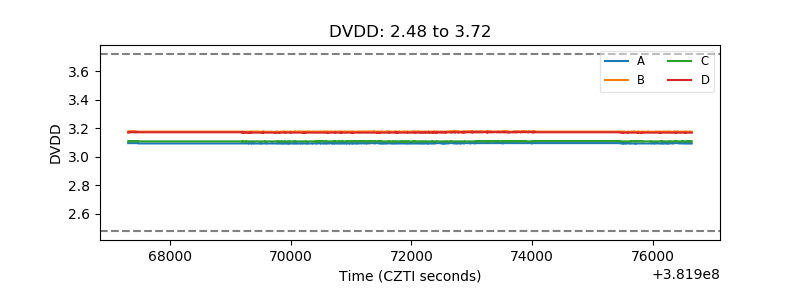 |
| Temperature 1 | 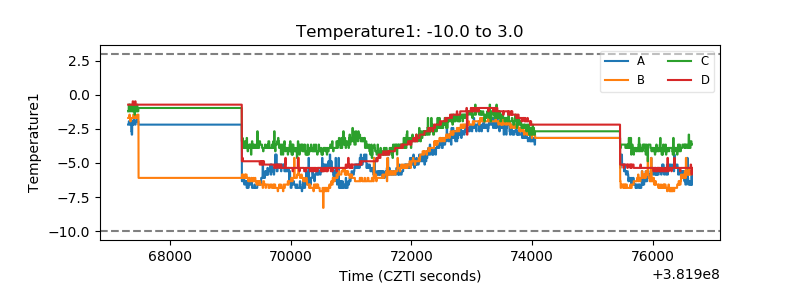 |
| Veto HV Monitor | 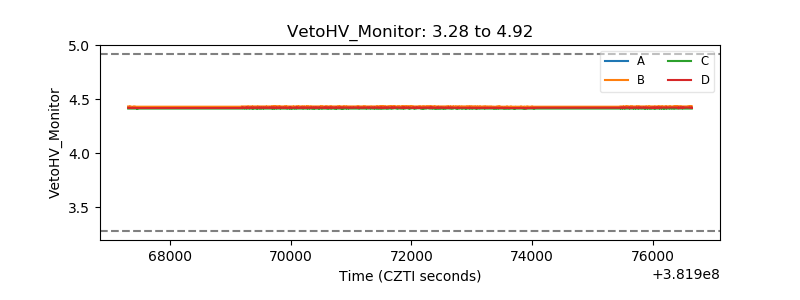 |
| Veto LLD | 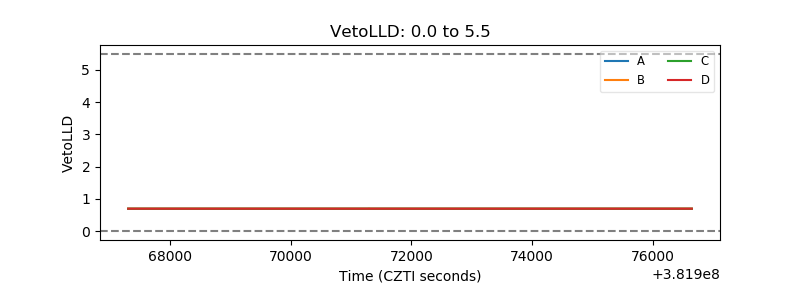 |
| Alpha Counter | 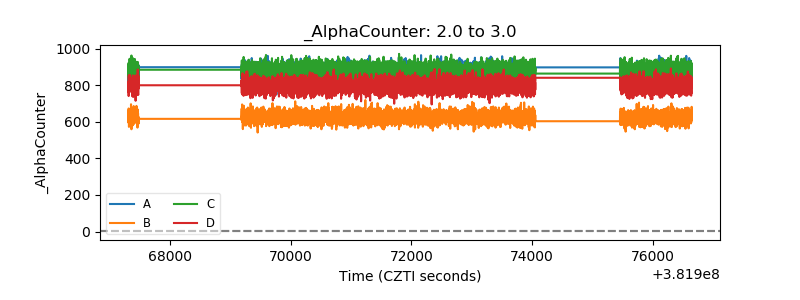 |
| _CPM_Rate | 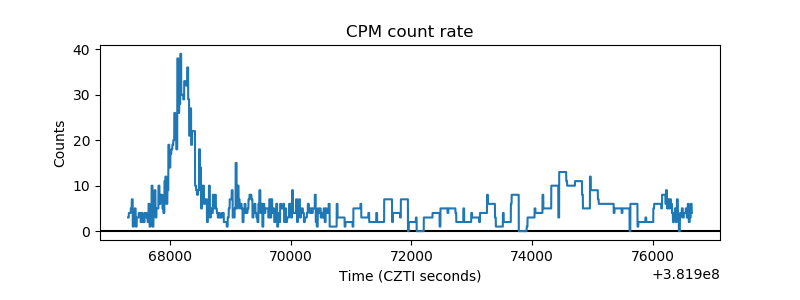 |
| CZT Counter | 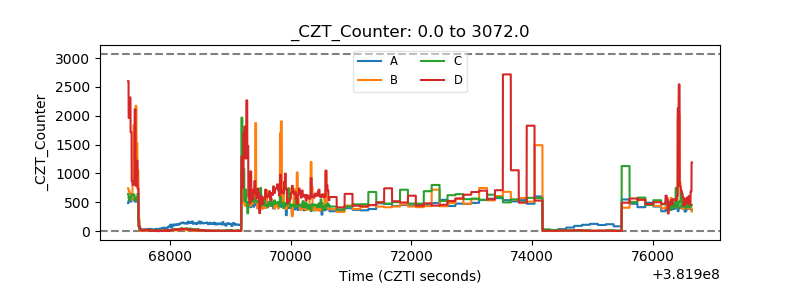 |
| +2.5 Volts monitor | 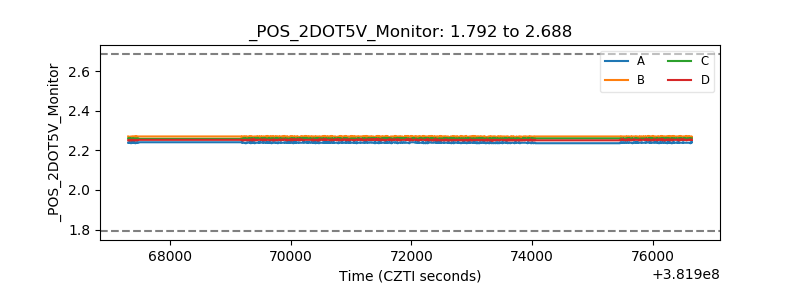 |
| +5 Volts monitor | 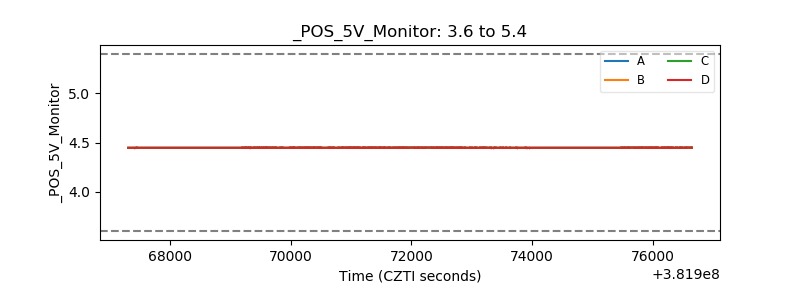 |
| _ROLL_ROT | 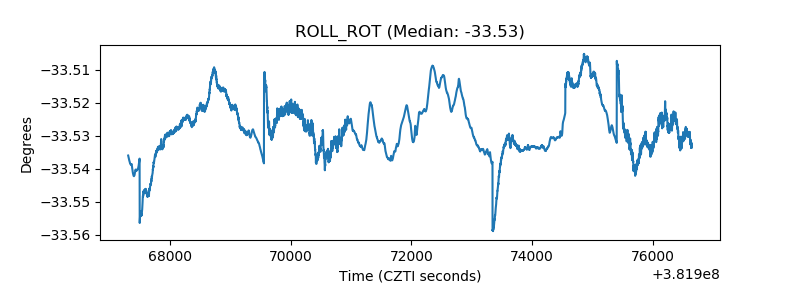 |
| _Roll_DEC | 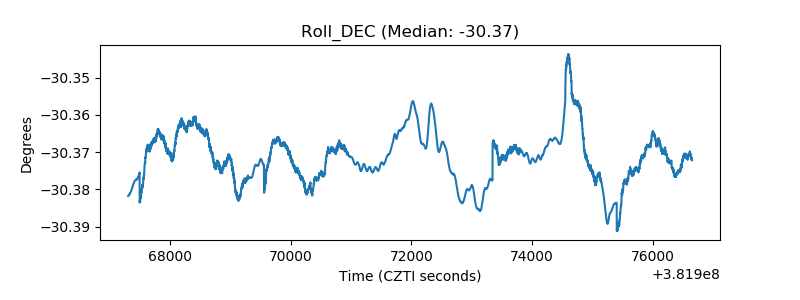 |
| _Roll_RA | 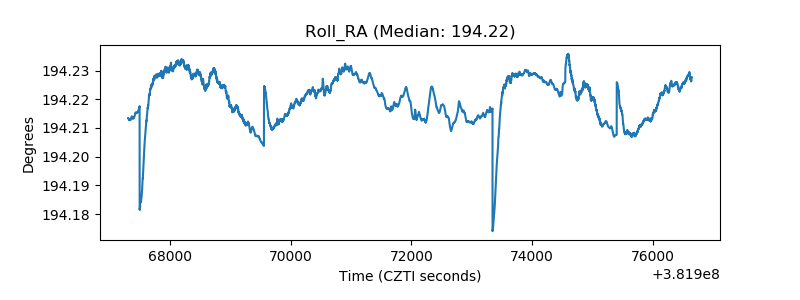 |
| Veto Counter | 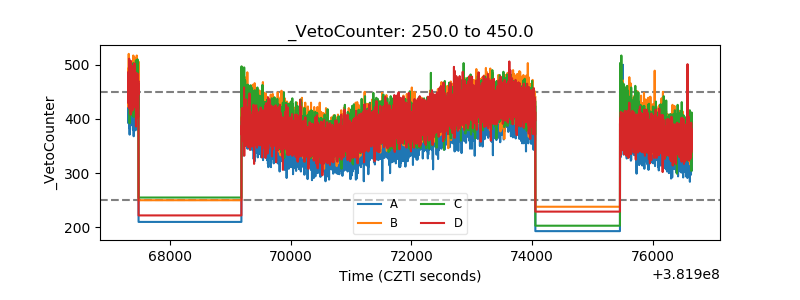 |