| Param | Original file | Final file |
|---|---|---|
| Filename | modeM0/AS1A05_108T02_9000004914_34411cztM0_level2.evt | modeM0/AS1A05_108T02_9000004914_34411cztM0_level2_quad_clean.evt |
| Size (bytes) | 454,000,320 | 82,339,200 |
| Size | 433.0 MB | 78.5 MB |
| Events in quadrant A | 2,770,920 | 526,902 |
| Events in quadrant B | 3,407,326 | 534,825 |
| Events in quadrant C | 3,026,100 | 529,442 |
| Events in quadrant D | 4,152,795 | 498,586 |
| Mode SS | |||
|---|---|---|---|
| Quadrant | BADHDUFLAG | Total packets | Discarded packets |
| A | 0 | 120 | 0 |
| B | 0 | 120 | 0 |
| C | 0 | 120 | 0 |
| D | 0 | 120 | 0 |
| Mode M9 | |||
|---|---|---|---|
| Quadrant | BADHDUFLAG | Total packets | Discarded packets |
| A | 0 | 37 | 0 |
| B | 0 | 37 | 0 |
| C | 0 | 37 | 0 |
| D | 0 | 37 | 0 |
| Mode M0 | |||
|---|---|---|---|
| Quadrant | BADHDUFLAG | Total packets | Discarded packets |
| A | 0 | 11841 | 3 |
| B | 0 | 13987 | 2 |
| C | 0 | 12346 | 2 |
| D | 0 | 16502 | 2 |
| Quadrant | Total seconds | Saturated seconds | Saturation percentage |
|---|---|---|---|
| A | 5773 | 13 | 0.225186% |
| B | 5773 | 235 | 4.070674% |
| C | 5773 | 24 | 0.415728% |
| D | 5773 | 245 | 4.243894% |
Noise dominated data is calculated using 1-second bins in cleaned event files. If a bin has >2000 counts, and if more than 50% of those come from <1% of pixels, then it is considered to be noise-dominated and hence unusable.
| Quadrant | # 1 sec bins | Bins with >0 counts | Bins with >2000 counts | High rate bins dominated by noise | Noise dominated (total time) | Noise dominated (detector-on time) | Marked lightcurve |
|---|---|---|---|---|---|---|---|
| A | 9481 | 5775 | 5 | 5 | 0.05% | 0.09% | 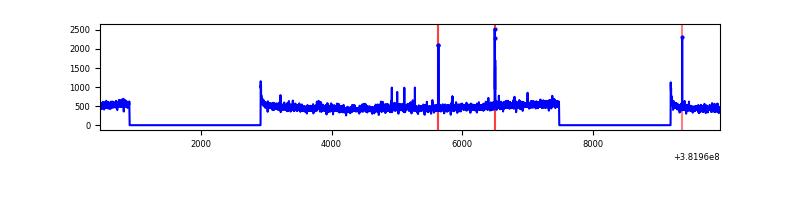 |
| B | 9481 | 5775 | 120 | 120 | 1.27% | 2.08% | 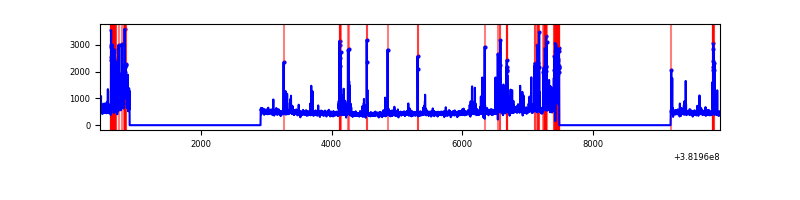 |
| C | 9481 | 5775 | 16 | 16 | 0.17% | 0.28% | 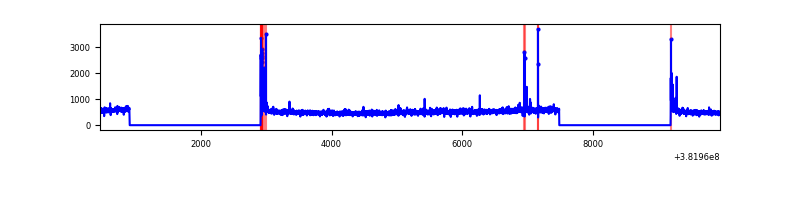 |
| D | 9481 | 5775 | 177 | 177 | 1.87% | 3.06% | 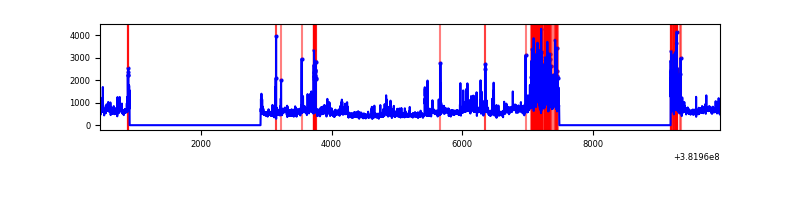 |
Top three noisy pixels from each quadrant. If the there are fewer than three noisy pixels in the level2.evt file, extra rows are filled as -1
| Pixel properties | Quadrant properties | ||||||
|---|---|---|---|---|---|---|---|
| Quadrant | DetID | PixID | Counts | Sigma | Mean | Median | Sigma |
| A | 0 | 247 | 51744 | 372.68 | 681 | 667 | 137.1 |
| A | 10 | 83 | 34676 | 248.15 | 681 | 667 | 137.1 |
| A | 9 | 143 | 29195 | 208.15 | 681 | 667 | 137.1 |
| B | 5 | 172 | 573483 | 4464.63 | 673 | 656 | 128.3 |
| B | 0 | 190 | 75563 | 583.82 | 673 | 656 | 128.3 |
| B | 4 | 232 | 43492 | 333.86 | 673 | 656 | 128.3 |
| C | 15 | 214 | 241565 | 1553.87 | 671 | 679 | 155.0 |
| C | 0 | 10 | 77602 | 496.2 | 671 | 679 | 155.0 |
| C | 14 | 67 | 57782 | 368.35 | 671 | 679 | 155.0 |
| D | 8 | 195 | 634561 | 3932.28 | 655 | 637 | 161.2 |
| D | 1 | 47 | 310913 | 1924.67 | 655 | 637 | 161.2 |
| D | 2 | 249 | 294179 | 1820.87 | 655 | 637 | 161.2 |
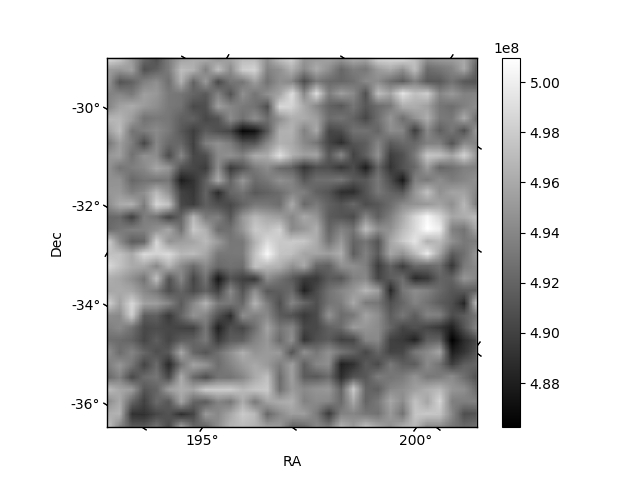
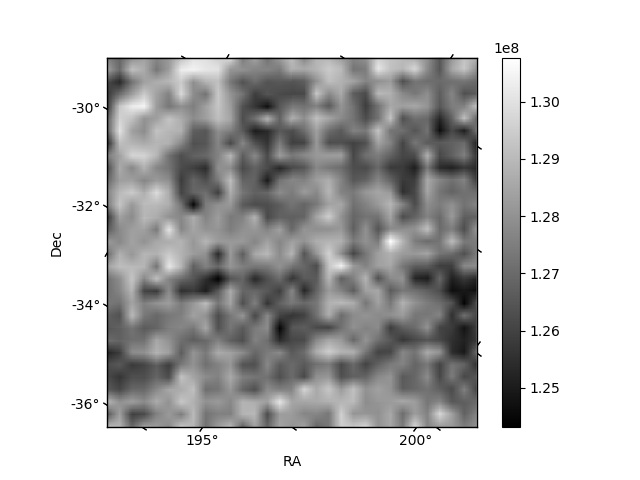
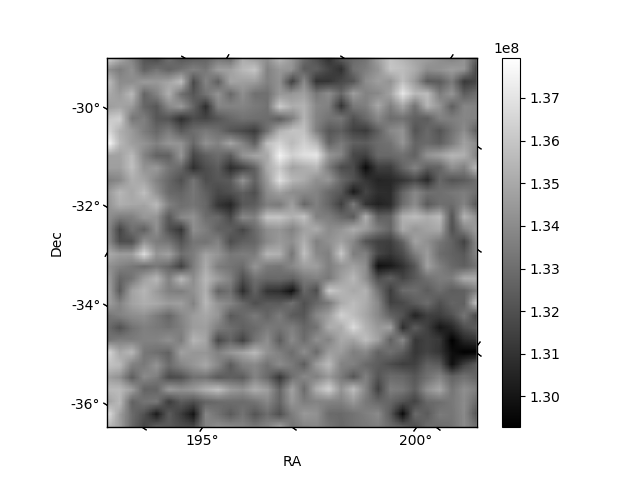
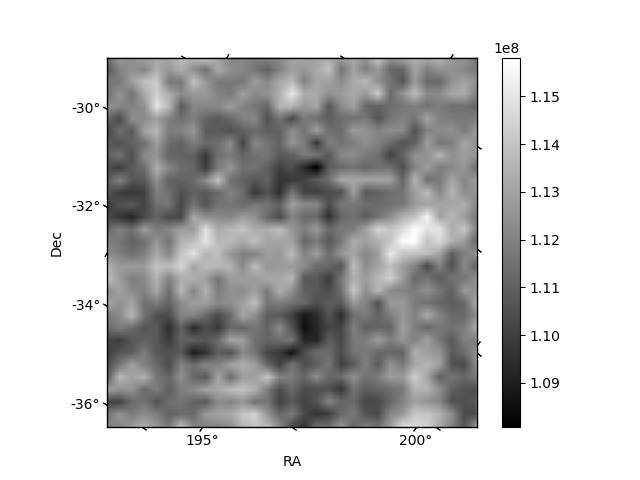
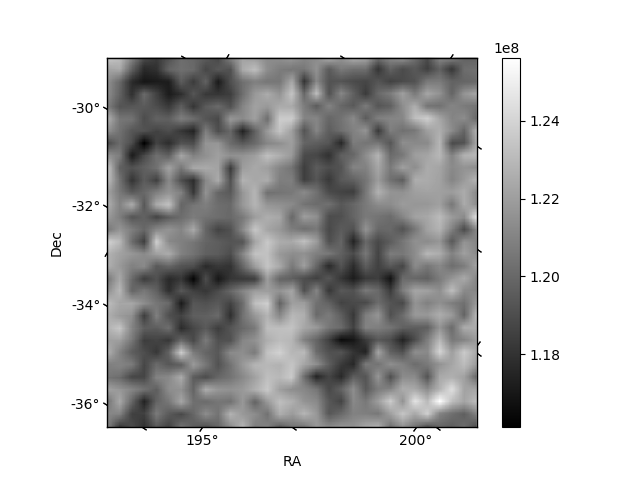
Histogram calculated using DETX and DETY for each event in the final _common_clean file
| Quadrant A | 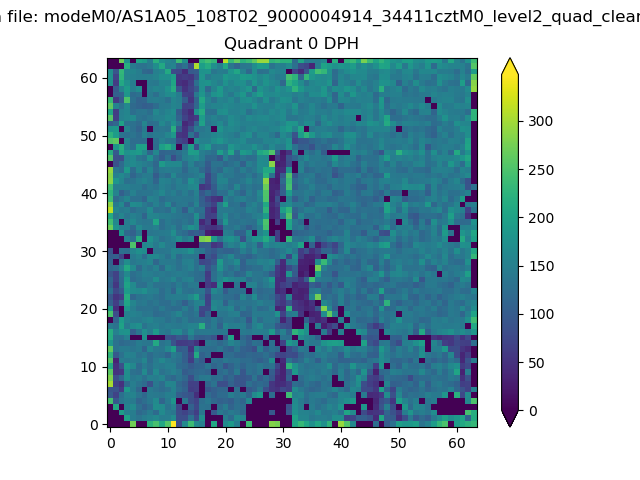 |
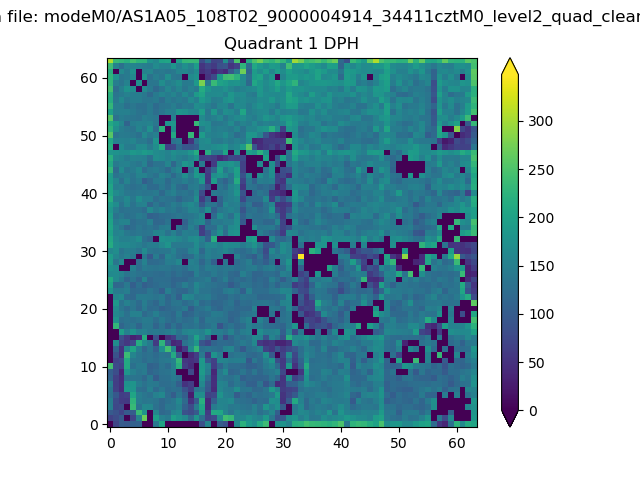 |
Quadrant B |
|---|---|---|---|
| Quadrant D | 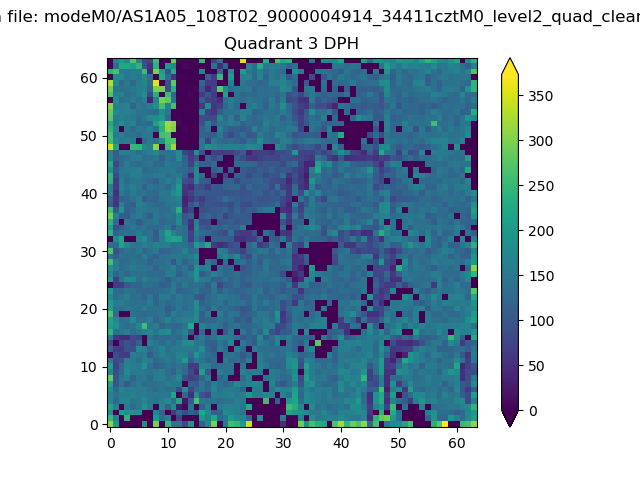 |
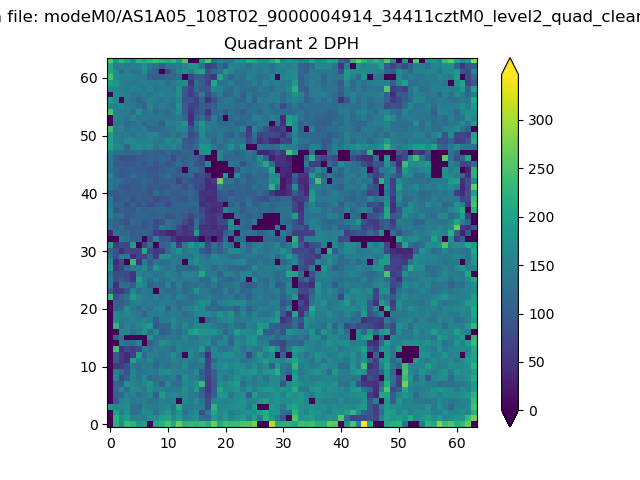 |
Quadrant C |
| Plot type | Count rate plots | Images |
|---|---|---|
| Comparison with Poisson distribution Blue bars denote a histogram of data divided into 1 sec bins. Red curve is a Poisson curve with rate = median count rate of data. |
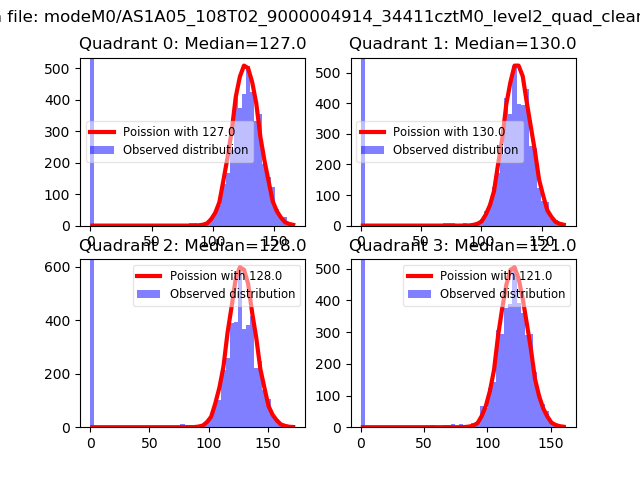 |
 |
| Quadrant-wise count rates Data is divided into 100 sec bins |
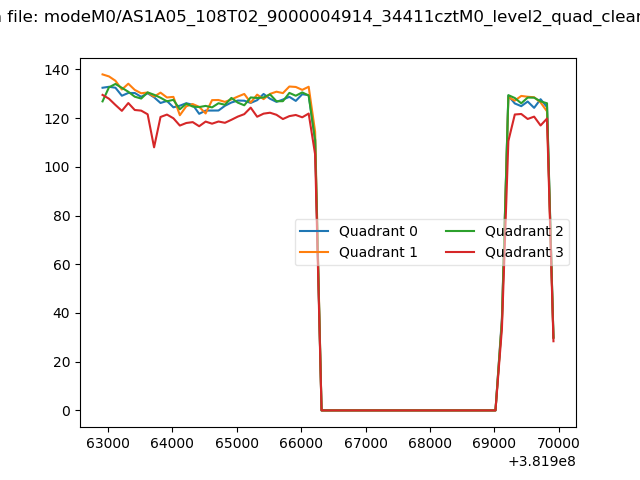 |
|
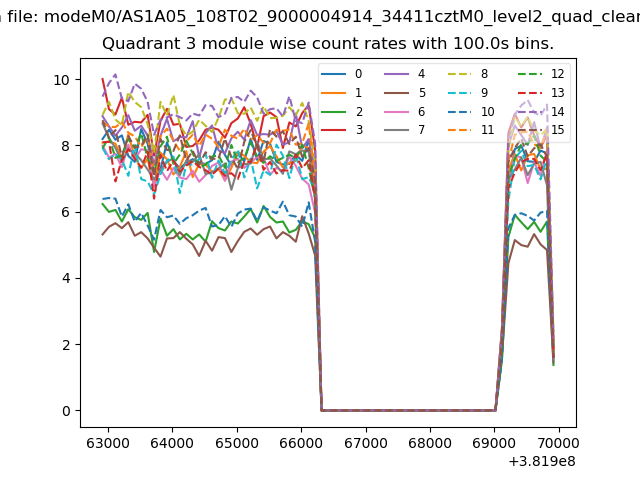
| Module-wise count rates for Quadrant A Data is divided into 100 sec bins |
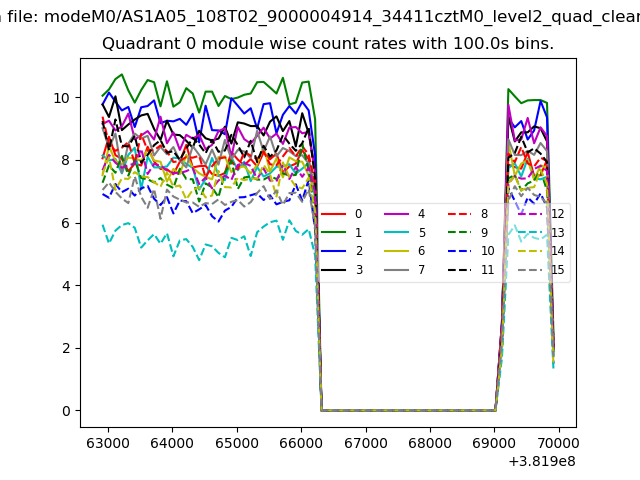 |
 |
| Module-wise count rates for Quadrant B Data is divided into 100 sec bins |
 |
 |
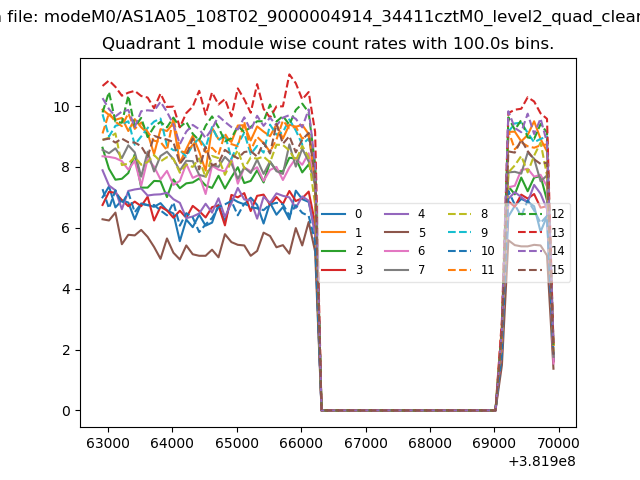
| Module-wise count rates for Quadrant C Data is divided into 100 sec bins |
 |
 |
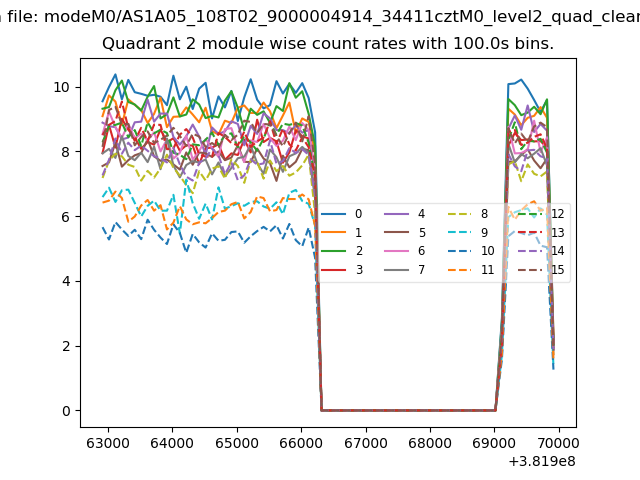
| Module-wise count rates for Quadrant D Data is divided into 100 sec bins |
 |
 |
| Parameter | Plot |
|---|---|
| CZT HV Monitor | 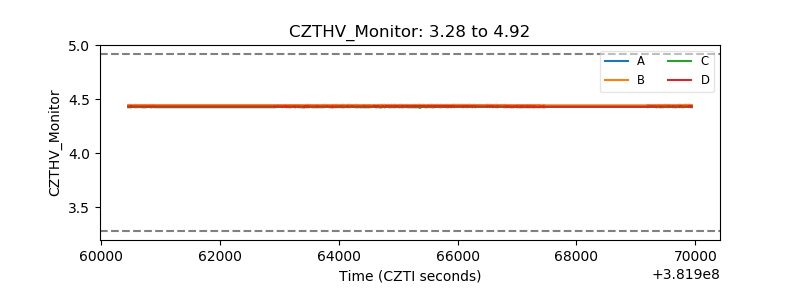 |
| D_VDD | 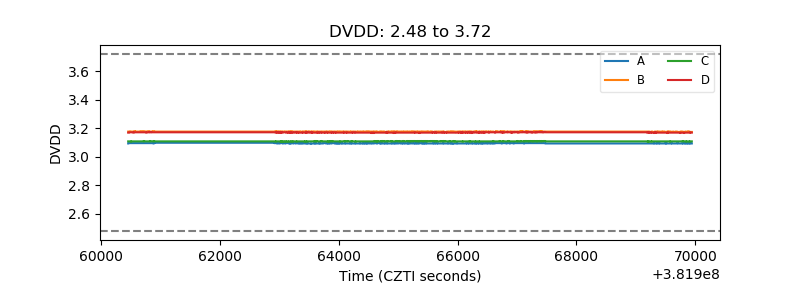 |
| Temperature 1 | 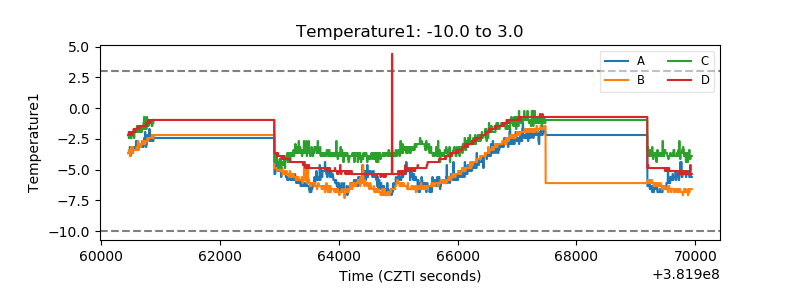 |
| Veto HV Monitor | 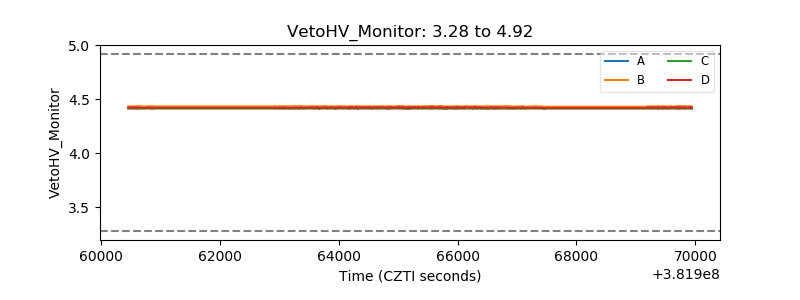 |
| Veto LLD | 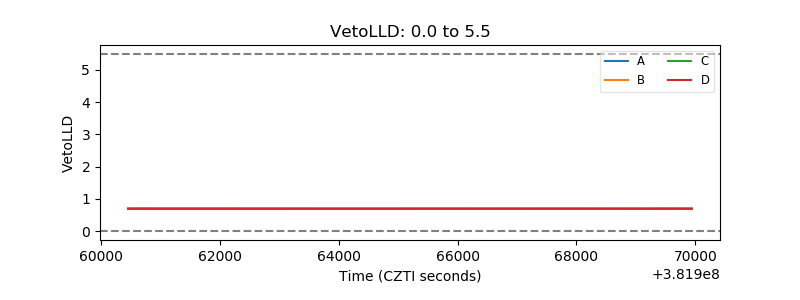 |
| Alpha Counter | 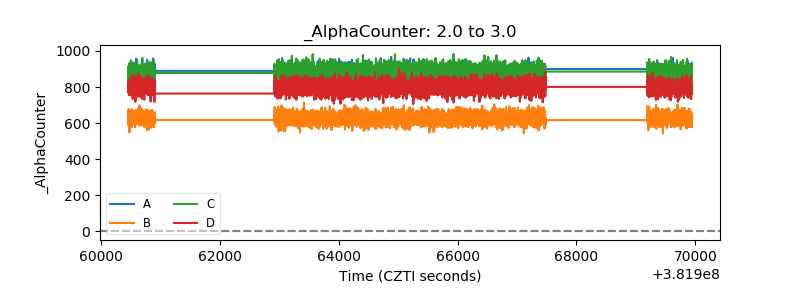 |
| _CPM_Rate | 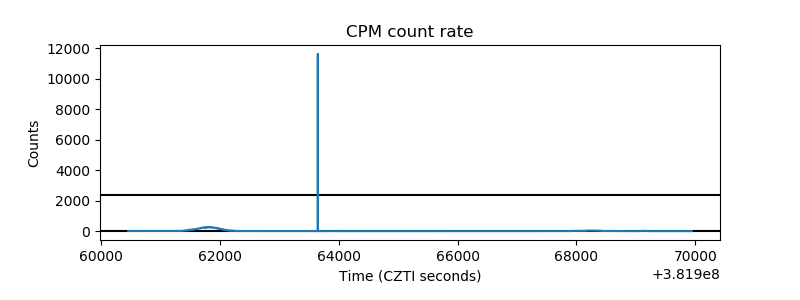 |
| CZT Counter | 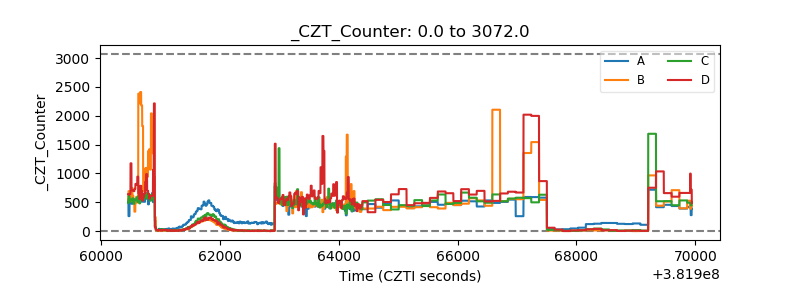 |
| +2.5 Volts monitor | 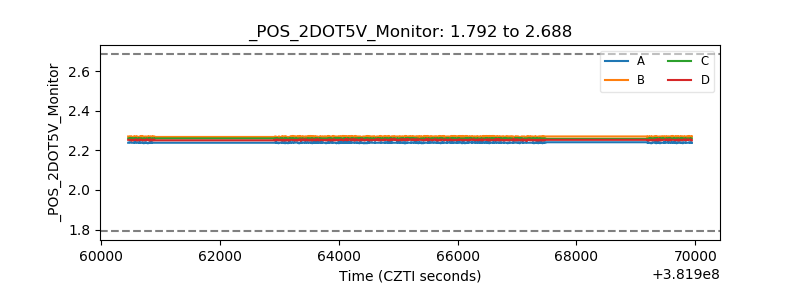 |
| +5 Volts monitor | 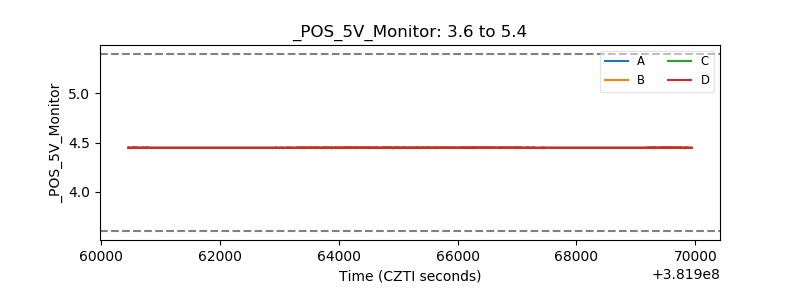 |
| _ROLL_ROT |  |
| _Roll_DEC | 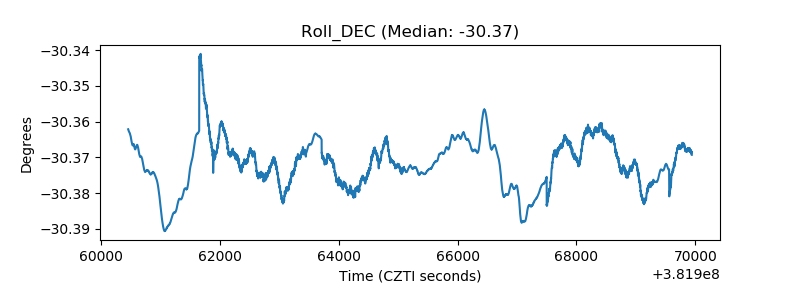 |
| _Roll_RA | 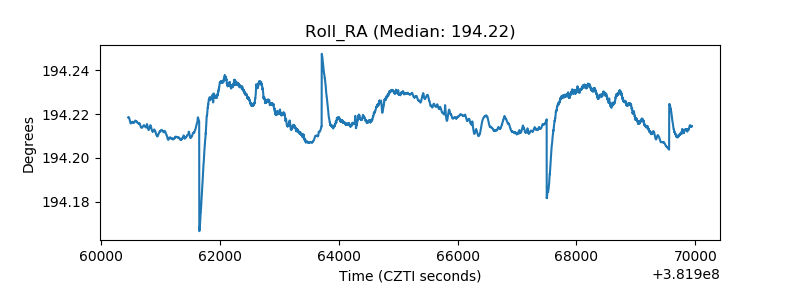 |
| Veto Counter | 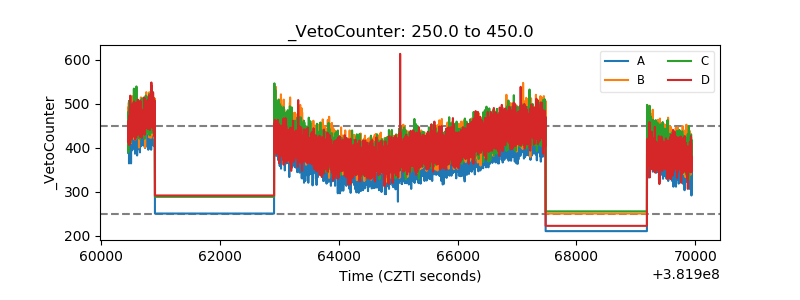 |