| Param | Original file | Final file |
|---|---|---|
| Filename | modeM0/AS1A05_103T01_9000004912_34408cztM0_level2.evt | modeM0/AS1A05_103T01_9000004912_34408cztM0_level2_quad_clean.evt |
| Size (bytes) | 497,148,480 | 95,267,520 |
| Size | 474.1 MB | 90.9 MB |
| Events in quadrant A | 2,782,985 | 634,293 |
| Events in quadrant B | 3,504,496 | 647,135 |
| Events in quadrant C | 3,132,038 | 647,342 |
| Events in quadrant D | 5,278,456 | 586,201 |
| Mode M9 | |||
|---|---|---|---|
| Quadrant | BADHDUFLAG | Total packets | Discarded packets |
| A | 0 | 41 | 0 |
| B | 0 | 41 | 0 |
| C | 0 | 41 | 0 |
| D | 0 | 41 | 0 |
| Mode M0 | |||
|---|---|---|---|
| Quadrant | BADHDUFLAG | Total packets | Discarded packets |
| A | 0 | 11517 | 3 |
| B | 0 | 13726 | 2 |
| C | 0 | 12588 | 2 |
| D | 0 | 19324 | 11 |
| Mode SS | |||
|---|---|---|---|
| Quadrant | BADHDUFLAG | Total packets | Discarded packets |
| A | 0 | 110 | 0 |
| B | 0 | 110 | 0 |
| C | 0 | 110 | 0 |
| D | 0 | 110 | 0 |
| Quadrant | Total seconds | Saturated seconds | Saturation percentage |
|---|---|---|---|
| A | 5286 | 10 | 0.189179% |
| B | 5286 | 274 | 5.183504% |
| C | 5286 | 59 | 1.116156% |
| D | 5285 | 579 | 10.955535% |
Noise dominated data is calculated using 1-second bins in cleaned event files. If a bin has >2000 counts, and if more than 50% of those come from <1% of pixels, then it is considered to be noise-dominated and hence unusable.
| Quadrant | # 1 sec bins | Bins with >0 counts | Bins with >2000 counts | High rate bins dominated by noise | Noise dominated (total time) | Noise dominated (detector-on time) | Marked lightcurve |
|---|---|---|---|---|---|---|---|
| A | 9440 | 5288 | 0 | 0 | 0.00% | 0.00% | 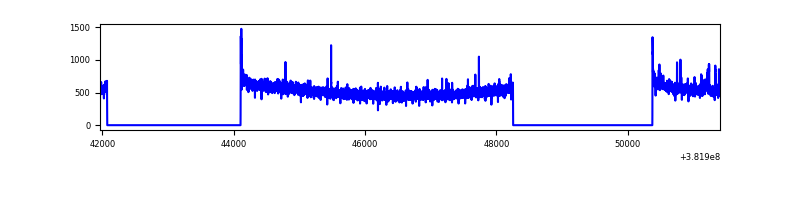 |
| B | 9440 | 5288 | 159 | 159 | 1.68% | 3.01% | 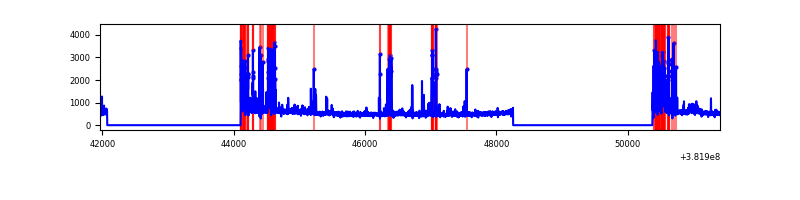 |
| C | 9440 | 5288 | 33 | 33 | 0.35% | 0.62% | 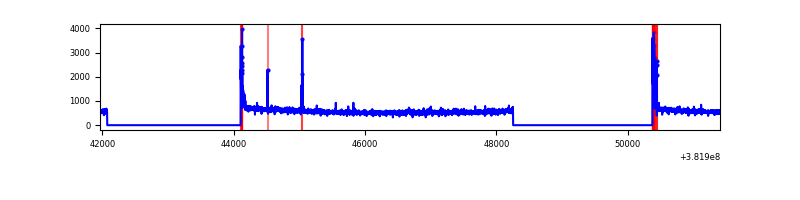 |
| D | 9440 | 5288 | 492 | 492 | 5.21% | 9.30% | 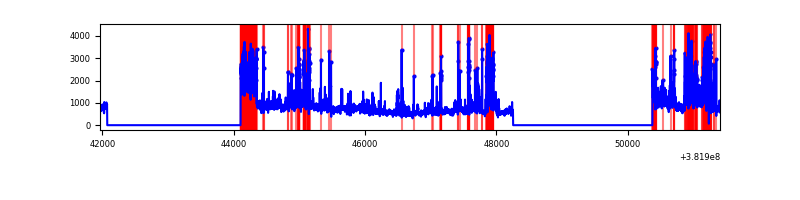 |
Top three noisy pixels from each quadrant. If the there are fewer than three noisy pixels in the level2.evt file, extra rows are filled as -1
| Pixel properties | Quadrant properties | ||||||
|---|---|---|---|---|---|---|---|
| Quadrant | DetID | PixID | Counts | Sigma | Mean | Median | Sigma |
| A | 10 | 83 | 36181 | 255.95 | 698 | 687 | 138.7 |
| A | 15 | 223 | 22778 | 159.3 | 698 | 687 | 138.7 |
| A | 13 | 6 | 14276 | 97.99 | 698 | 687 | 138.7 |
| B | 5 | 172 | 618146 | 4836.64 | 684 | 670 | 127.7 |
| B | 0 | 229 | 94178 | 732.44 | 684 | 670 | 127.7 |
| B | 0 | 190 | 55794 | 431.78 | 684 | 670 | 127.7 |
| C | 15 | 214 | 222541 | 1409.39 | 691 | 699 | 157.4 |
| C | 0 | 10 | 130103 | 822.12 | 691 | 699 | 157.4 |
| C | 14 | 67 | 49345 | 309.05 | 691 | 699 | 157.4 |
| D | 8 | 195 | 750828 | 4299.32 | 645 | 636 | 174.5 |
| D | 7 | 80 | 712700 | 4080.81 | 645 | 636 | 174.5 |
| D | 1 | 47 | 349107 | 1997.07 | 645 | 636 | 174.5 |
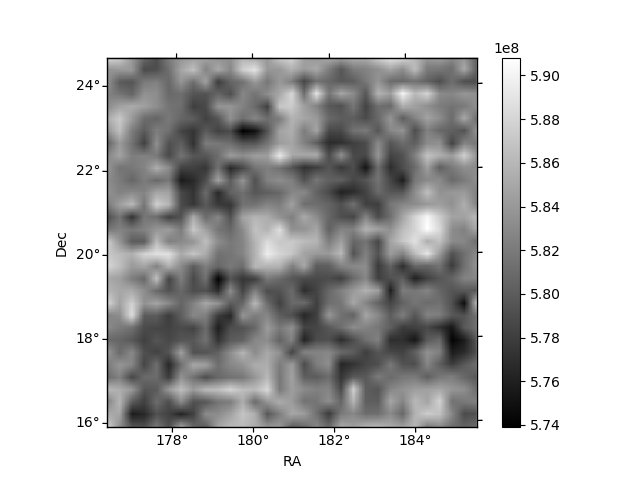
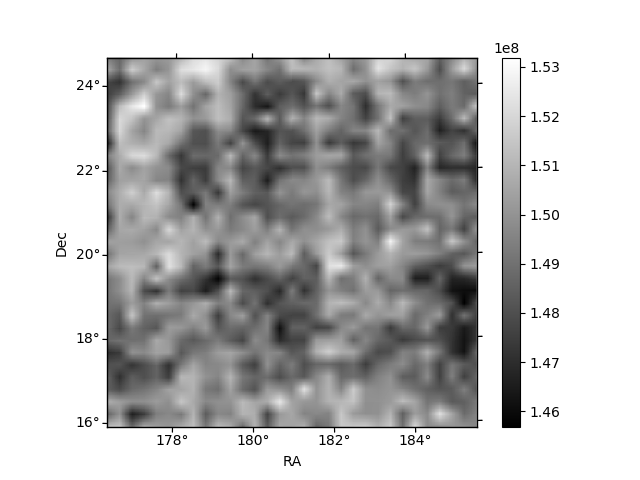
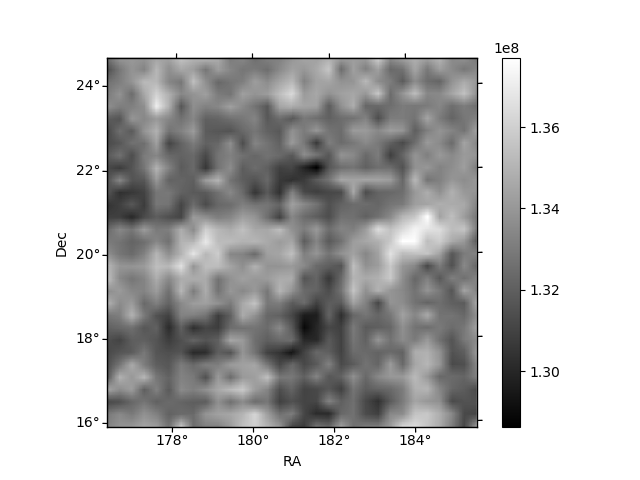
Histogram calculated using DETX and DETY for each event in the final _common_clean file
| Quadrant A | 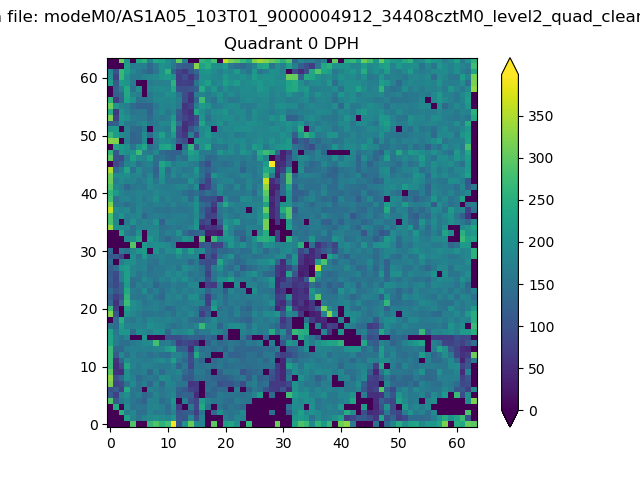 |
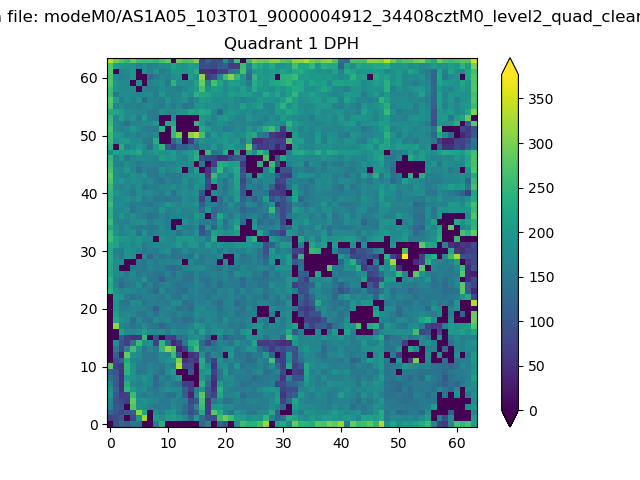 |
Quadrant B |
|---|---|---|---|
| Quadrant D | 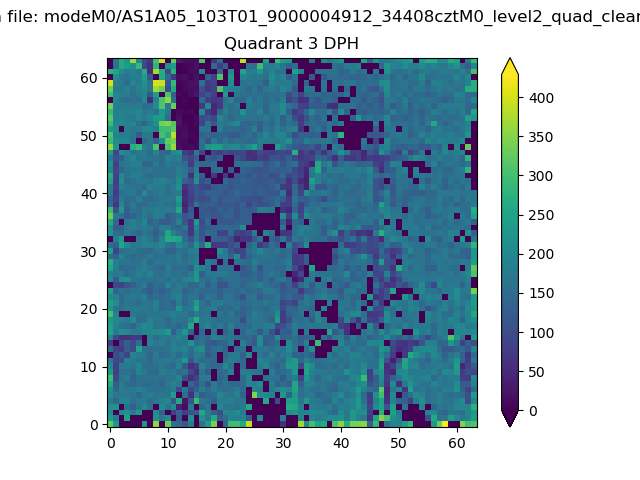 |
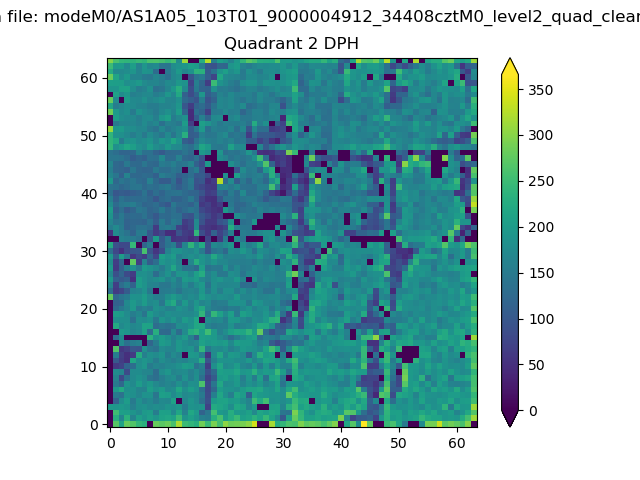 |
Quadrant C |
| Plot type | Count rate plots | Images |
|---|---|---|
| Comparison with Poisson distribution Blue bars denote a histogram of data divided into 1 sec bins. Red curve is a Poisson curve with rate = median count rate of data. |
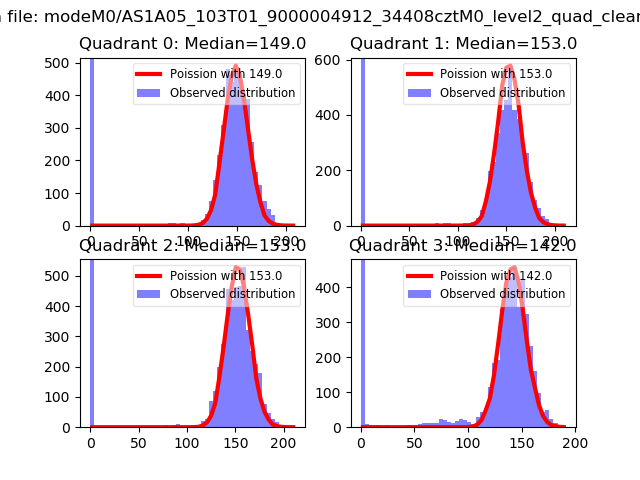 |
 |
| Quadrant-wise count rates Data is divided into 100 sec bins |
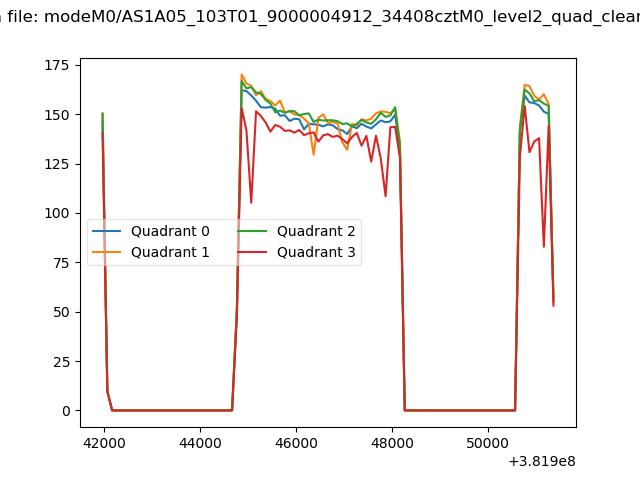 |
|
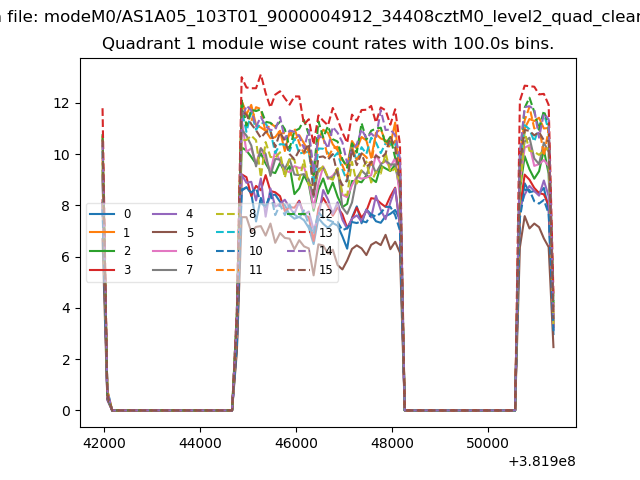
| Module-wise count rates for Quadrant A Data is divided into 100 sec bins |
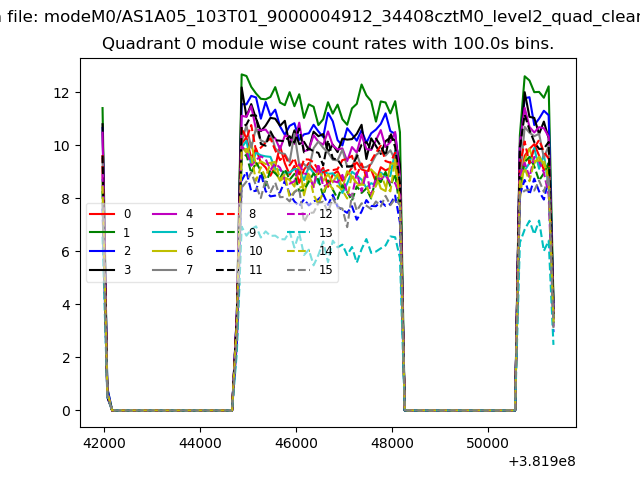 |
 |
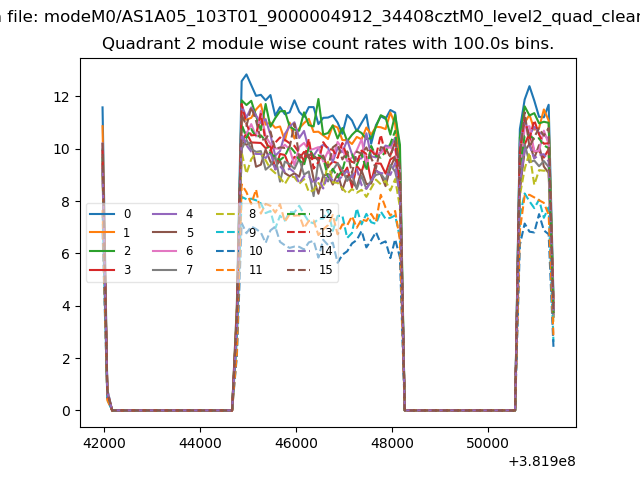
| Module-wise count rates for Quadrant B Data is divided into 100 sec bins |
 |
 |
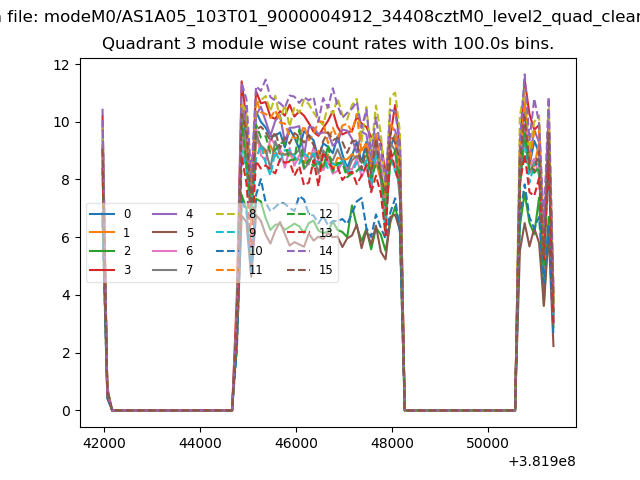
| Module-wise count rates for Quadrant C Data is divided into 100 sec bins |
 |
 |
| Module-wise count rates for Quadrant D Data is divided into 100 sec bins |
 |
 |
| Parameter | Plot |
|---|---|
| CZT HV Monitor | 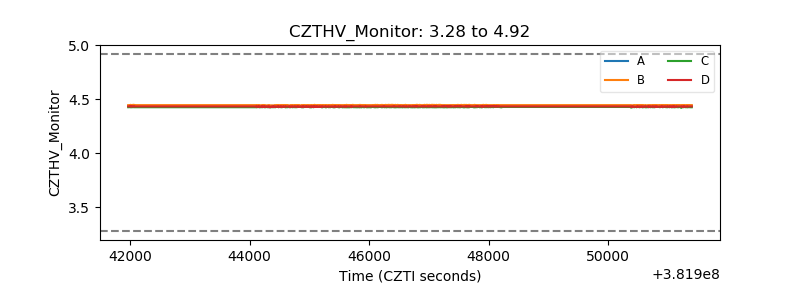 |
| D_VDD | 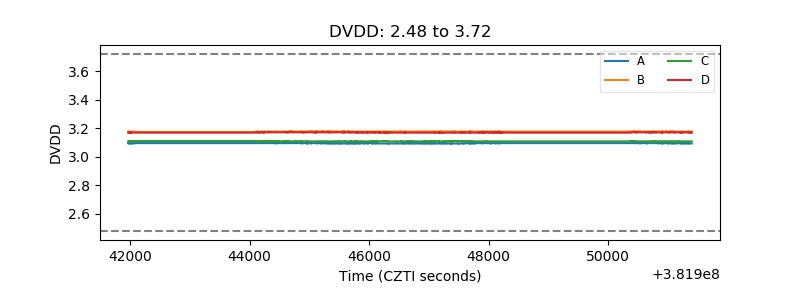 |
| Temperature 1 | 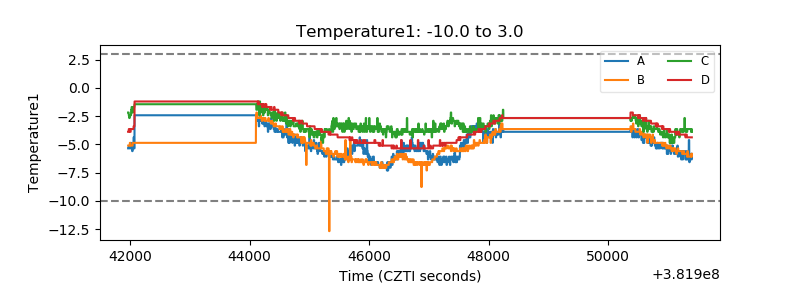 |
| Veto HV Monitor | 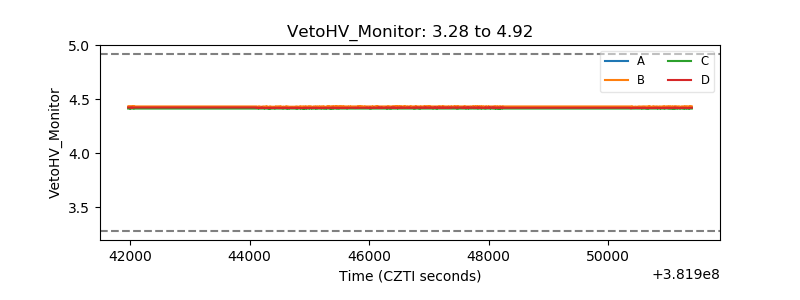 |
| Veto LLD | 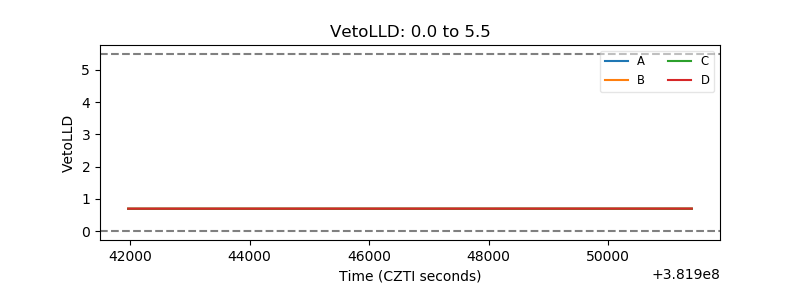 |
| Alpha Counter | 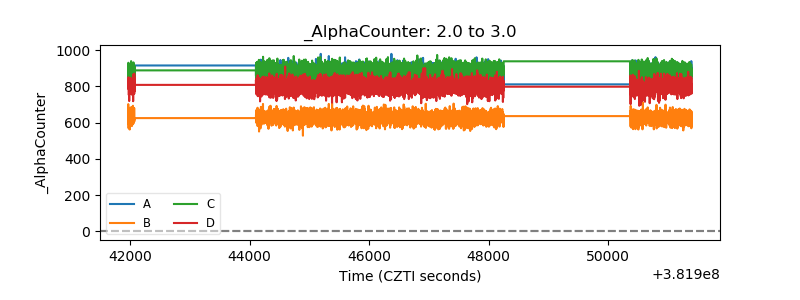 |
| _CPM_Rate | 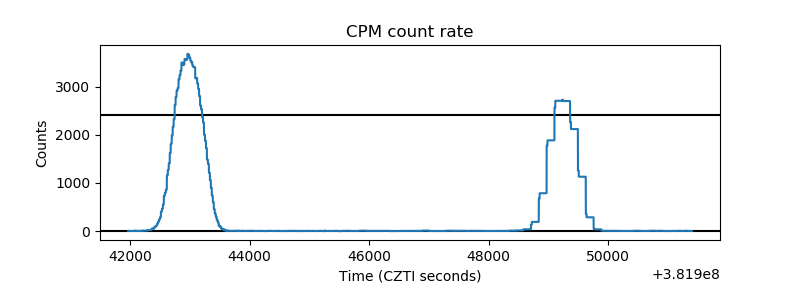 |
| CZT Counter | 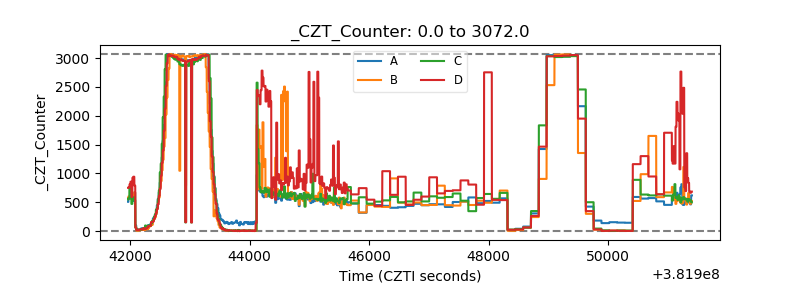 |
| +2.5 Volts monitor | 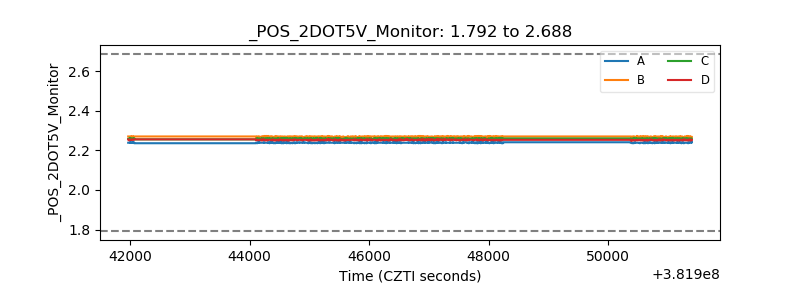 |
| +5 Volts monitor | 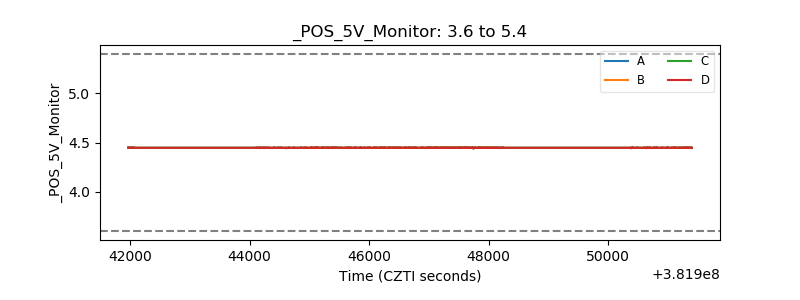 |
| _ROLL_ROT | 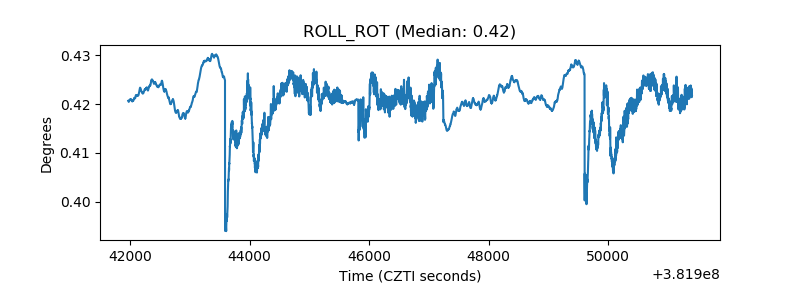 |
| _Roll_DEC | 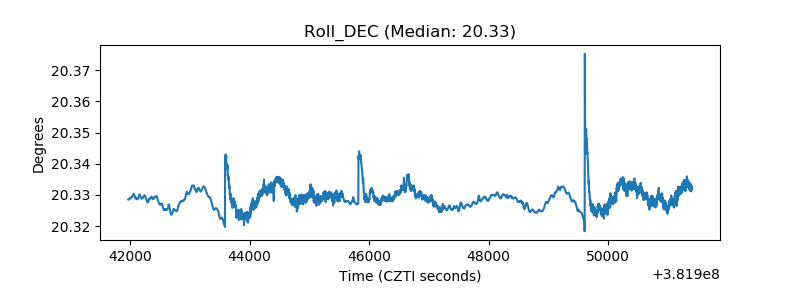 |
| _Roll_RA | 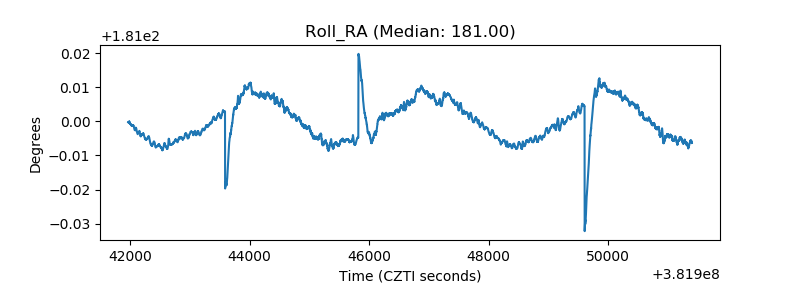 |
| Veto Counter | 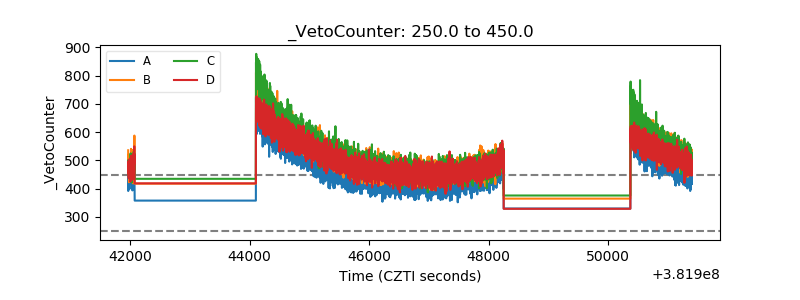 |