| Param | Original file | Final file |
|---|---|---|
| Filename | modeM0/AS1A05_085T01_9000004910_34402cztM0_level2.evt | modeM0/AS1A05_085T01_9000004910_34402cztM0_level2_quad_clean.evt |
| Size (bytes) | 481,147,200 | 70,364,160 |
| Size | 458.9 MB | 67.1 MB |
| Events in quadrant A | 2,613,693 | 443,713 |
| Events in quadrant B | 3,151,149 | 442,017 |
| Events in quadrant C | 2,816,358 | 448,900 |
| Events in quadrant D | 5,609,985 | 403,770 |
| Mode SS | |||
|---|---|---|---|
| Quadrant | BADHDUFLAG | Total packets | Discarded packets |
| A | 0 | 114 | 0 |
| B | 0 | 114 | 0 |
| C | 0 | 114 | 0 |
| D | 0 | 114 | 0 |
| Mode M9 | |||
|---|---|---|---|
| Quadrant | BADHDUFLAG | Total packets | Discarded packets |
| A | 0 | 23 | 0 |
| B | 0 | 23 | 0 |
| C | 0 | 23 | 0 |
| D | 0 | 24 | 0 |
| Mode M0 | |||
|---|---|---|---|
| Quadrant | BADHDUFLAG | Total packets | Discarded packets |
| A | 0 | 11456 | 3 |
| B | 0 | 12971 | 2 |
| C | 0 | 11709 | 2 |
| D | 0 | 20725 | 2 |
| Quadrant | Total seconds | Saturated seconds | Saturation percentage |
|---|---|---|---|
| A | 5605 | 24 | 0.428189% |
| B | 5605 | 129 | 2.301517% |
| C | 5605 | 14 | 0.249777% |
| D | 5605 | 544 | 9.705620% |
Noise dominated data is calculated using 1-second bins in cleaned event files. If a bin has >2000 counts, and if more than 50% of those come from <1% of pixels, then it is considered to be noise-dominated and hence unusable.
| Quadrant | # 1 sec bins | Bins with >0 counts | Bins with >2000 counts | High rate bins dominated by noise | Noise dominated (total time) | Noise dominated (detector-on time) | Marked lightcurve |
|---|---|---|---|---|---|---|---|
| A | 7188 | 5606 | 11 | 11 | 0.15% | 0.20% | 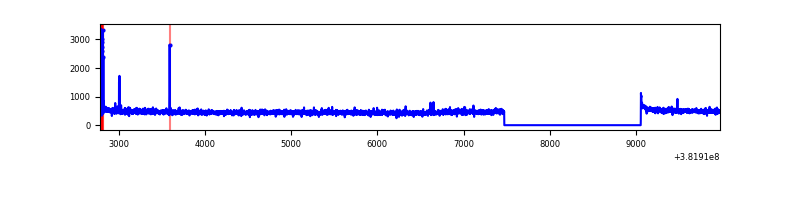 |
| B | 7188 | 5606 | 75 | 75 | 1.04% | 1.34% | 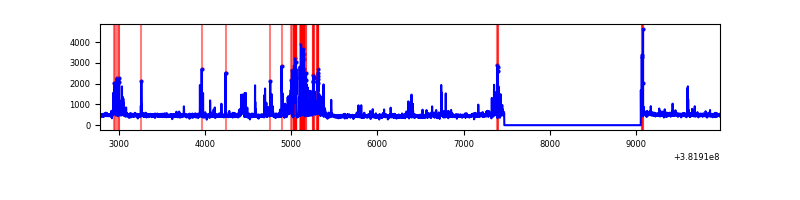 |
| C | 7188 | 5606 | 5 | 5 | 0.07% | 0.09% | 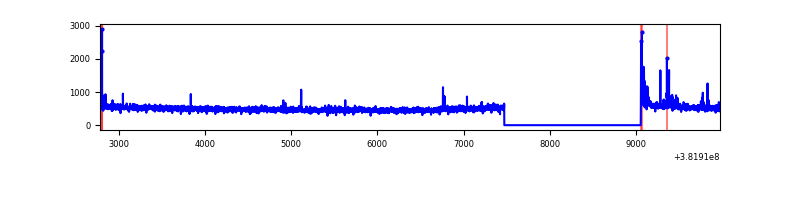 |
| D | 7188 | 5606 | 472 | 472 | 6.57% | 8.42% | 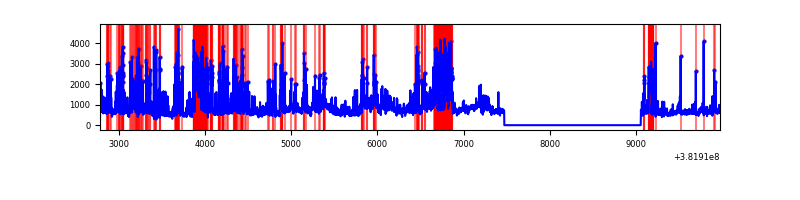 |
Top three noisy pixels from each quadrant. If the there are fewer than three noisy pixels in the level2.evt file, extra rows are filled as -1
| Pixel properties | Quadrant properties | ||||||
|---|---|---|---|---|---|---|---|
| Quadrant | DetID | PixID | Counts | Sigma | Mean | Median | Sigma |
| A | 9 | 143 | 40087 | 298.62 | 653 | 639 | 132.1 |
| A | 10 | 83 | 34303 | 254.83 | 653 | 639 | 132.1 |
| A | 13 | 6 | 10408 | 73.95 | 653 | 639 | 132.1 |
| B | 5 | 172 | 482522 | 3888.76 | 644 | 626 | 123.9 |
| B | 5 | 255 | 52113 | 415.48 | 644 | 626 | 123.9 |
| B | 0 | 190 | 30243 | 239.0 | 644 | 626 | 123.9 |
| C | 15 | 214 | 238496 | 1608.61 | 635 | 640 | 147.9 |
| C | 0 | 10 | 47782 | 318.82 | 635 | 640 | 147.9 |
| C | 14 | 254 | 22059 | 144.86 | 635 | 640 | 147.9 |
| D | 7 | 80 | 1072509 | 7197.14 | 610 | 593 | 148.9 |
| D | 8 | 195 | 692981 | 4648.88 | 610 | 593 | 148.9 |
| D | 2 | 207 | 383711 | 2572.36 | 610 | 593 | 148.9 |
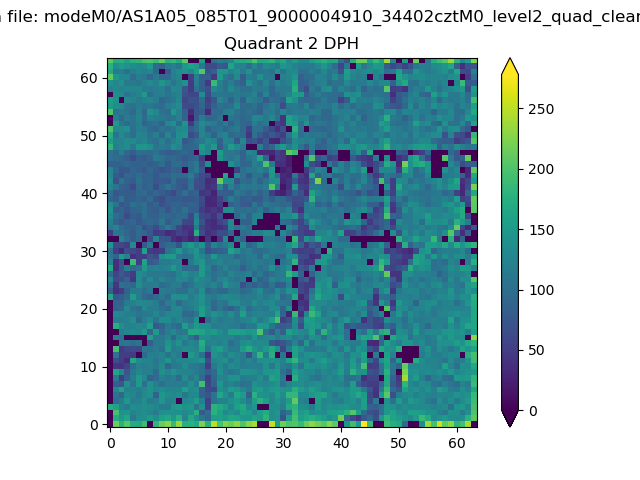
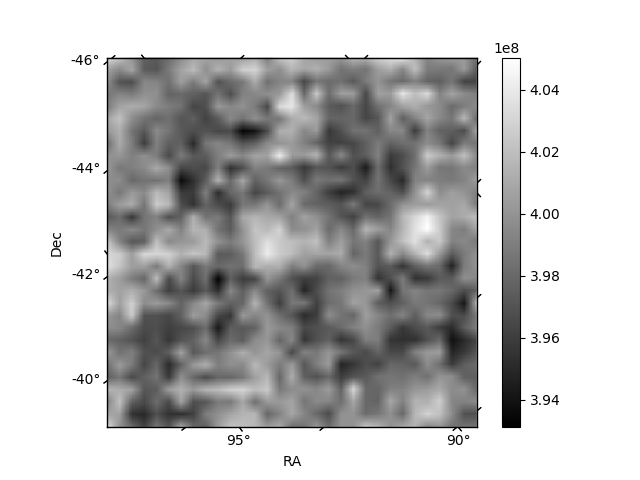
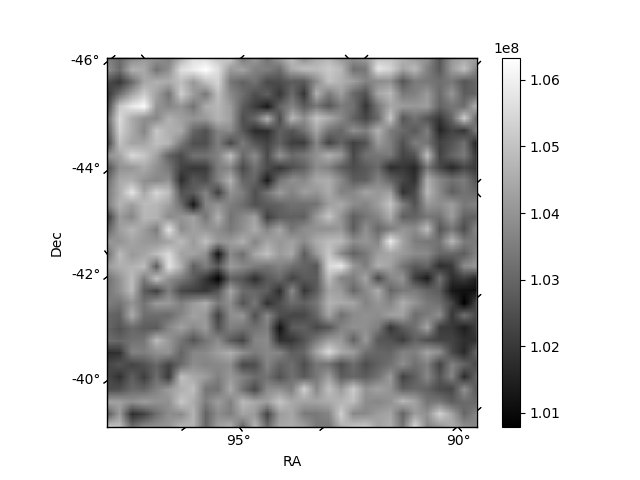
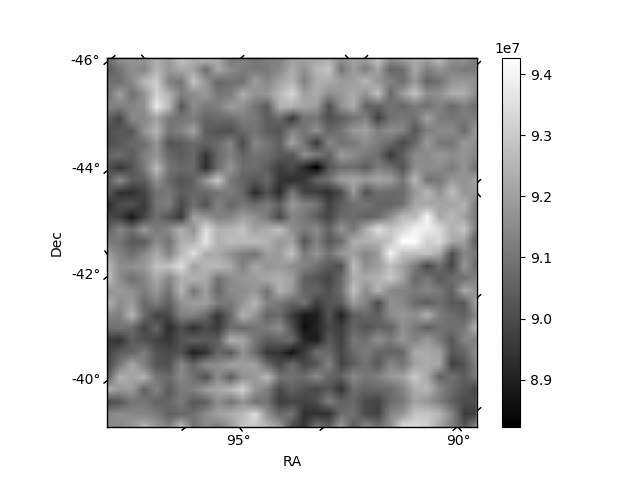
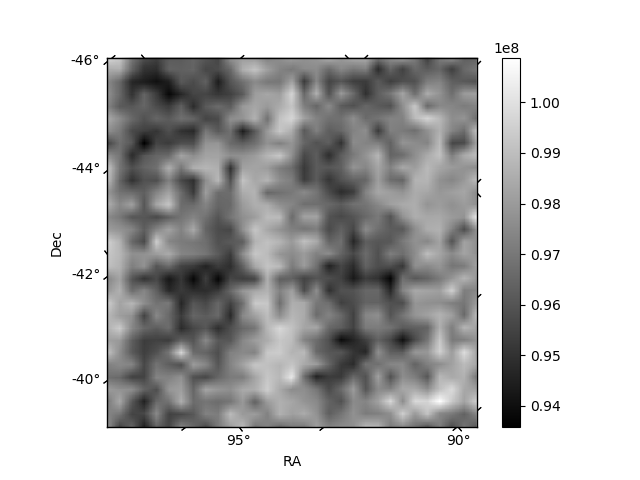
Histogram calculated using DETX and DETY for each event in the final _common_clean file
| Quadrant A | 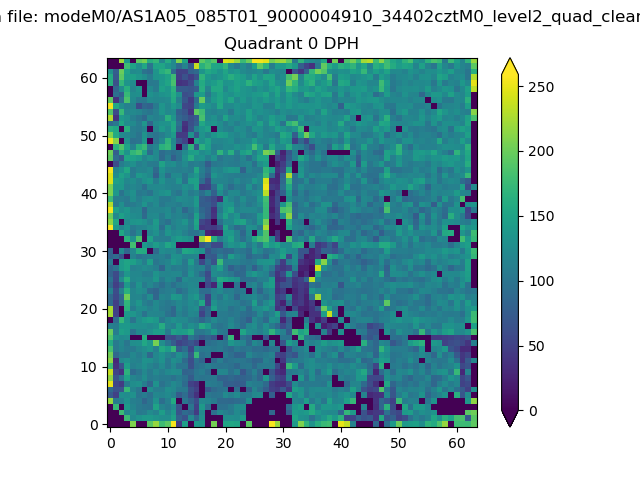 |
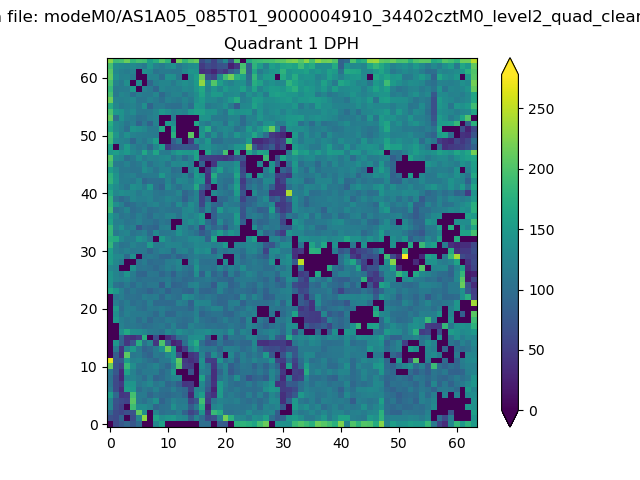 |
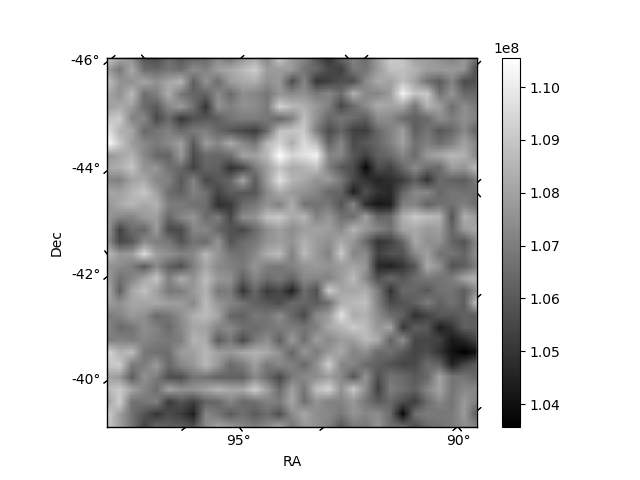
Quadrant B |
|---|---|---|---|
| Quadrant D | 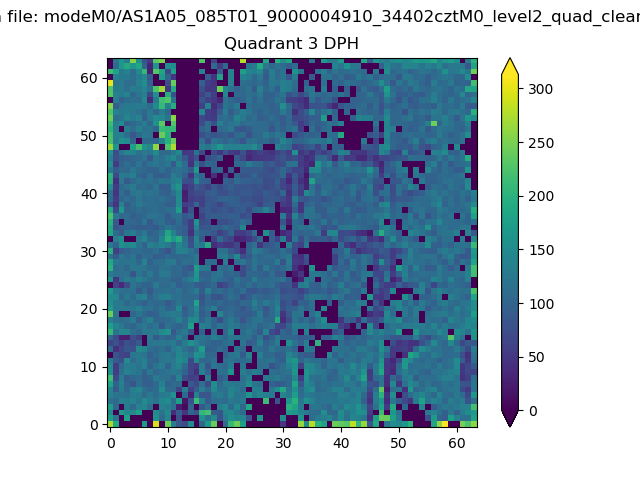 |
 |
Quadrant C |
| Plot type | Count rate plots | Images |
|---|---|---|
| Comparison with Poisson distribution Blue bars denote a histogram of data divided into 1 sec bins. Red curve is a Poisson curve with rate = median count rate of data. |
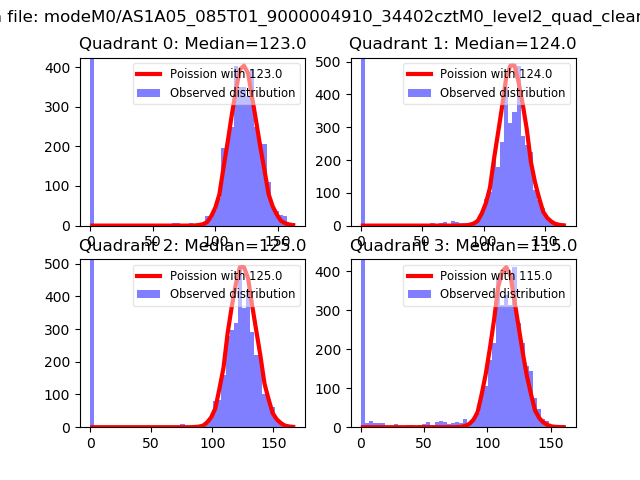 |
 |
| Quadrant-wise count rates Data is divided into 100 sec bins |
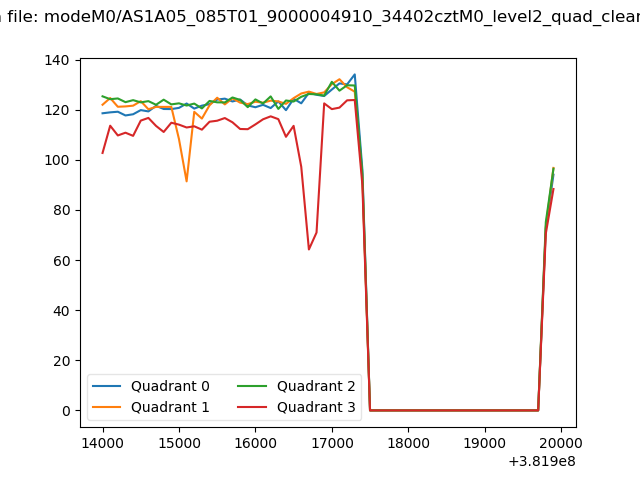 |
|
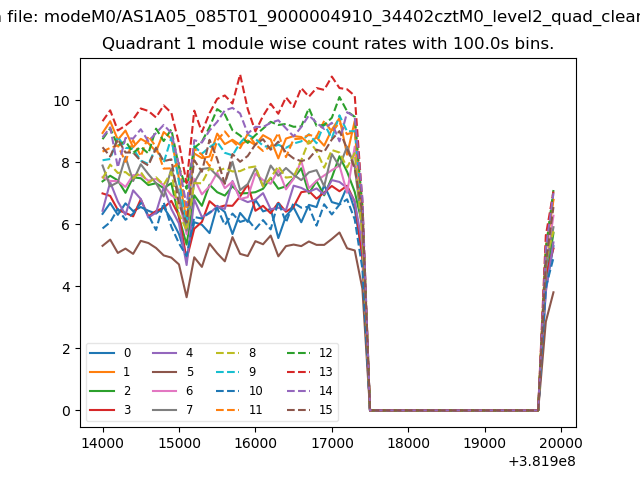
| Module-wise count rates for Quadrant A Data is divided into 100 sec bins |
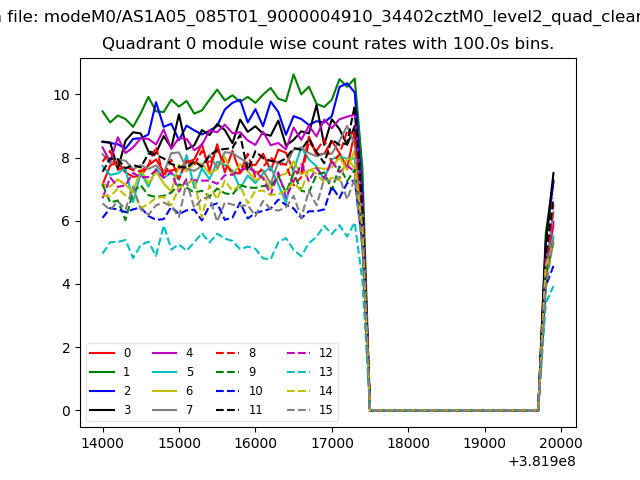 |
 |
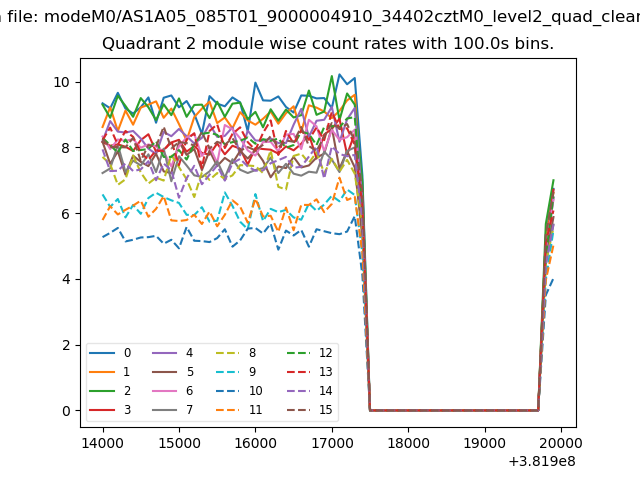
| Module-wise count rates for Quadrant B Data is divided into 100 sec bins |
 |
 |
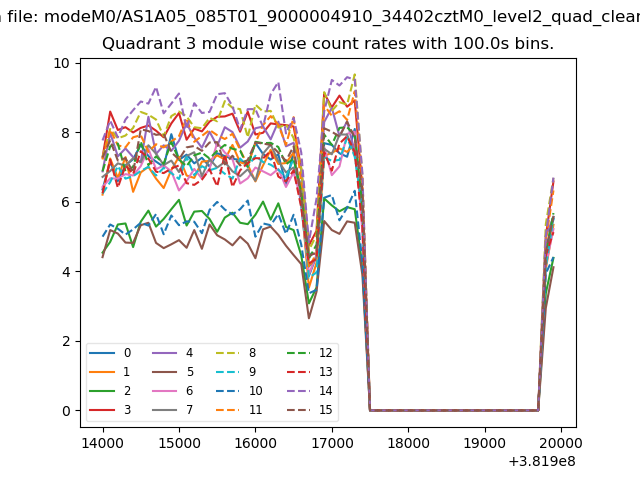
| Module-wise count rates for Quadrant C Data is divided into 100 sec bins |
 |
 |
| Module-wise count rates for Quadrant D Data is divided into 100 sec bins |
 |
 |
| Parameter | Plot |
|---|---|
| CZT HV Monitor | 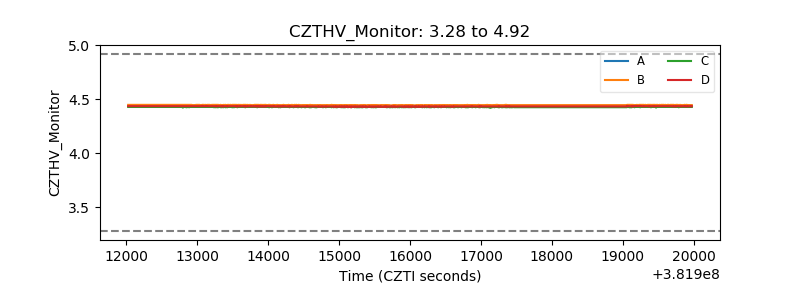 |
| D_VDD | 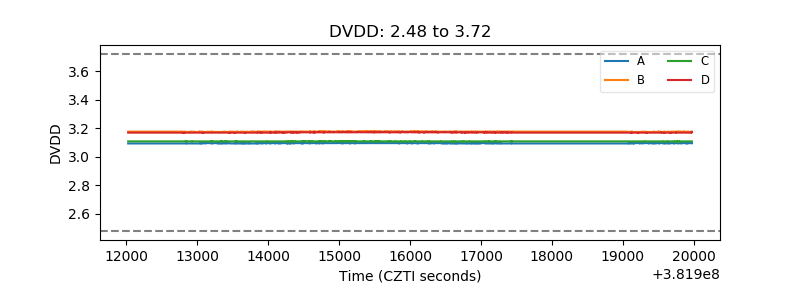 |
| Temperature 1 | 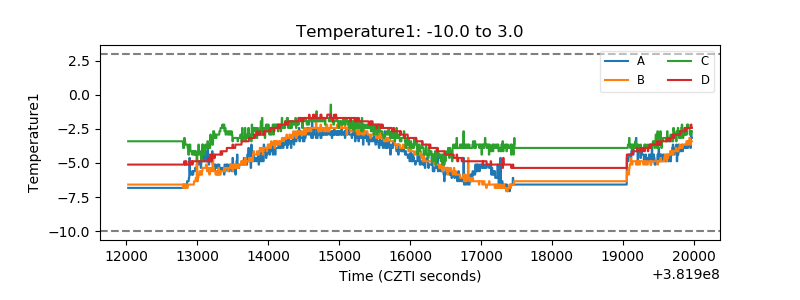 |
| Veto HV Monitor | 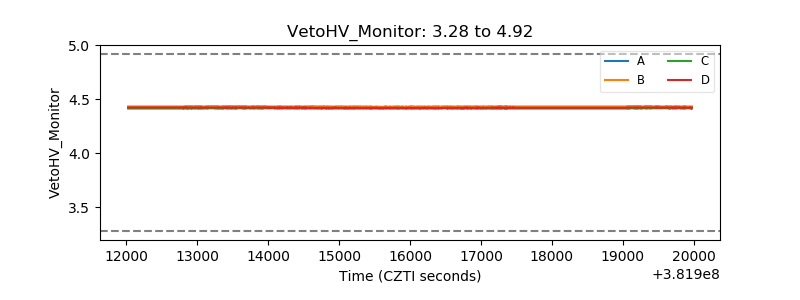 |
| Veto LLD | 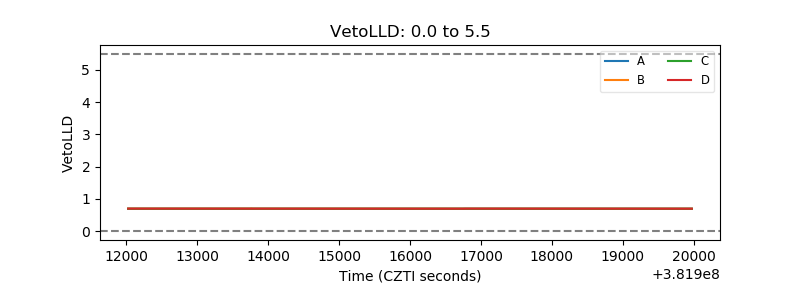 |
| Alpha Counter | 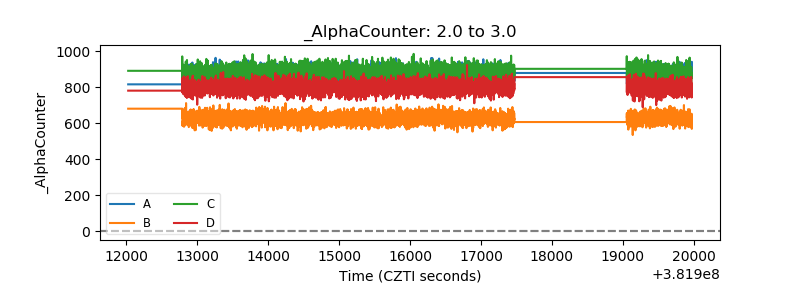 |
| _CPM_Rate | 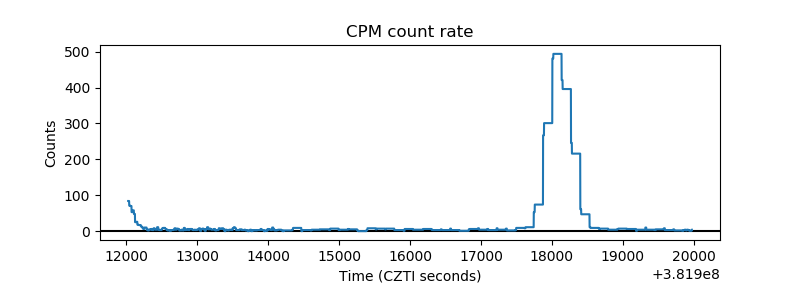 |
| CZT Counter | 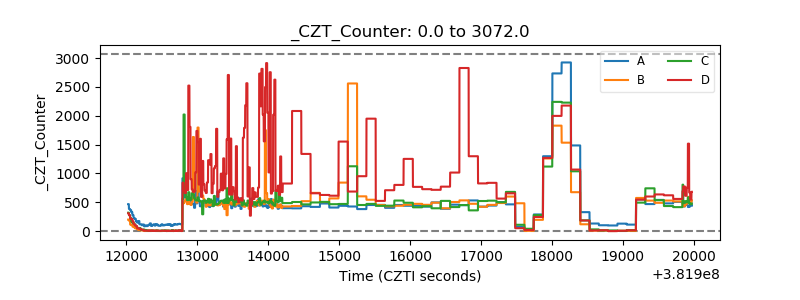 |
| +2.5 Volts monitor | 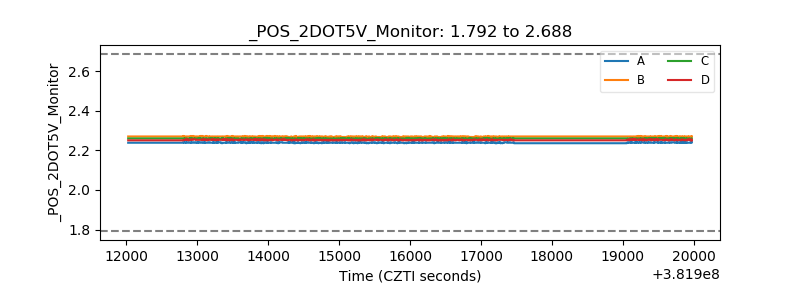 |
| +5 Volts monitor | 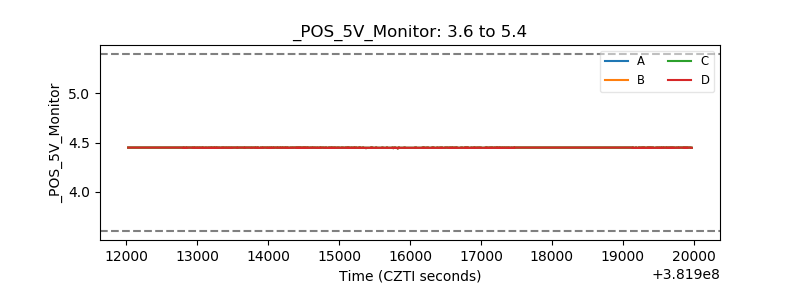 |
| _ROLL_ROT | 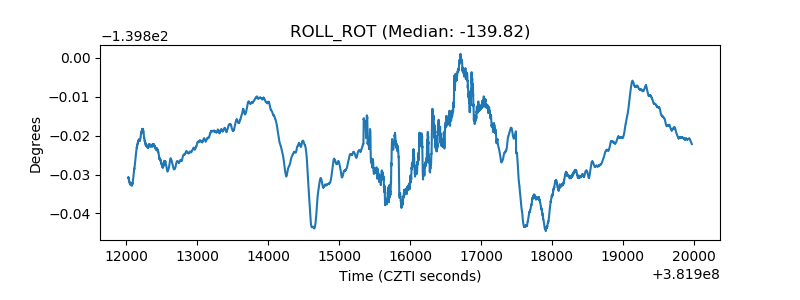 |
| _Roll_DEC | 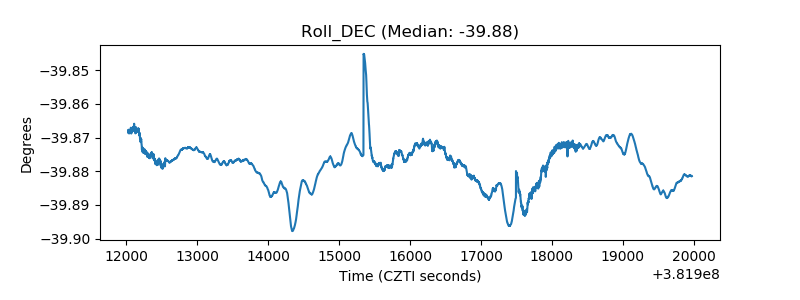 |
| _Roll_RA | 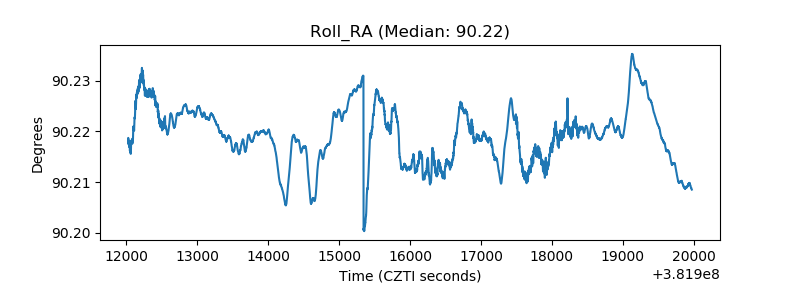 |
| Veto Counter | 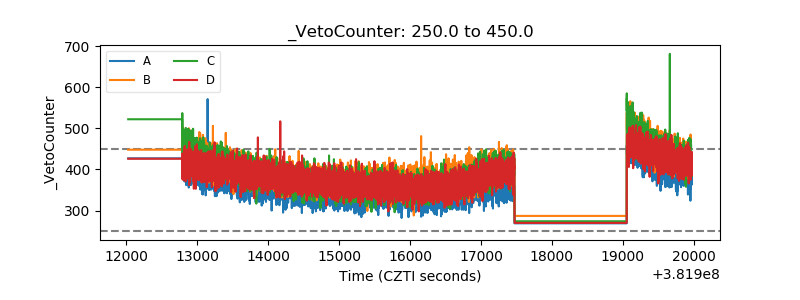 |