| Param | Original file | Final file |
|---|---|---|
| Filename | modeM0/AS1A05_085T01_9000004910_34401cztM0_level2.evt | modeM0/AS1A05_085T01_9000004910_34401cztM0_level2_quad_clean.evt |
| Size (bytes) | 969,246,720 | 123,082,560 |
| Size | 924.3 MB | 117.4 MB |
| Events in quadrant A | 5,007,592 | 763,130 |
| Events in quadrant B | 7,400,095 | 748,960 |
| Events in quadrant C | 5,432,337 | 771,707 |
| Events in quadrant D | 10,781,142 | 691,588 |
| Mode SS | |||
|---|---|---|---|
| Quadrant | BADHDUFLAG | Total packets | Discarded packets |
| A | 0 | 222 | 0 |
| B | 0 | 222 | 0 |
| C | 0 | 222 | 0 |
| D | 0 | 222 | 0 |
| Mode M9 | |||
|---|---|---|---|
| Quadrant | BADHDUFLAG | Total packets | Discarded packets |
| A | 0 | 33 | 0 |
| B | 0 | 33 | 0 |
| C | 0 | 33 | 0 |
| D | 0 | 34 | 0 |
| Mode M0 | |||
|---|---|---|---|
| Quadrant | BADHDUFLAG | Total packets | Discarded packets |
| A | 0 | 22060 | 4 |
| B | 0 | 29052 | 3 |
| C | 0 | 22292 | 3 |
| D | 0 | 40045 | 3 |
| Quadrant | Total seconds | Saturated seconds | Saturation percentage |
|---|---|---|---|
| A | 10852 | 32 | 0.294877% |
| B | 10852 | 774 | 7.132326% |
| C | 10852 | 37 | 0.340951% |
| D | 10852 | 963 | 8.873940% |
Noise dominated data is calculated using 1-second bins in cleaned event files. If a bin has >2000 counts, and if more than 50% of those come from <1% of pixels, then it is considered to be noise-dominated and hence unusable.
| Quadrant | # 1 sec bins | Bins with >0 counts | Bins with >2000 counts | High rate bins dominated by noise | Noise dominated (total time) | Noise dominated (detector-on time) | Marked lightcurve |
|---|---|---|---|---|---|---|---|
| A | 13658 | 10854 | 15 | 15 | 0.11% | 0.14% | 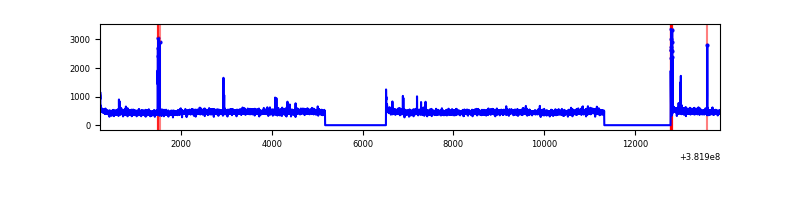 |
| B | 13658 | 10854 | 525 | 525 | 3.84% | 4.84% | 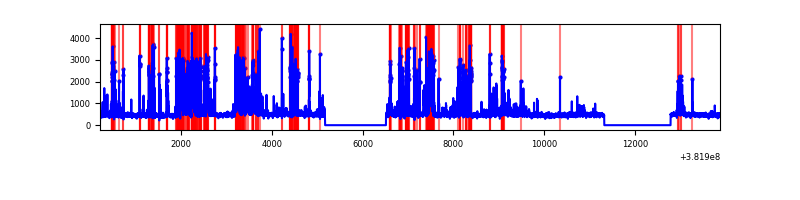 |
| C | 13658 | 10854 | 19 | 19 | 0.14% | 0.18% | 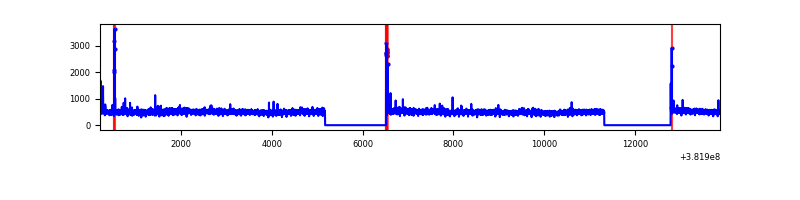 |
| D | 13657 | 10853 | 859 | 859 | 6.29% | 7.91% | 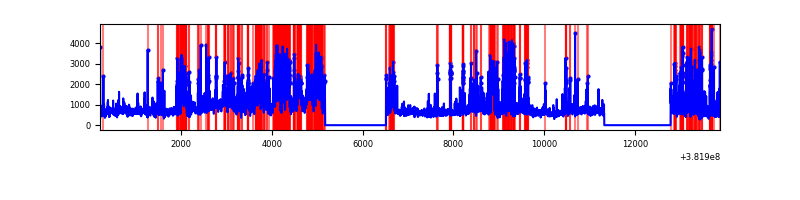 |
Top three noisy pixels from each quadrant. If the there are fewer than three noisy pixels in the level2.evt file, extra rows are filled as -1
| Pixel properties | Quadrant properties | ||||||
|---|---|---|---|---|---|---|---|
| Quadrant | DetID | PixID | Counts | Sigma | Mean | Median | Sigma |
| A | 9 | 143 | 76966 | 301.01 | 1251 | 1225 | 251.6 |
| A | 10 | 83 | 54763 | 212.77 | 1251 | 1225 | 251.6 |
| A | 13 | 6 | 31316 | 119.59 | 1251 | 1225 | 251.6 |
| B | 5 | 172 | 2199677 | 9389.79 | 1215 | 1179 | 234.1 |
| B | 0 | 245 | 130896 | 554.02 | 1215 | 1179 | 234.1 |
| B | 5 | 200 | 110269 | 465.92 | 1215 | 1179 | 234.1 |
| C | 15 | 214 | 451633 | 1599.92 | 1218 | 1225 | 281.5 |
| C | 14 | 67 | 114523 | 402.45 | 1218 | 1225 | 281.5 |
| C | 0 | 10 | 72361 | 252.69 | 1218 | 1225 | 281.5 |
| D | 2 | 249 | 1681102 | 5853.39 | 1180 | 1146 | 287.0 |
| D | 8 | 195 | 1675100 | 5832.47 | 1180 | 1146 | 287.0 |
| D | 7 | 223 | 1224269 | 4261.67 | 1180 | 1146 | 287.0 |
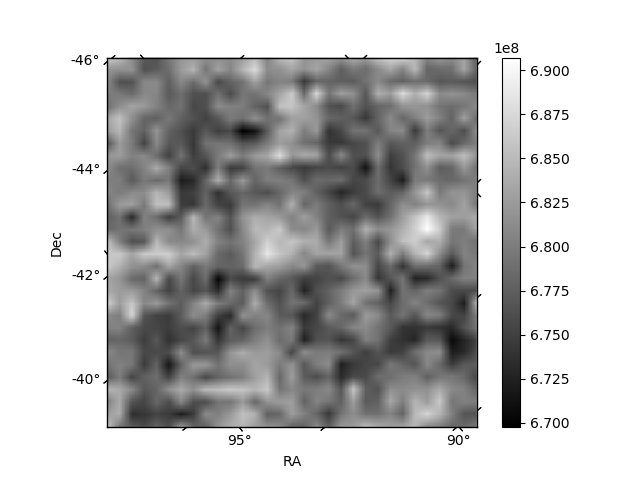
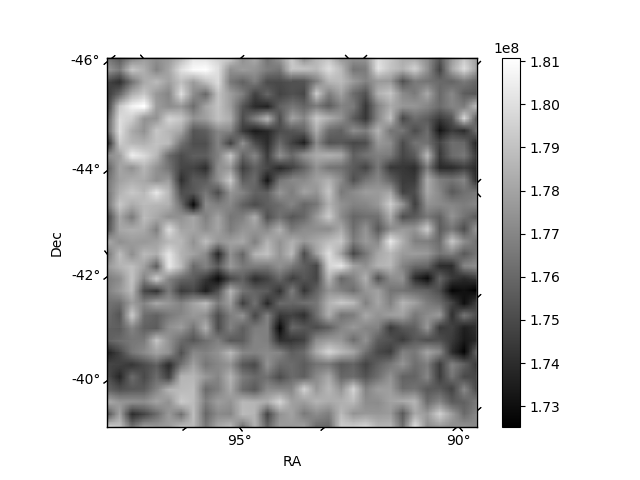
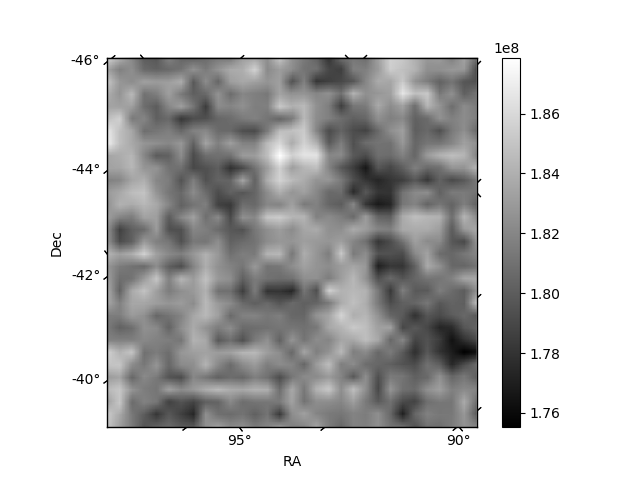
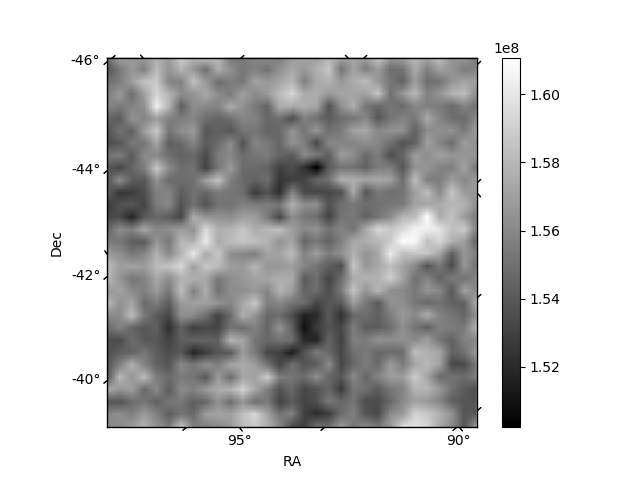
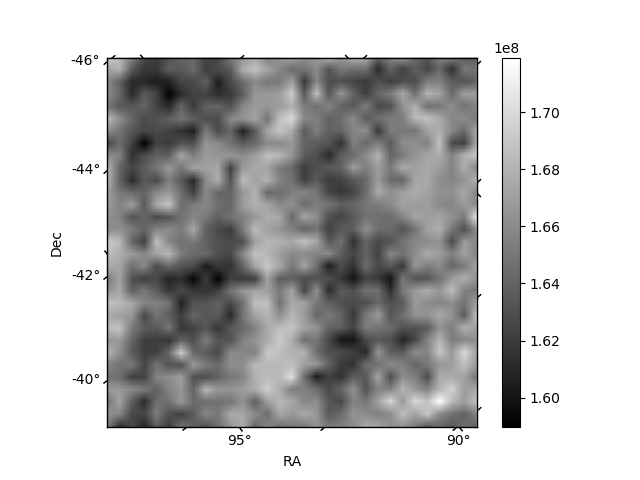
Histogram calculated using DETX and DETY for each event in the final _common_clean file
| Quadrant A | 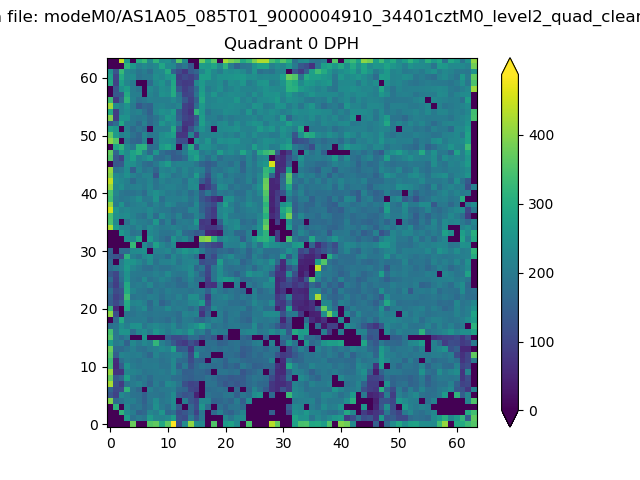 |
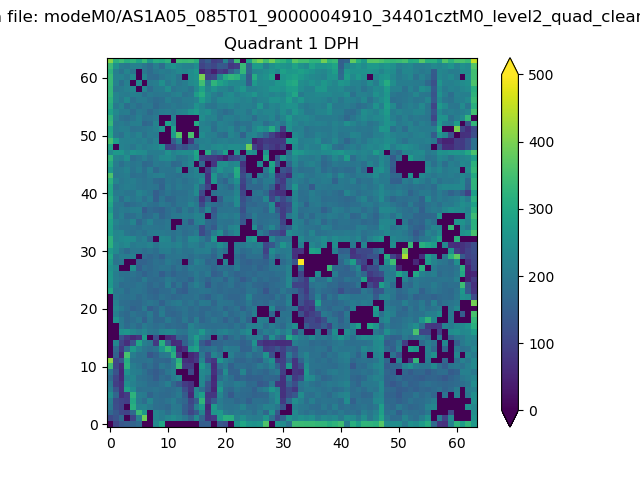 |
Quadrant B |
|---|---|---|---|
| Quadrant D | 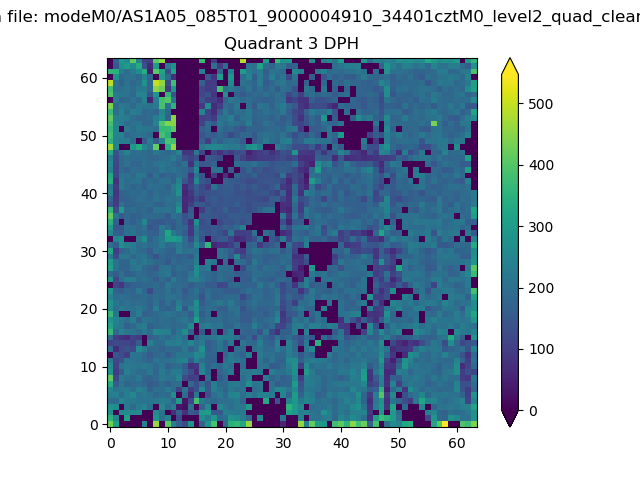 |
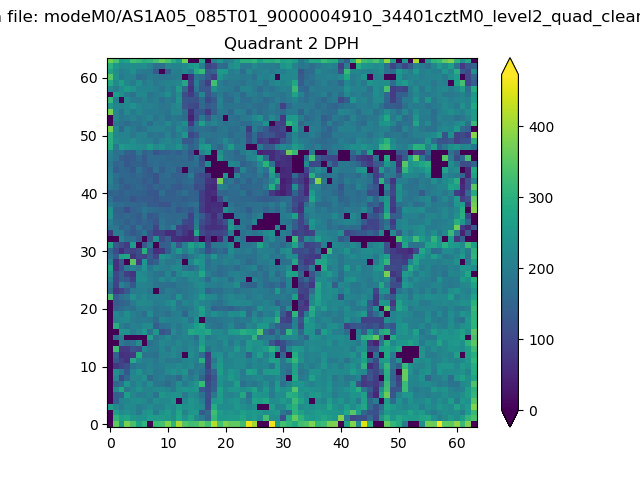 |
Quadrant C |
| Plot type | Count rate plots | Images |
|---|---|---|
| Comparison with Poisson distribution Blue bars denote a histogram of data divided into 1 sec bins. Red curve is a Poisson curve with rate = median count rate of data. |
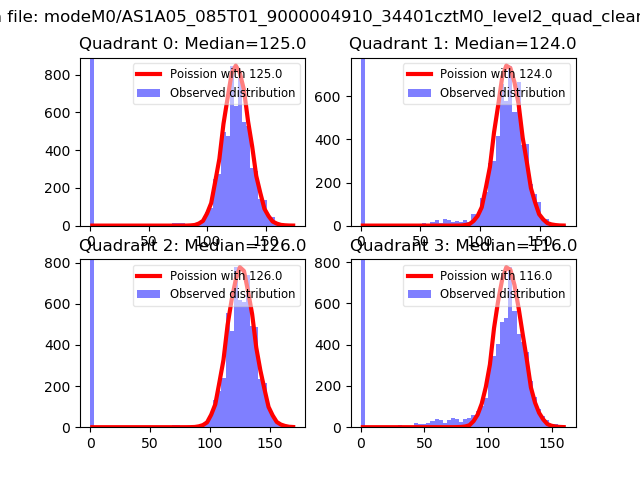 |
 |
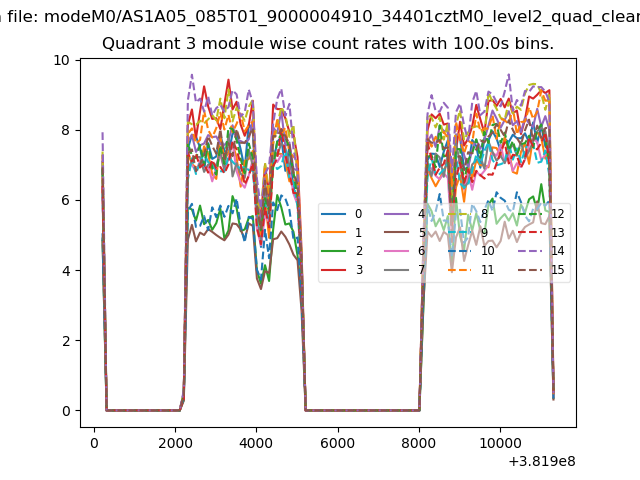
| Quadrant-wise count rates Data is divided into 100 sec bins |
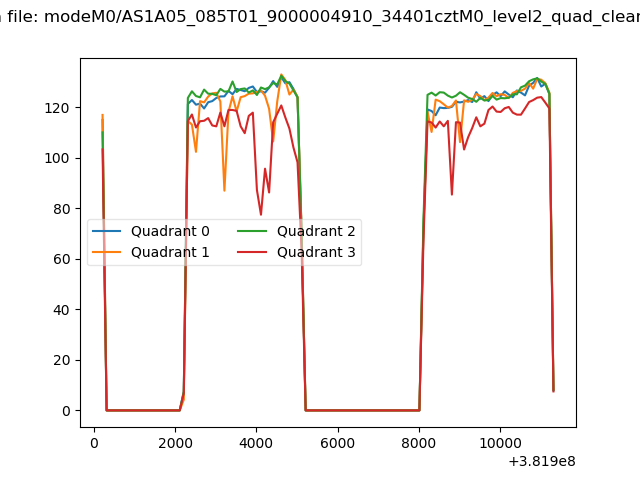 |
|
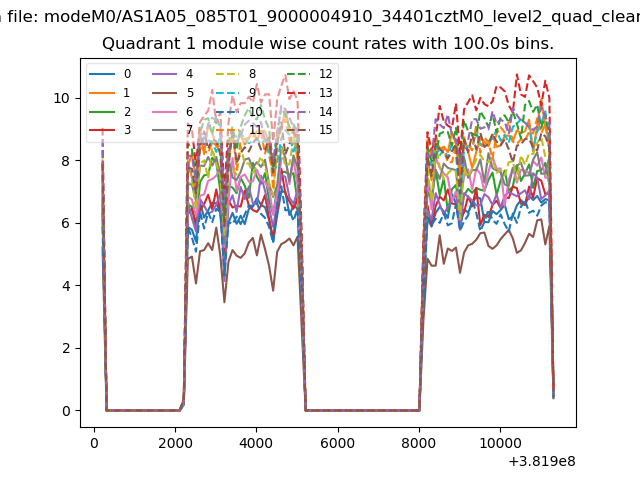
| Module-wise count rates for Quadrant A Data is divided into 100 sec bins |
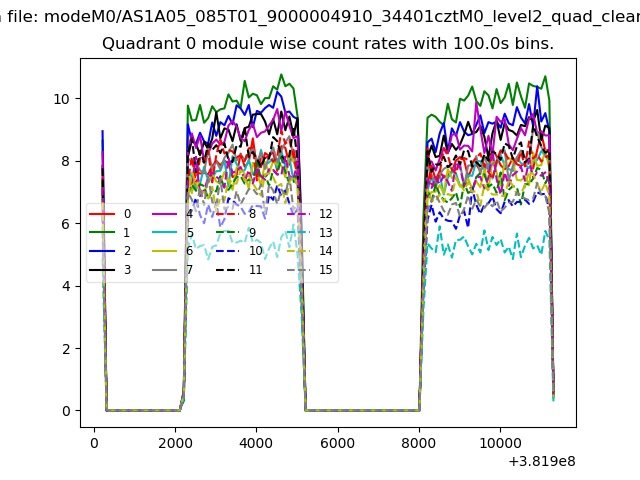 |
 |
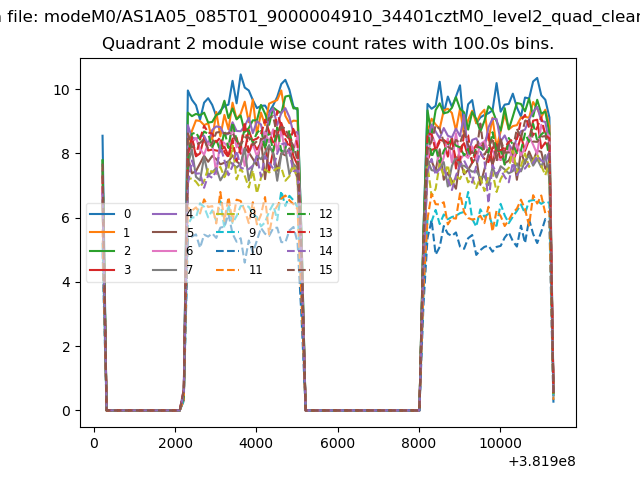
| Module-wise count rates for Quadrant B Data is divided into 100 sec bins |
 |
 |
| Module-wise count rates for Quadrant C Data is divided into 100 sec bins |
 |
 |
| Module-wise count rates for Quadrant D Data is divided into 100 sec bins |
 |
 |
| Parameter | Plot |
|---|---|
| CZT HV Monitor | 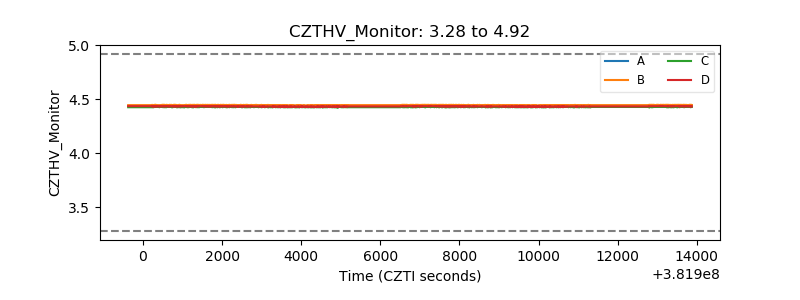 |
| D_VDD | 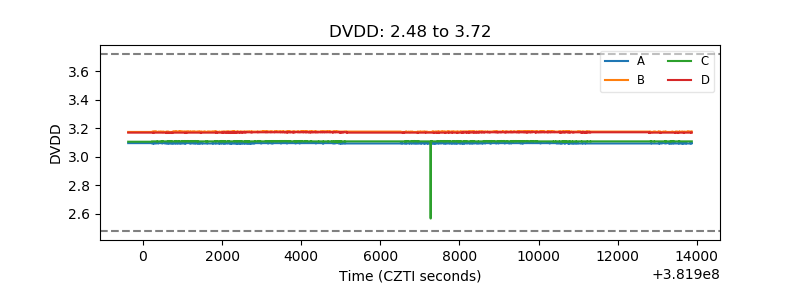 |
| Temperature 1 | 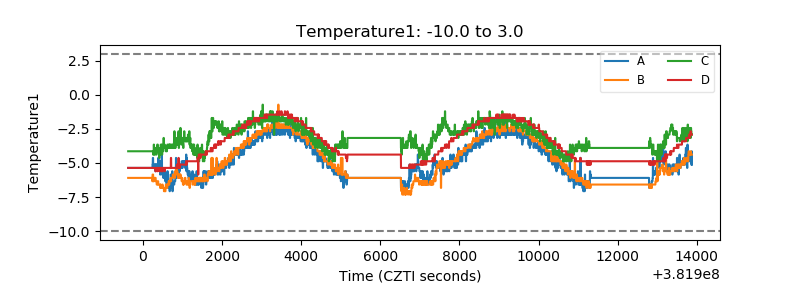 |
| Veto HV Monitor | 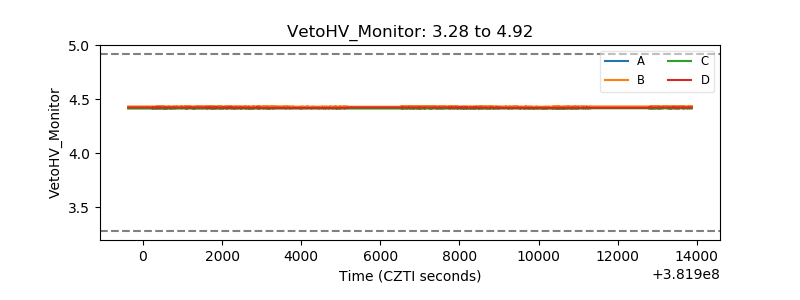 |
| Veto LLD |  |
| Alpha Counter | 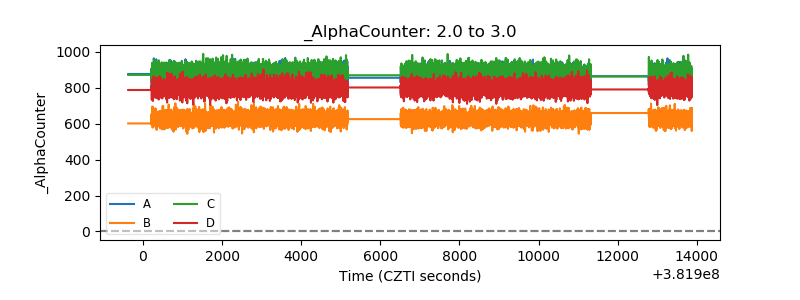 |
| _CPM_Rate | 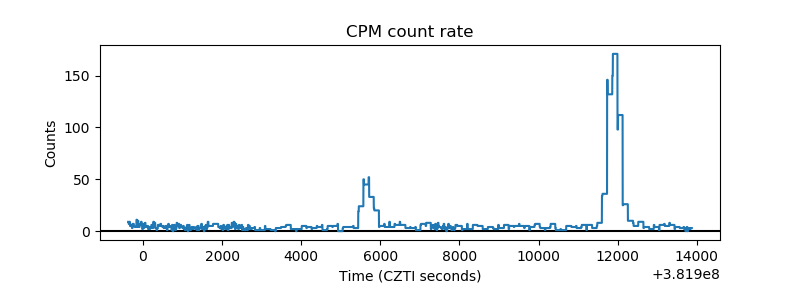 |
| CZT Counter | 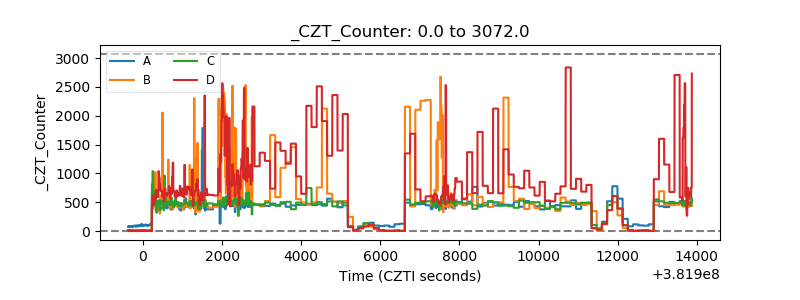 |
| +2.5 Volts monitor | 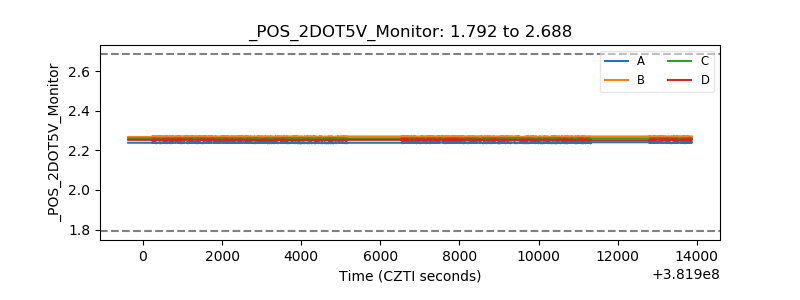 |
| +5 Volts monitor | 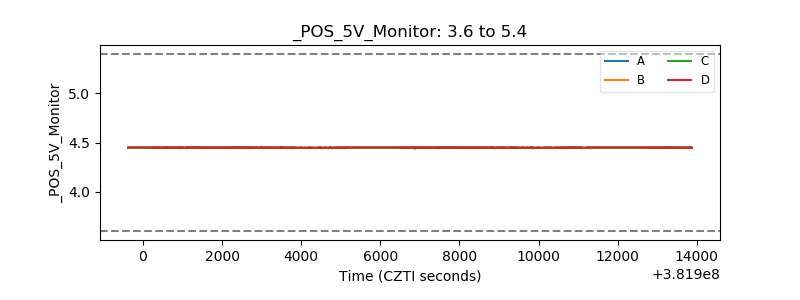 |
| _ROLL_ROT | 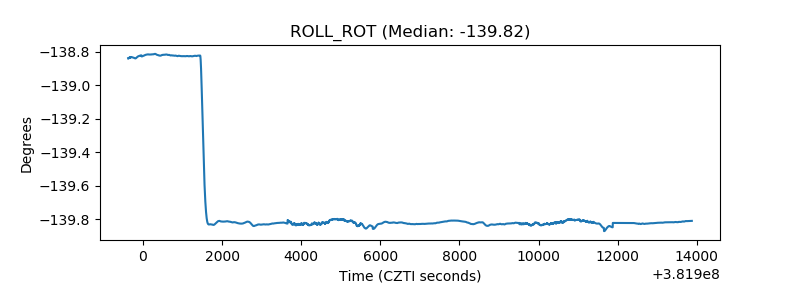 |
| _Roll_DEC | 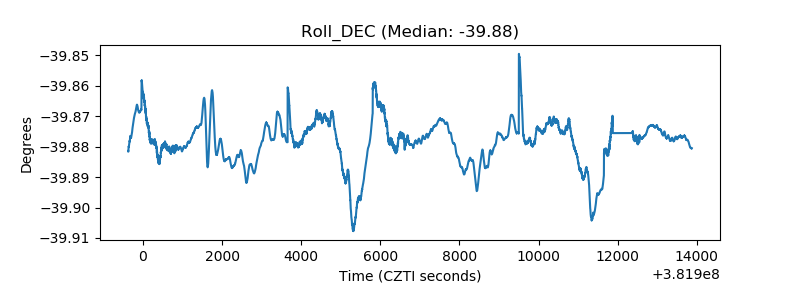 |
| _Roll_RA | 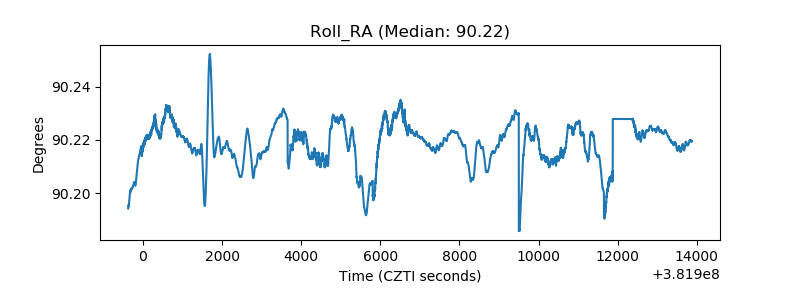 |
| Veto Counter | 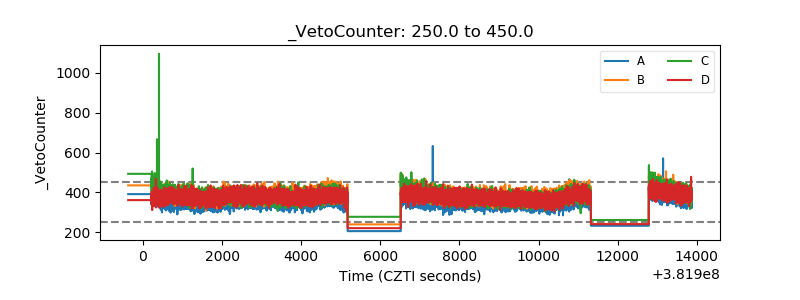 |