| Param | Original file | Final file |
|---|---|---|
| Filename | modeM0/AS1A05_085T01_9000004910_34399cztM0_level2.evt | modeM0/AS1A05_085T01_9000004910_34399cztM0_level2_quad_clean.evt |
| Size (bytes) | 674,818,560 | 73,854,720 |
| Size | 643.6 MB | 70.4 MB |
| Events in quadrant A | 2,991,038 | 468,836 |
| Events in quadrant B | 4,185,813 | 464,863 |
| Events in quadrant C | 3,393,984 | 466,994 |
| Events in quadrant D | 9,426,313 | 381,219 |
| Mode SS | |||
|---|---|---|---|
| Quadrant | BADHDUFLAG | Total packets | Discarded packets |
| A | 0 | 136 | 0 |
| B | 0 | 136 | 0 |
| C | 0 | 136 | 0 |
| D | 0 | 136 | 0 |
| Mode M9 | |||
|---|---|---|---|
| Quadrant | BADHDUFLAG | Total packets | Discarded packets |
| A | 0 | 25 | 0 |
| B | 0 | 25 | 0 |
| C | 0 | 25 | 0 |
| D | 0 | 25 | 0 |
| Mode M0 | |||
|---|---|---|---|
| Quadrant | BADHDUFLAG | Total packets | Discarded packets |
| A | 0 | 13153 | 3 |
| B | 0 | 16732 | 2 |
| C | 0 | 13769 | 2 |
| D | 0 | 32666 | 2 |
| Quadrant | Total seconds | Saturated seconds | Saturation percentage |
|---|---|---|---|
| A | 6497 | 11 | 0.169309% |
| B | 6497 | 282 | 4.340465% |
| C | 6497 | 52 | 0.800369% |
| D | 6497 | 1884 | 28.997999% |
Noise dominated data is calculated using 1-second bins in cleaned event files. If a bin has >2000 counts, and if more than 50% of those come from <1% of pixels, then it is considered to be noise-dominated and hence unusable.
| Quadrant | # 1 sec bins | Bins with >0 counts | Bins with >2000 counts | High rate bins dominated by noise | Noise dominated (total time) | Noise dominated (detector-on time) | Marked lightcurve |
|---|---|---|---|---|---|---|---|
| A | 9124 | 6499 | 2 | 2 | 0.02% | 0.03% | 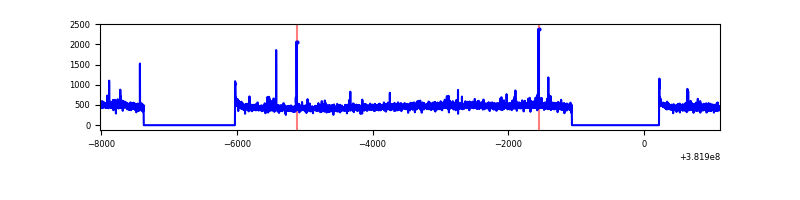 |
| B | 9124 | 6499 | 177 | 177 | 1.94% | 2.72% | 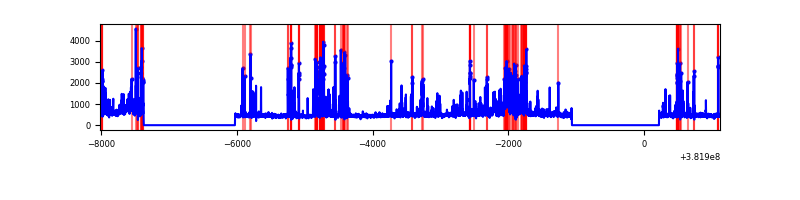 |
| C | 9124 | 6499 | 36 | 36 | 0.39% | 0.55% | 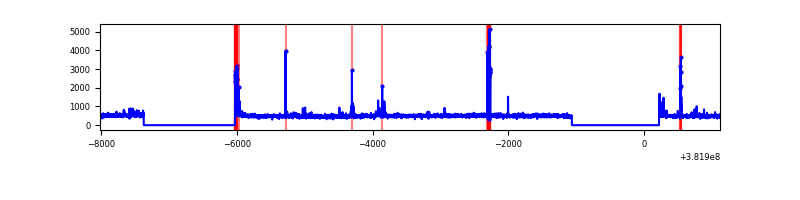 |
| D | 9124 | 6498 | 1760 | 1760 | 19.29% | 27.09% | 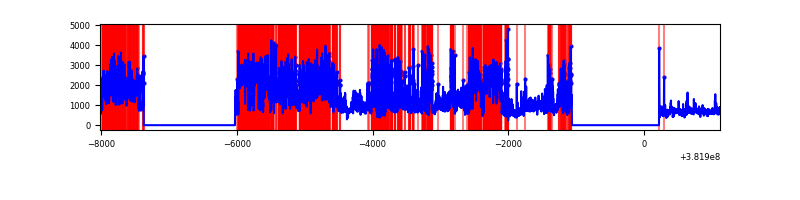 |
Top three noisy pixels from each quadrant. If the there are fewer than three noisy pixels in the level2.evt file, extra rows are filled as -1
| Pixel properties | Quadrant properties | ||||||
|---|---|---|---|---|---|---|---|
| Quadrant | DetID | PixID | Counts | Sigma | Mean | Median | Sigma |
| A | 10 | 83 | 36237 | 234.39 | 752 | 735 | 151.5 |
| A | 9 | 143 | 19146 | 121.55 | 752 | 735 | 151.5 |
| A | 13 | 6 | 13688 | 85.52 | 752 | 735 | 151.5 |
| B | 5 | 172 | 1013093 | 7076.75 | 740 | 721 | 143.1 |
| B | 5 | 200 | 87495 | 606.57 | 740 | 721 | 143.1 |
| B | 0 | 190 | 87487 | 606.52 | 740 | 721 | 143.1 |
| C | 15 | 214 | 270083 | 1594.09 | 727 | 732 | 169.0 |
| C | 15 | 159 | 98322 | 577.56 | 727 | 732 | 169.0 |
| C | 0 | 10 | 83851 | 491.92 | 727 | 732 | 169.0 |
| D | 7 | 223 | 2674333 | 16684.48 | 661 | 641 | 160.3 |
| D | 2 | 249 | 1973900 | 12313.61 | 661 | 641 | 160.3 |
| D | 8 | 195 | 1148642 | 7163.8 | 661 | 641 | 160.3 |
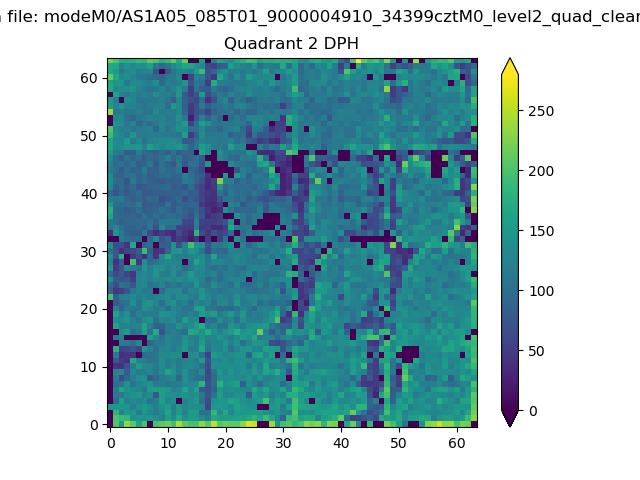
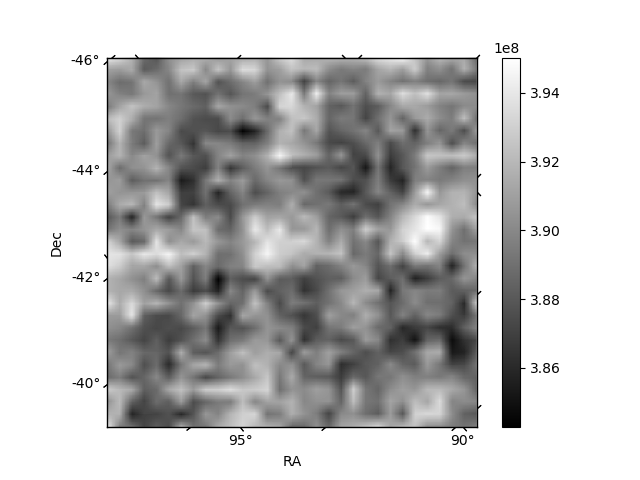
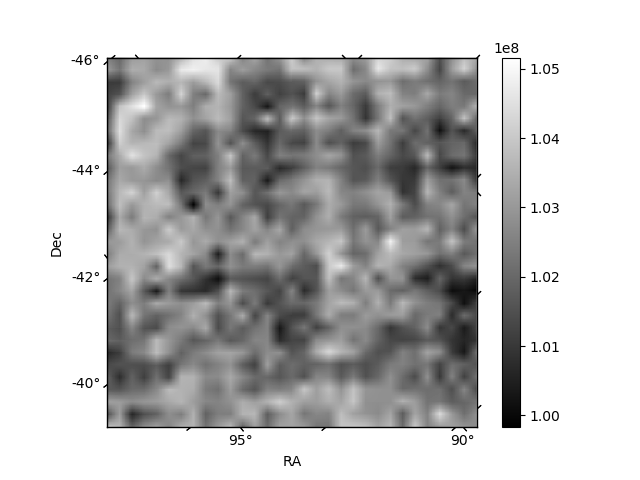
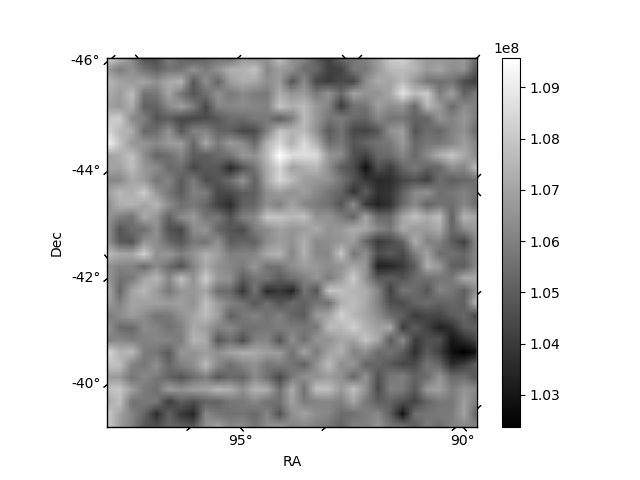
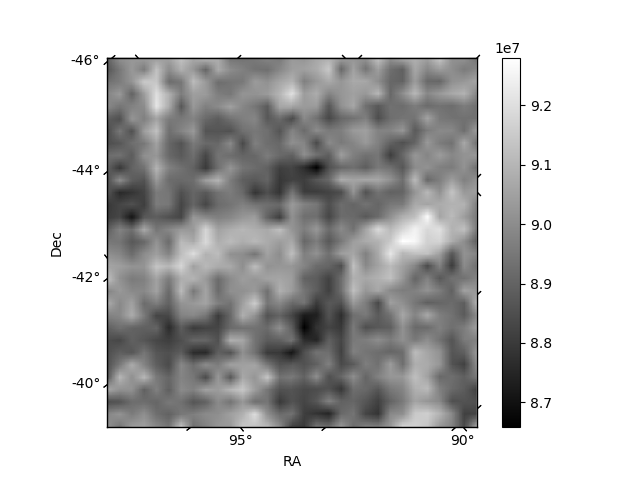
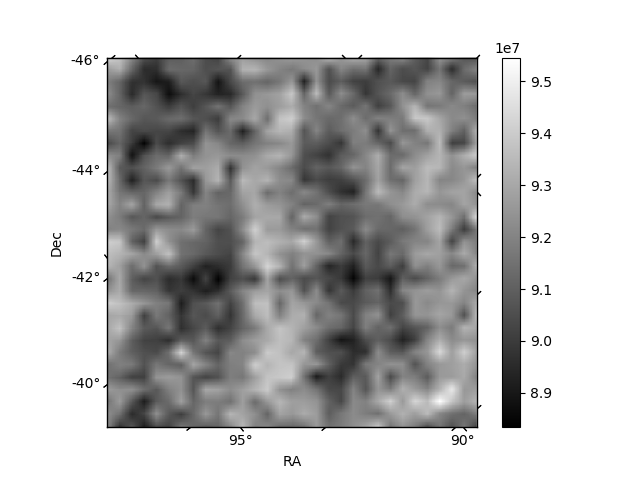
Histogram calculated using DETX and DETY for each event in the final _common_clean file
| Quadrant A | 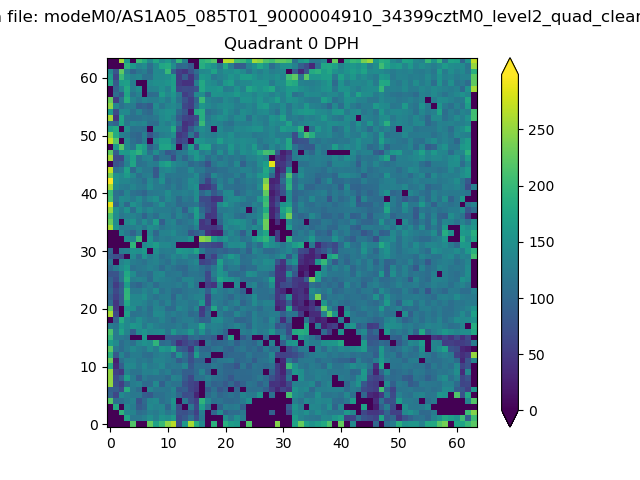 |
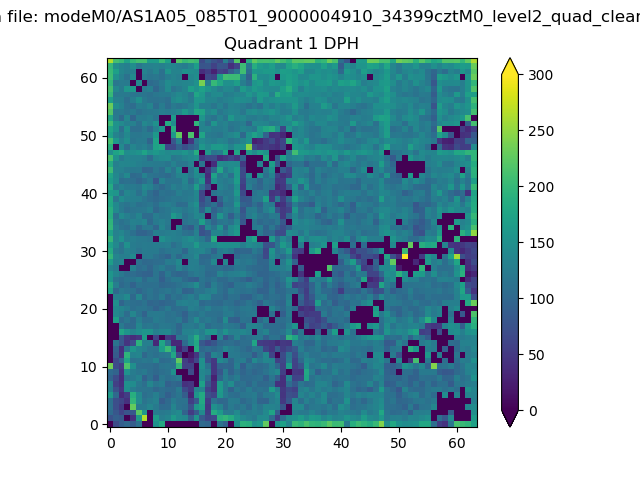 |
Quadrant B |
|---|---|---|---|
| Quadrant D | 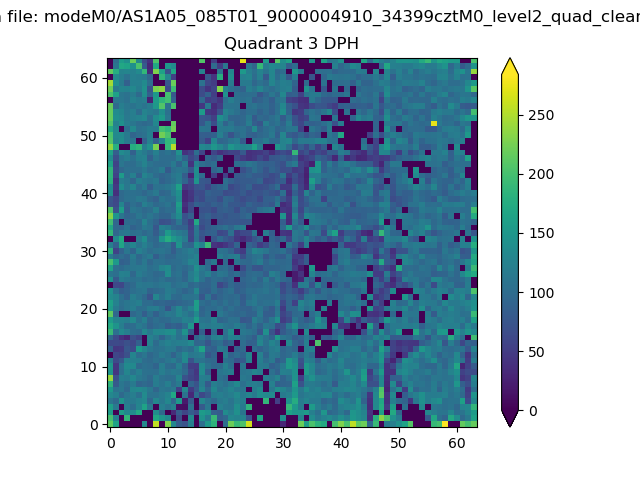 |
 |
Quadrant C |
| Plot type | Count rate plots | Images |
|---|---|---|
| Comparison with Poisson distribution Blue bars denote a histogram of data divided into 1 sec bins. Red curve is a Poisson curve with rate = median count rate of data. |
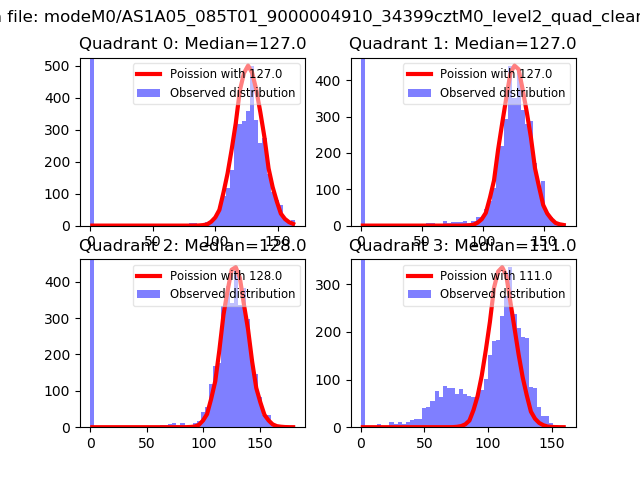 |
 |
| Quadrant-wise count rates Data is divided into 100 sec bins |
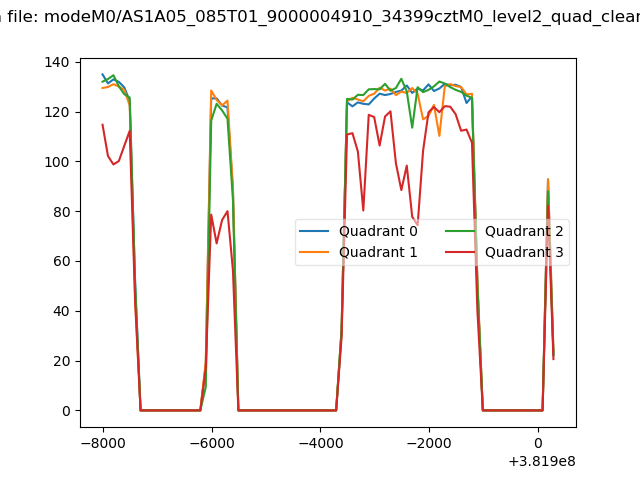 |
|
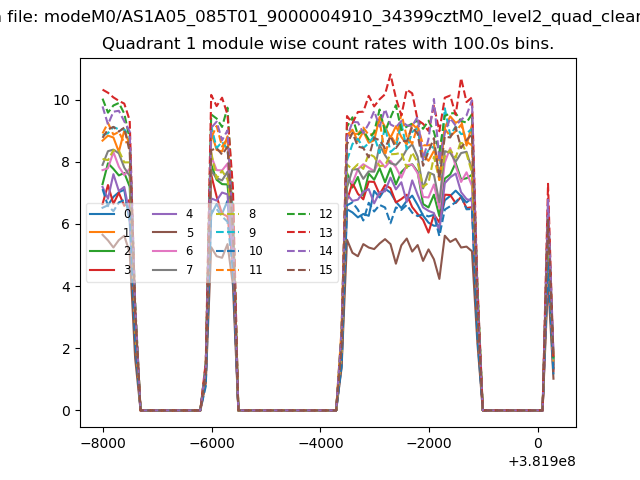
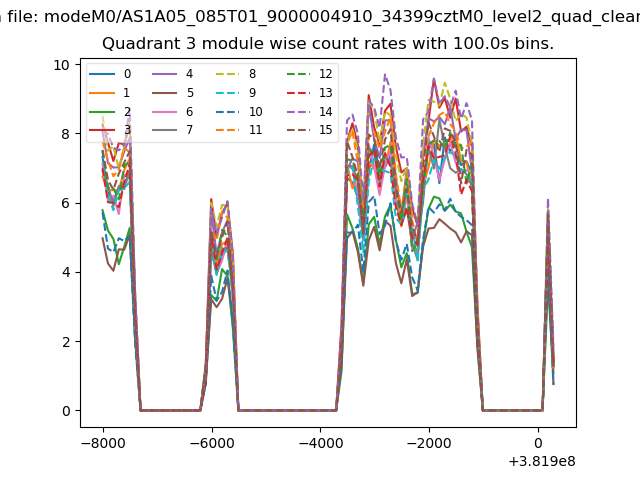
| Module-wise count rates for Quadrant A Data is divided into 100 sec bins |
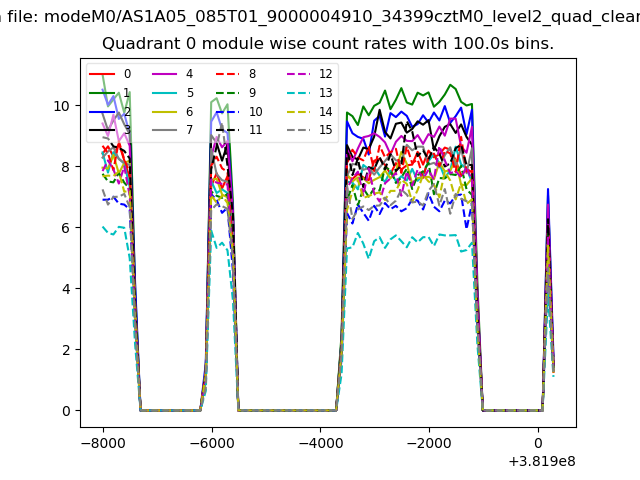 |
 |
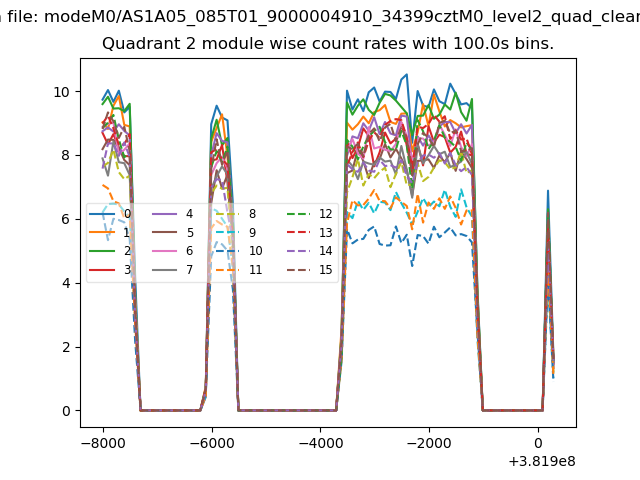
| Module-wise count rates for Quadrant B Data is divided into 100 sec bins |
 |
 |
| Module-wise count rates for Quadrant C Data is divided into 100 sec bins |
 |
 |
| Module-wise count rates for Quadrant D Data is divided into 100 sec bins |
 |
 |
| Parameter | Plot |
|---|---|
| CZT HV Monitor | 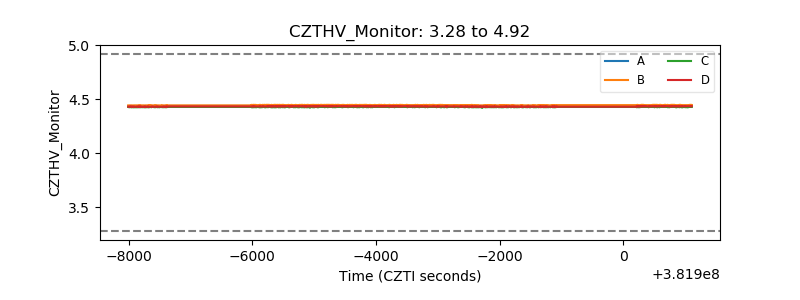 |
| D_VDD | 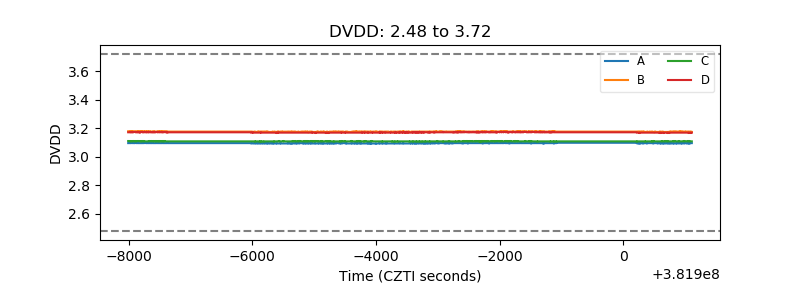 |
| Temperature 1 | 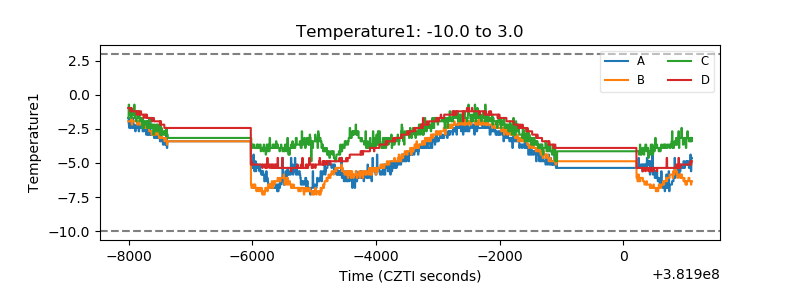 |
| Veto HV Monitor | 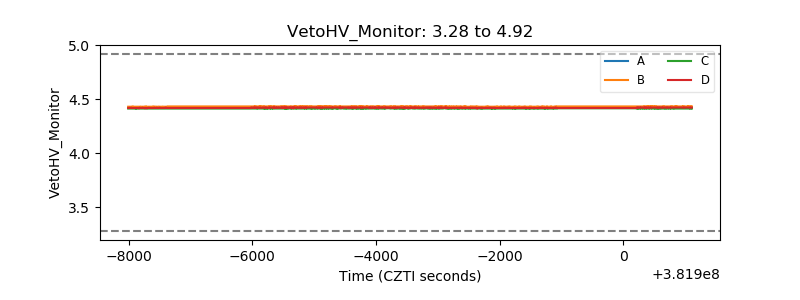 |
| Veto LLD |  |
| Alpha Counter | 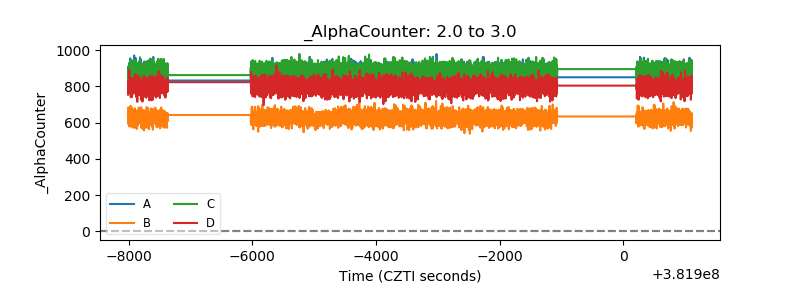 |
| _CPM_Rate | 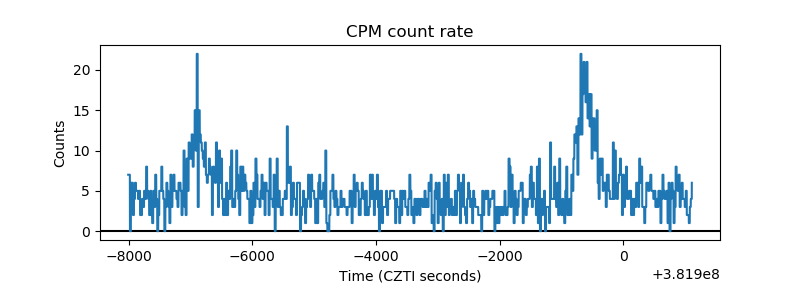 |
| CZT Counter | 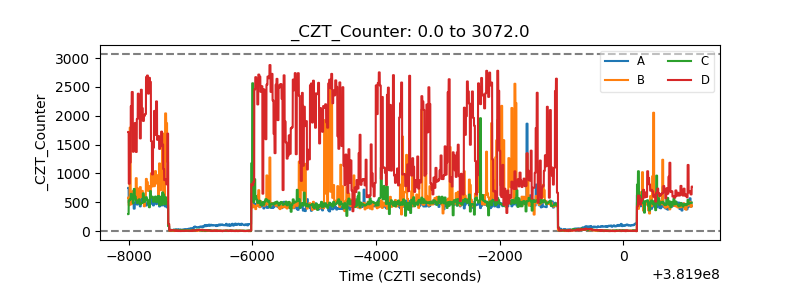 |
| +2.5 Volts monitor | 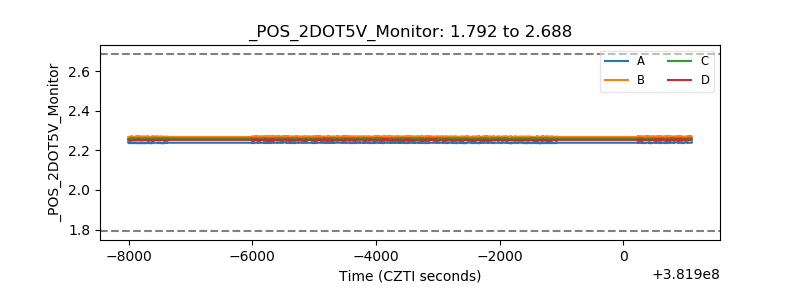 |
| +5 Volts monitor | 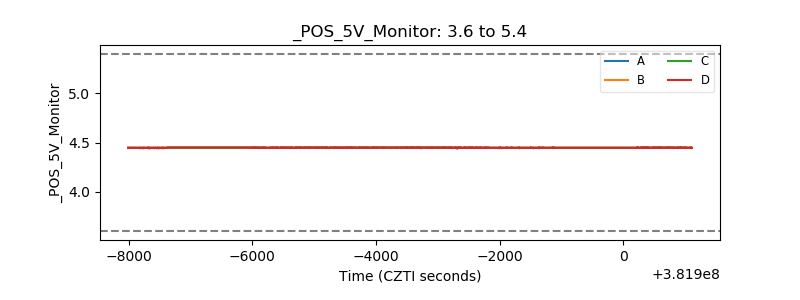 |
| _ROLL_ROT | 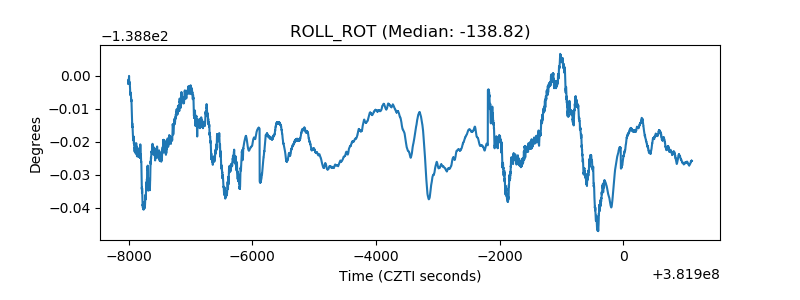 |
| _Roll_DEC | 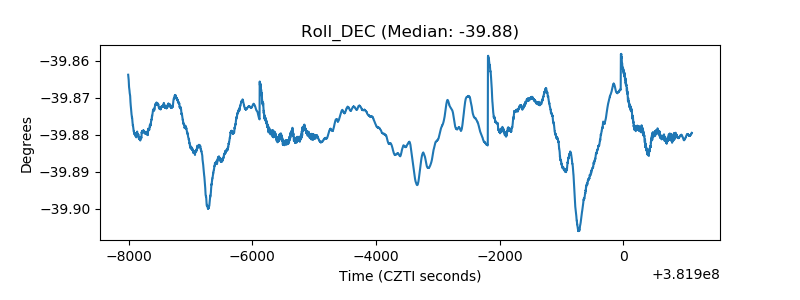 |
| _Roll_RA | 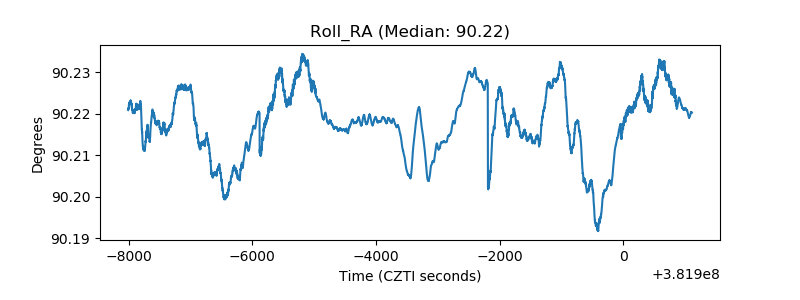 |
| Veto Counter | 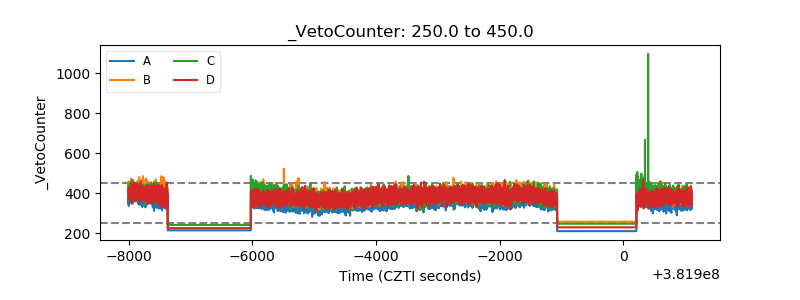 |