| Param | Original file | Final file |
|---|---|---|
| Filename | modeM0/AS1A05_085T01_9000004910_34398cztM0_level2.evt | modeM0/AS1A05_085T01_9000004910_34398cztM0_level2_quad_clean.evt |
| Size (bytes) | 720,167,040 | 66,605,760 |
| Size | 686.8 MB | 63.5 MB |
| Events in quadrant A | 2,702,388 | 435,074 |
| Events in quadrant B | 3,341,518 | 433,312 |
| Events in quadrant C | 3,127,069 | 434,982 |
| Events in quadrant D | 12,245,145 | 304,710 |
| Mode SS | |||
|---|---|---|---|
| Quadrant | BADHDUFLAG | Total packets | Discarded packets |
| A | 0 | 122 | 0 |
| B | 0 | 122 | 0 |
| C | 0 | 122 | 0 |
| D | 0 | 122 | 0 |
| Mode M9 | |||
|---|---|---|---|
| Quadrant | BADHDUFLAG | Total packets | Discarded packets |
| A | 0 | 28 | 0 |
| B | 0 | 28 | 0 |
| C | 0 | 28 | 0 |
| D | 0 | 28 | 0 |
| Mode M0 | |||
|---|---|---|---|
| Quadrant | BADHDUFLAG | Total packets | Discarded packets |
| A | 0 | 11906 | 3 |
| B | 0 | 13793 | 2 |
| C | 0 | 12659 | 2 |
| D | 0 | 40342 | 2 |
| Quadrant | Total seconds | Saturated seconds | Saturation percentage |
|---|---|---|---|
| A | 5828 | 15 | 0.257378% |
| B | 5828 | 141 | 2.419355% |
| C | 5828 | 66 | 1.132464% |
| D | 5828 | 3321 | 56.983528% |
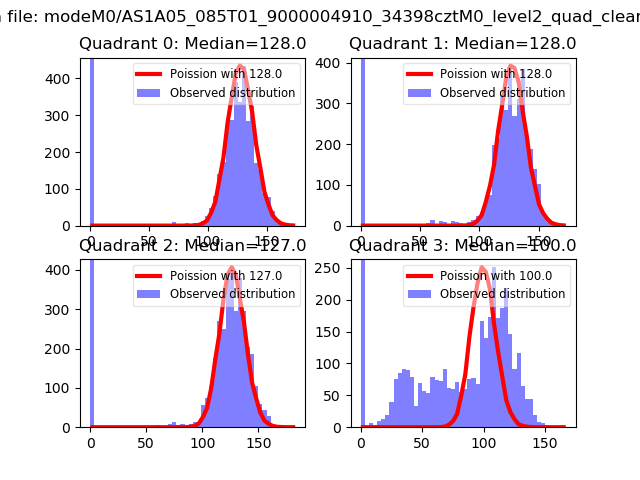
Noise dominated data is calculated using 1-second bins in cleaned event files. If a bin has >2000 counts, and if more than 50% of those come from <1% of pixels, then it is considered to be noise-dominated and hence unusable.
| Quadrant | # 1 sec bins | Bins with >0 counts | Bins with >2000 counts | High rate bins dominated by noise | Noise dominated (total time) | Noise dominated (detector-on time) | Marked lightcurve |
|---|---|---|---|---|---|---|---|
| A | 8726 | 5830 | 8 | 8 | 0.09% | 0.14% | 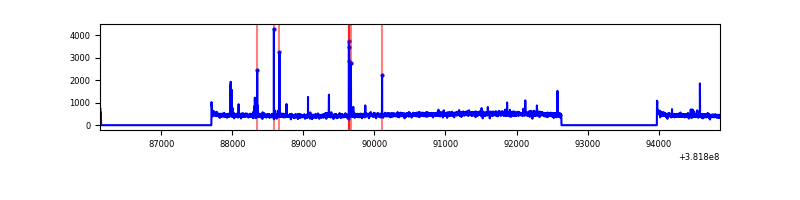 |
| B | 8726 | 5830 | 96 | 96 | 1.10% | 1.65% | 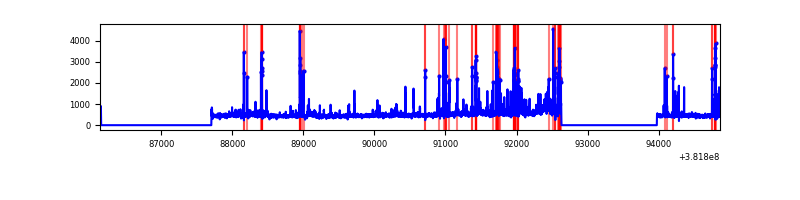 |
| C | 8726 | 5830 | 61 | 61 | 0.70% | 1.05% | 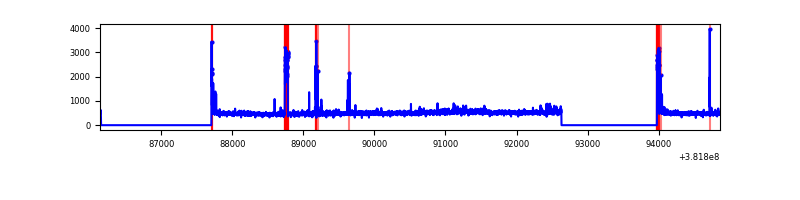 |
| D | 8725 | 5828 | 3239 | 3239 | 37.12% | 55.58% | 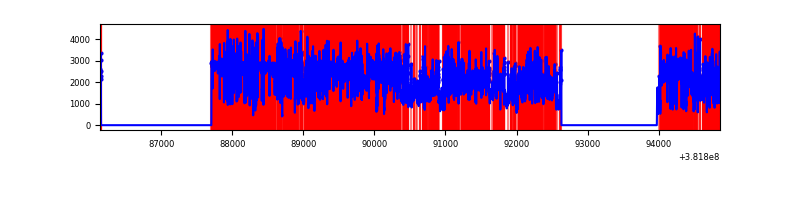 |
Top three noisy pixels from each quadrant. If the there are fewer than three noisy pixels in the level2.evt file, extra rows are filled as -1
| Pixel properties | Quadrant properties | ||||||
|---|---|---|---|---|---|---|---|
| Quadrant | DetID | PixID | Counts | Sigma | Mean | Median | Sigma |
| A | 9 | 143 | 63974 | 475.71 | 670 | 657 | 133.1 |
| A | 10 | 83 | 34690 | 255.69 | 670 | 657 | 133.1 |
| A | 13 | 254 | 11003 | 77.73 | 670 | 657 | 133.1 |
| B | 5 | 172 | 458296 | 3582.99 | 663 | 645 | 127.7 |
| B | 0 | 190 | 121425 | 945.6 | 663 | 645 | 127.7 |
| B | 5 | 255 | 71577 | 555.33 | 663 | 645 | 127.7 |
| C | 15 | 214 | 245273 | 1609.33 | 651 | 655 | 152.0 |
| C | 15 | 159 | 112920 | 738.59 | 651 | 655 | 152.0 |
| C | 0 | 10 | 95154 | 621.7 | 651 | 655 | 152.0 |
| D | 7 | 223 | 7776936 | 62586.17 | 511 | 494 | 124.3 |
| D | 8 | 195 | 795631 | 6399.4 | 511 | 494 | 124.3 |
| D | 1 | 3 | 740219 | 5953.44 | 511 | 494 | 124.3 |
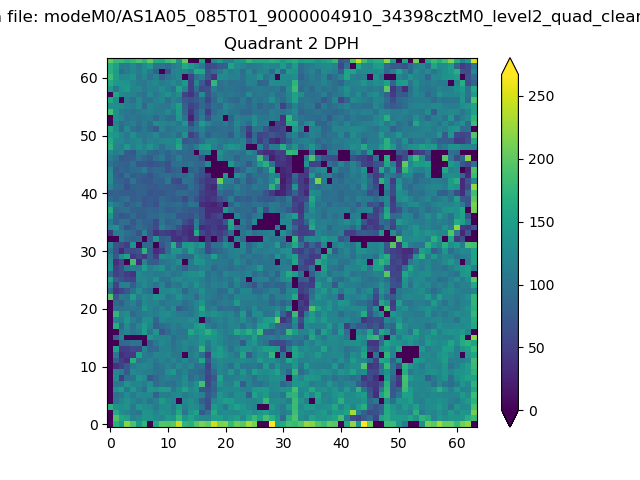
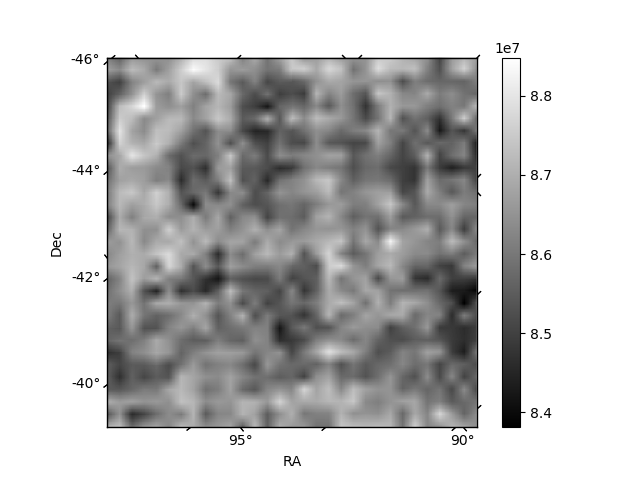
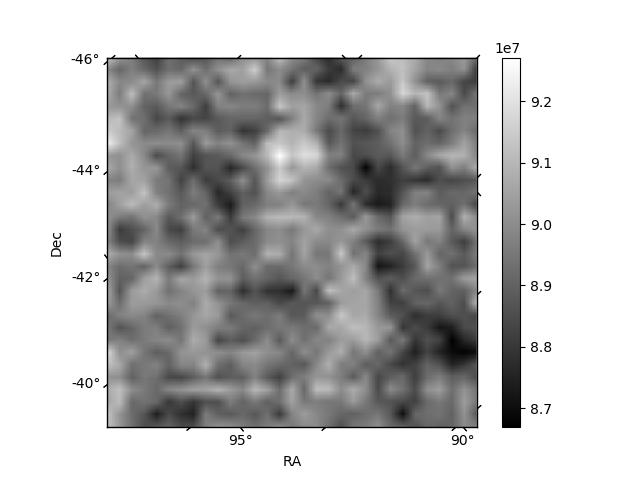
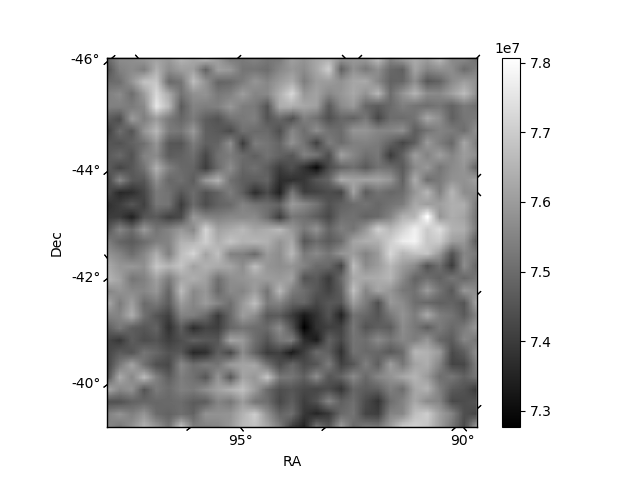
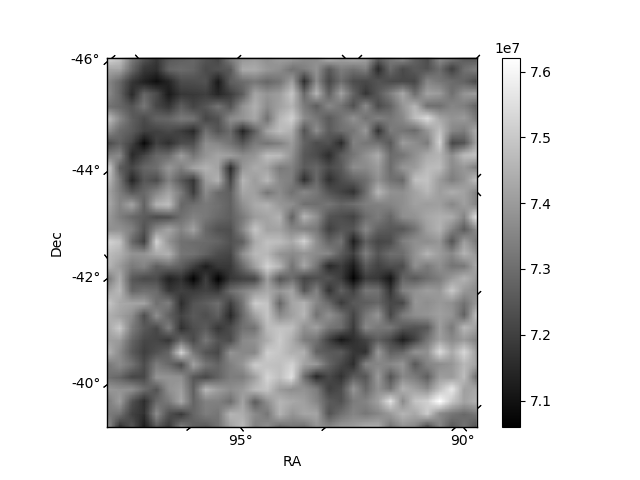
Histogram calculated using DETX and DETY for each event in the final _common_clean file
| Quadrant A | 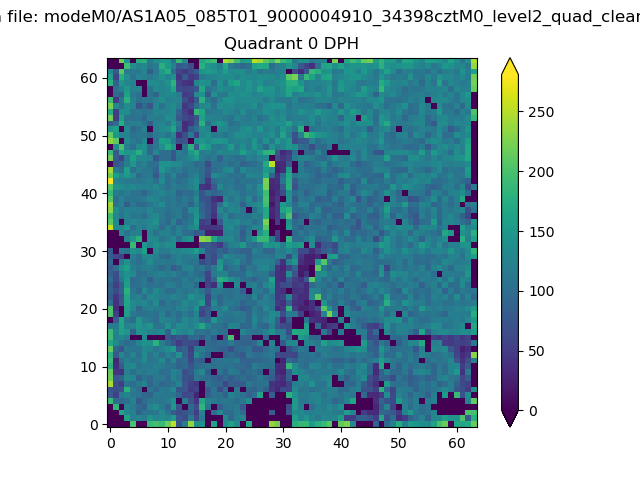 |
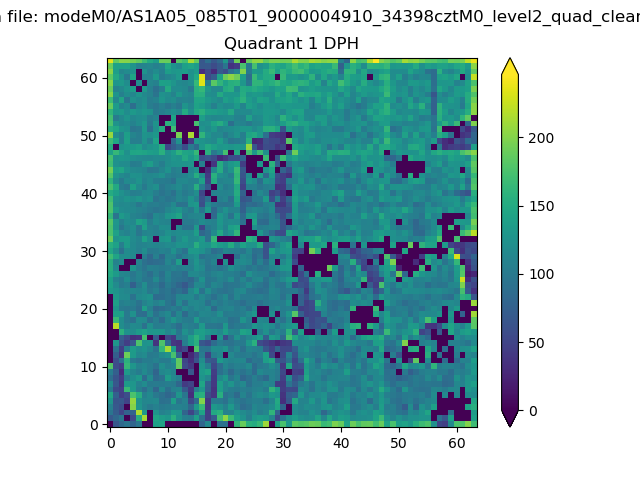 |
Quadrant B |
|---|---|---|---|
| Quadrant D | 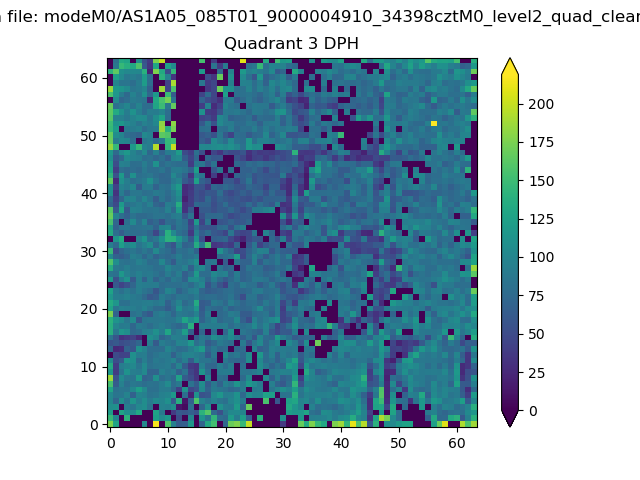 |
 |
Quadrant C |
| Plot type | Count rate plots | Images |
|---|---|---|
| Comparison with Poisson distribution Blue bars denote a histogram of data divided into 1 sec bins. Red curve is a Poisson curve with rate = median count rate of data. |
 |
 |
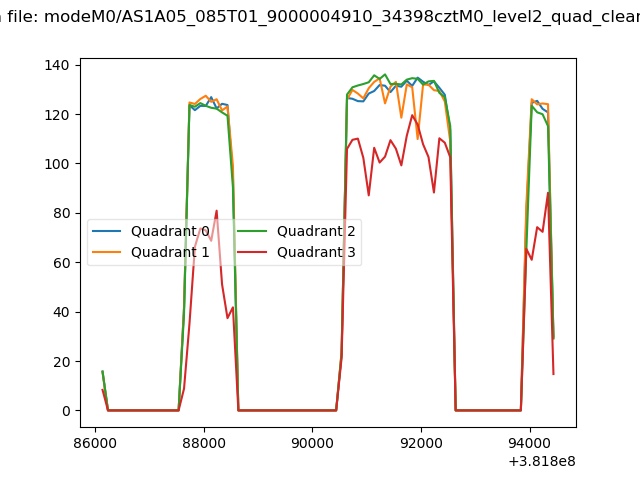
| Quadrant-wise count rates Data is divided into 100 sec bins |
 |
|
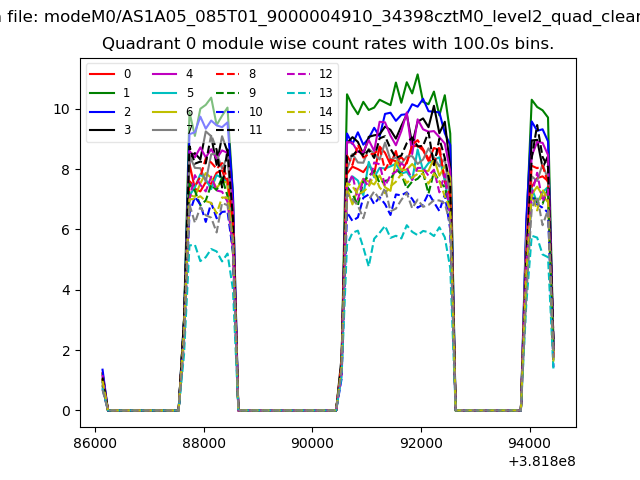
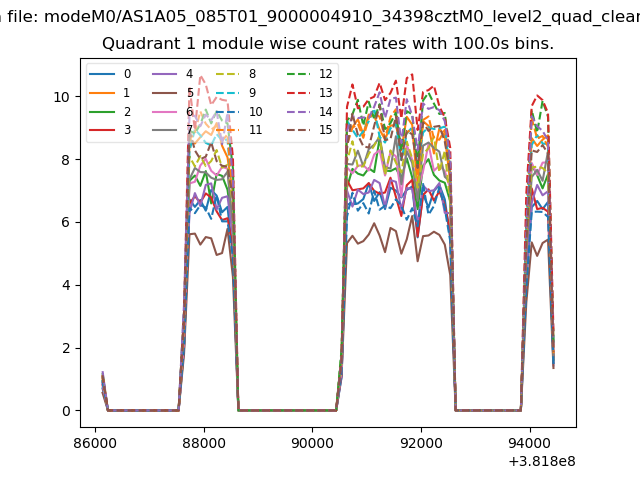
| Module-wise count rates for Quadrant A Data is divided into 100 sec bins |
 |
 |
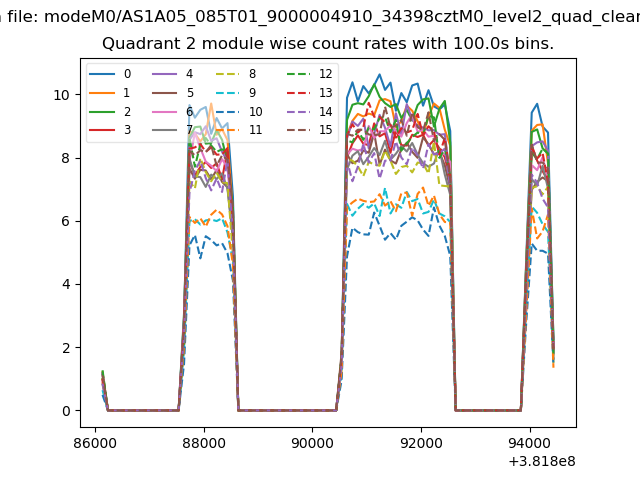
| Module-wise count rates for Quadrant B Data is divided into 100 sec bins |
 |
 |
| Module-wise count rates for Quadrant C Data is divided into 100 sec bins |
 |
 |
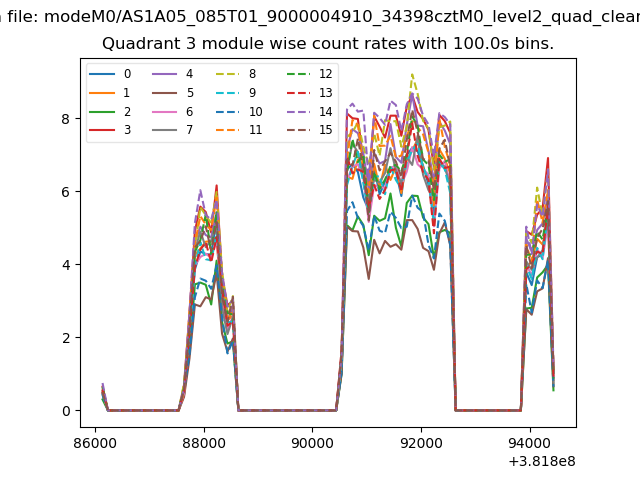
| Module-wise count rates for Quadrant D Data is divided into 100 sec bins |
 |
 |
| Parameter | Plot |
|---|---|
| CZT HV Monitor | 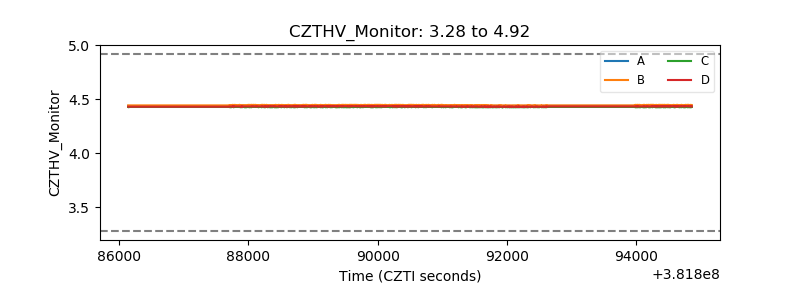 |
| D_VDD | 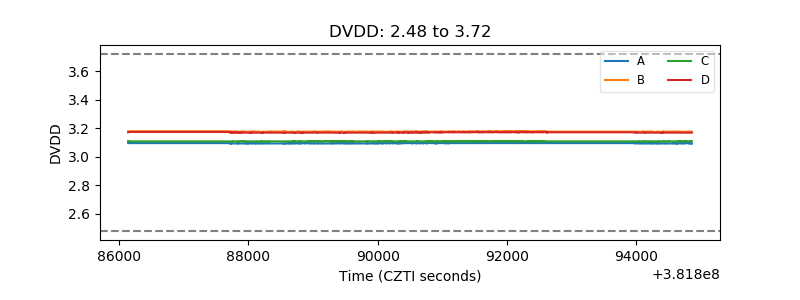 |
| Temperature 1 | 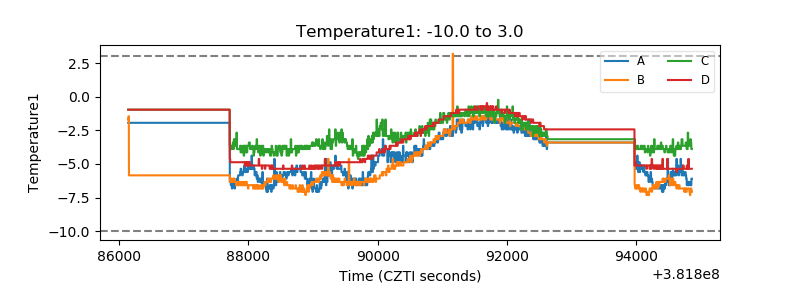 |
| Veto HV Monitor | 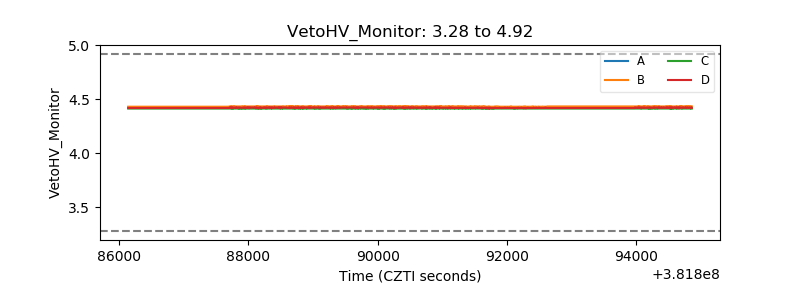 |
| Veto LLD | 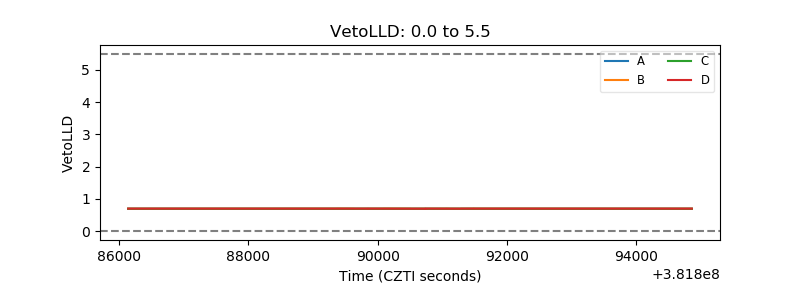 |
| Alpha Counter | 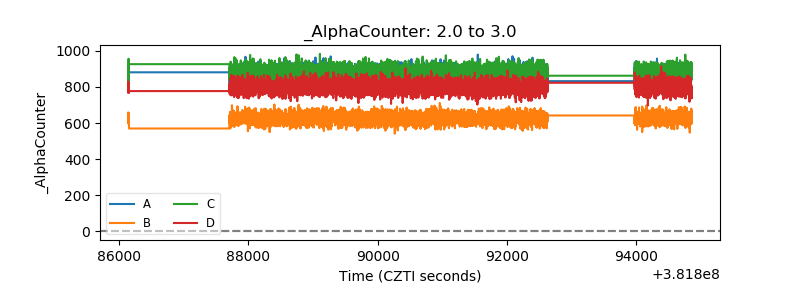 |
| _CPM_Rate | 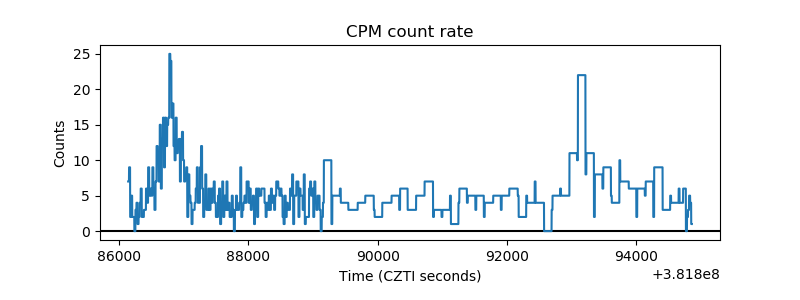 |
| CZT Counter | 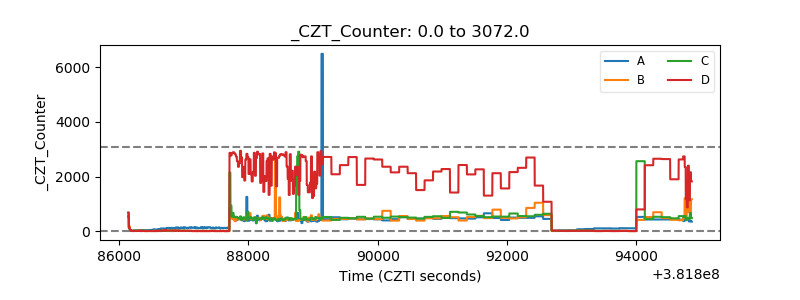 |
| +2.5 Volts monitor | 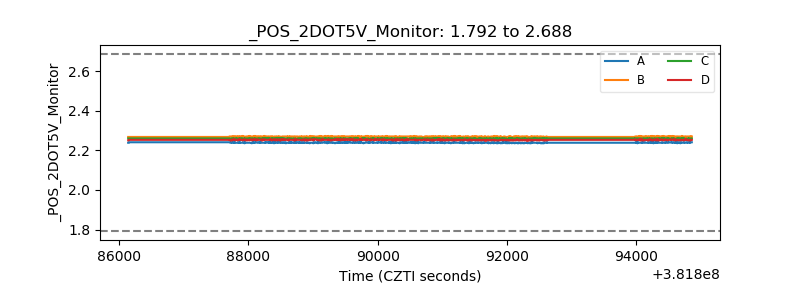 |
| +5 Volts monitor | 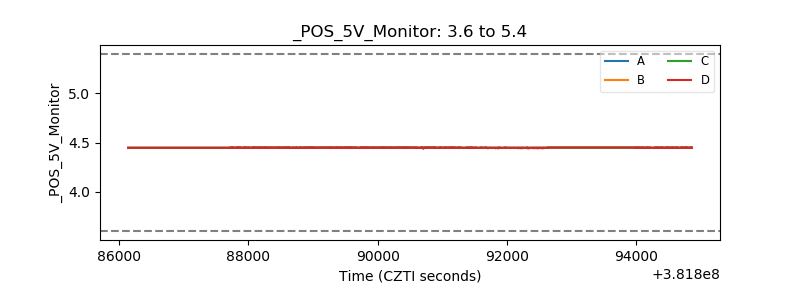 |
| _ROLL_ROT | 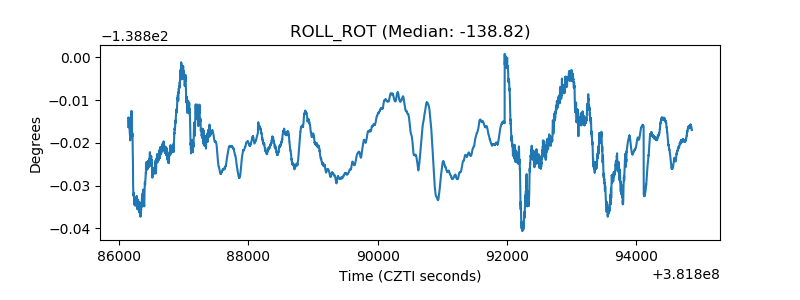 |
| _Roll_DEC | 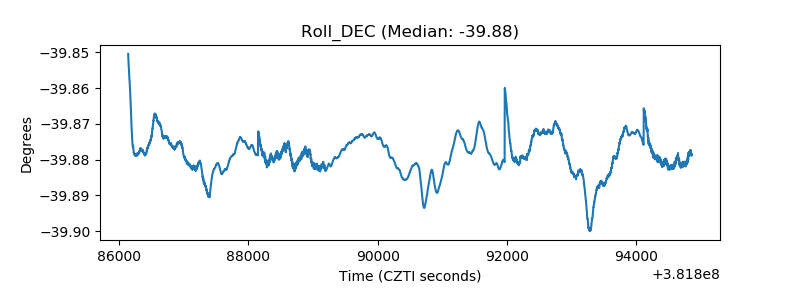 |
| _Roll_RA | 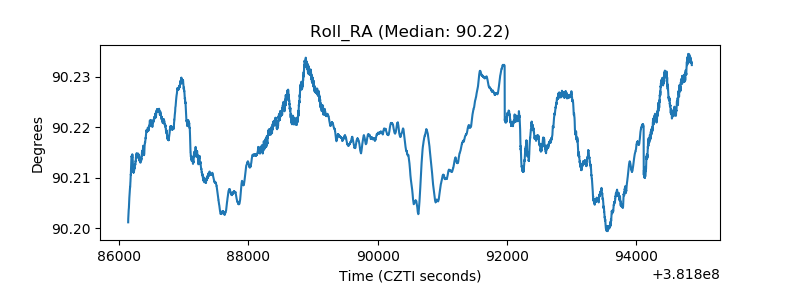 |
| Veto Counter | 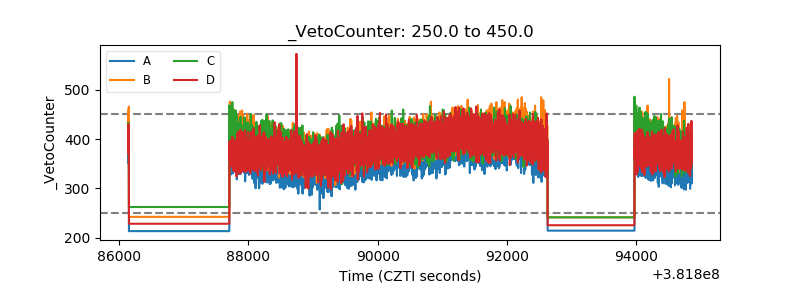 |