| Param | Original file | Final file |
|---|---|---|
| Filename | modeM0/AS1A05_085T01_9000004910_34397cztM0_level2.evt | modeM0/AS1A05_085T01_9000004910_34397cztM0_level2_quad_clean.evt |
| Size (bytes) | 616,492,800 | 70,692,480 |
| Size | 587.9 MB | 67.4 MB |
| Events in quadrant A | 2,595,976 | 464,772 |
| Events in quadrant B | 3,141,796 | 463,343 |
| Events in quadrant C | 2,870,815 | 462,782 |
| Events in quadrant D | 9,678,396 | 352,684 |
| Mode SS | |||
|---|---|---|---|
| Quadrant | BADHDUFLAG | Total packets | Discarded packets |
| A | 0 | 116 | 0 |
| B | 0 | 116 | 0 |
| C | 0 | 116 | 0 |
| D | 0 | 116 | 0 |
| Mode M9 | |||
|---|---|---|---|
| Quadrant | BADHDUFLAG | Total packets | Discarded packets |
| A | 0 | 26 | 0 |
| B | 0 | 26 | 0 |
| C | 0 | 26 | 0 |
| D | 0 | 27 | 0 |
| Mode M0 | |||
|---|---|---|---|
| Quadrant | BADHDUFLAG | Total packets | Discarded packets |
| A | 0 | 11550 | 3 |
| B | 0 | 13042 | 2 |
| C | 0 | 11833 | 2 |
| D | 0 | 32733 | 2 |
| Quadrant | Total seconds | Saturated seconds | Saturation percentage |
|---|---|---|---|
| A | 5667 | 13 | 0.229398% |
| B | 5667 | 104 | 1.835186% |
| C | 5667 | 18 | 0.317628% |
| D | 5667 | 2010 | 35.468502% |
Noise dominated data is calculated using 1-second bins in cleaned event files. If a bin has >2000 counts, and if more than 50% of those come from <1% of pixels, then it is considered to be noise-dominated and hence unusable.
| Quadrant | # 1 sec bins | Bins with >0 counts | Bins with >2000 counts | High rate bins dominated by noise | Noise dominated (total time) | Noise dominated (detector-on time) | Marked lightcurve |
|---|---|---|---|---|---|---|---|
| A | 7221 | 5668 | 3 | 3 | 0.04% | 0.05% | 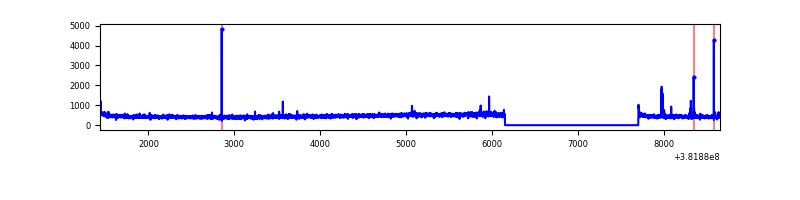 |
| B | 7221 | 5668 | 67 | 67 | 0.93% | 1.18% | 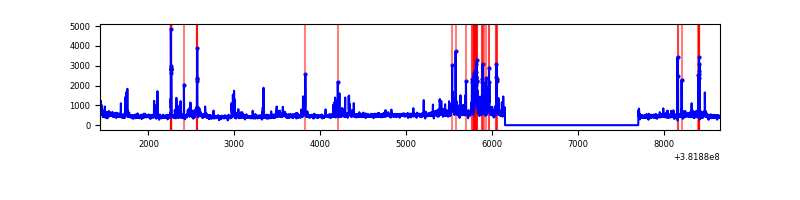 |
| C | 7221 | 5668 | 9 | 9 | 0.12% | 0.16% | 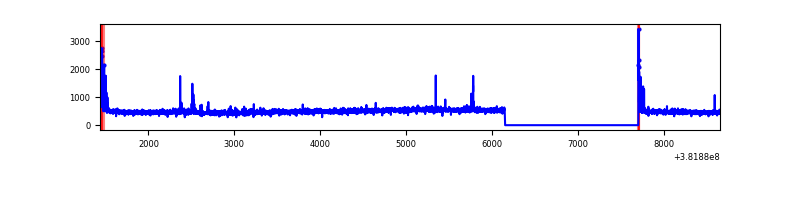 |
| D | 7221 | 5668 | 1987 | 1987 | 27.52% | 35.06% | 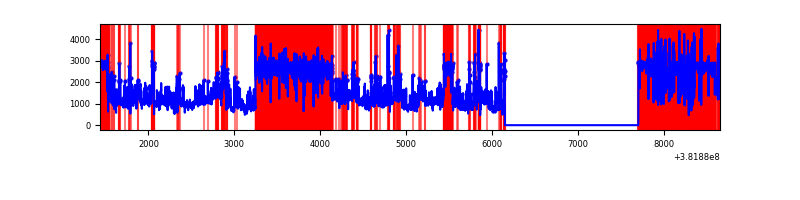 |
Top three noisy pixels from each quadrant. If the there are fewer than three noisy pixels in the level2.evt file, extra rows are filled as -1
| Pixel properties | Quadrant properties | ||||||
|---|---|---|---|---|---|---|---|
| Quadrant | DetID | PixID | Counts | Sigma | Mean | Median | Sigma |
| A | 9 | 143 | 39606 | 296.41 | 650 | 638 | 131.5 |
| A | 10 | 83 | 34144 | 254.86 | 650 | 638 | 131.5 |
| A | 13 | 254 | 10464 | 74.74 | 650 | 638 | 131.5 |
| B | 5 | 172 | 328078 | 2635.98 | 647 | 629 | 124.2 |
| B | 0 | 190 | 133850 | 1072.44 | 647 | 629 | 124.2 |
| B | 5 | 255 | 43465 | 344.83 | 647 | 629 | 124.2 |
| C | 15 | 214 | 239852 | 1620.71 | 635 | 638 | 147.6 |
| C | 0 | 10 | 88119 | 592.7 | 635 | 638 | 147.6 |
| C | 7 | 220 | 23351 | 153.88 | 635 | 638 | 147.6 |
| D | 7 | 223 | 5979006 | 46416.36 | 526 | 511 | 128.8 |
| D | 8 | 195 | 1029421 | 7988.34 | 526 | 511 | 128.8 |
| D | 13 | 249 | 145871 | 1128.56 | 526 | 511 | 128.8 |
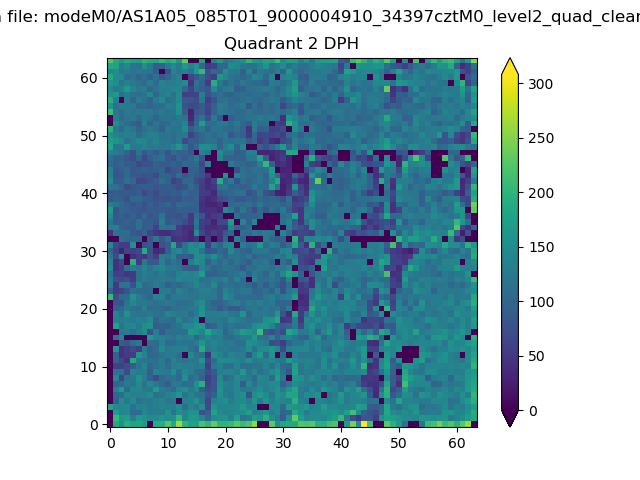
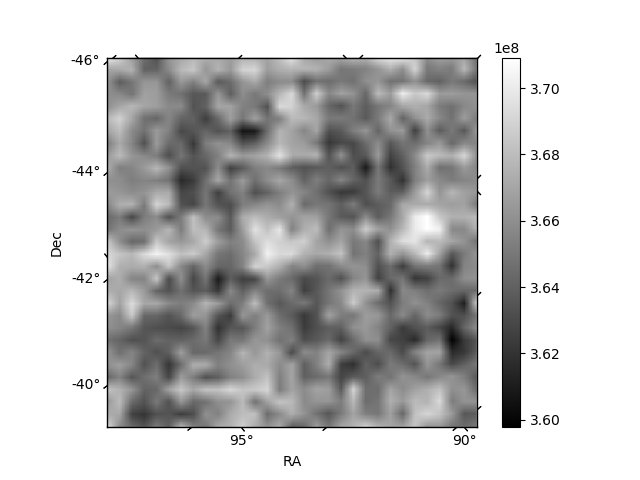
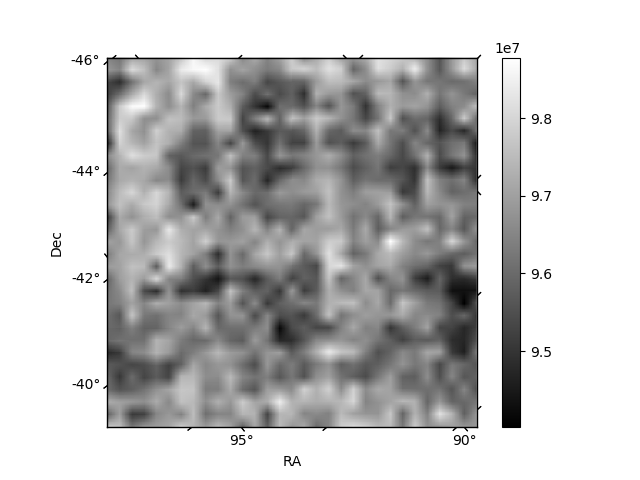
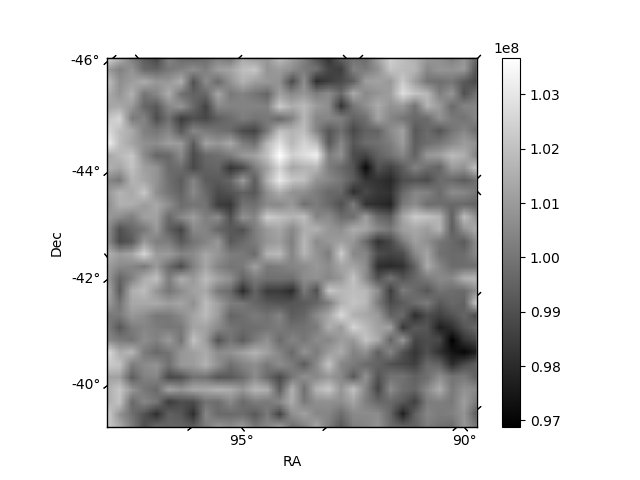
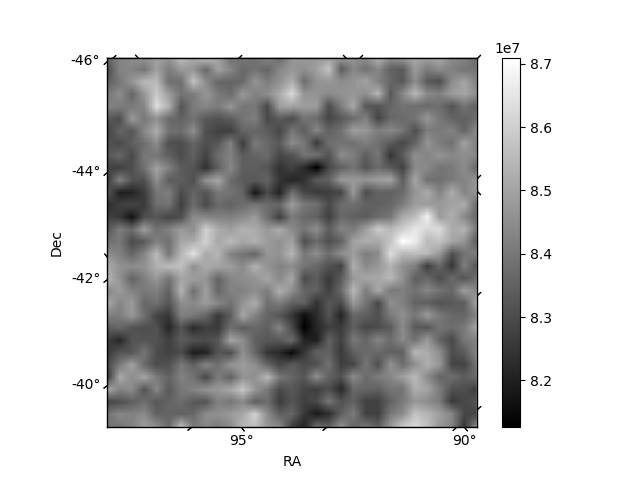
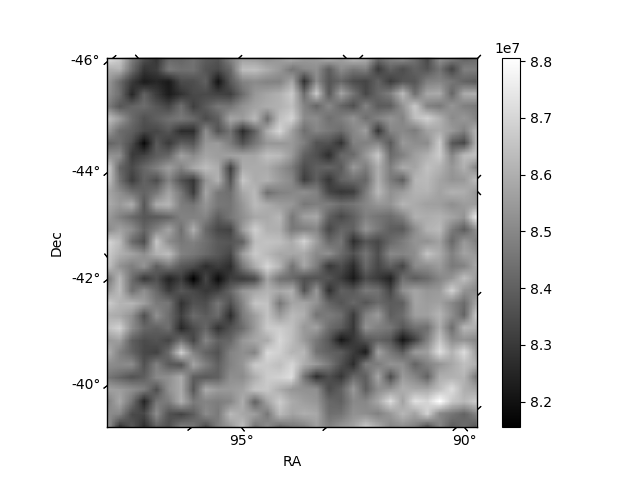
Histogram calculated using DETX and DETY for each event in the final _common_clean file
| Quadrant A | 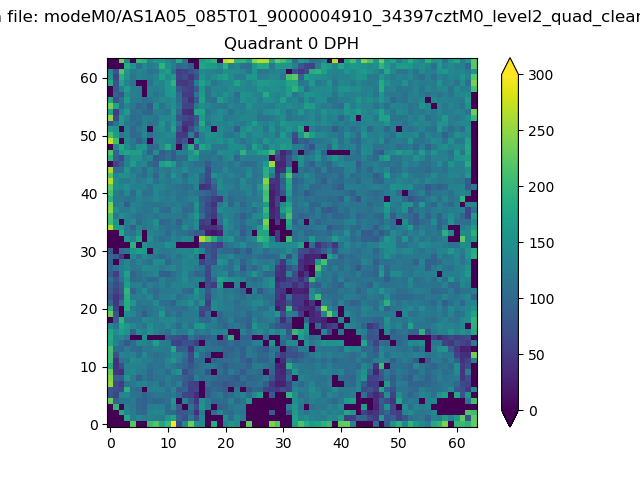 |
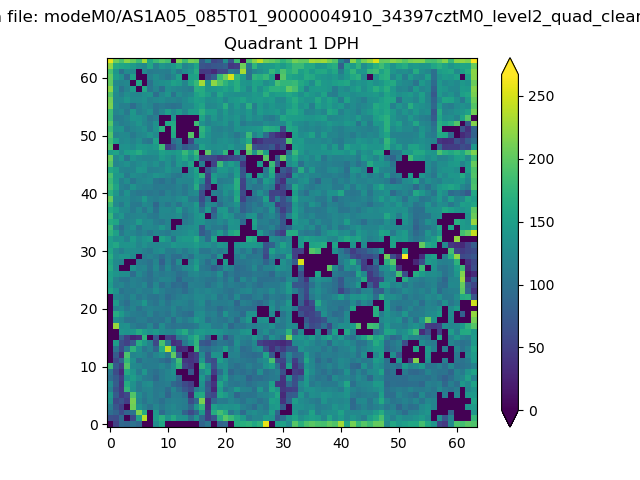 |
Quadrant B |
|---|---|---|---|
| Quadrant D | 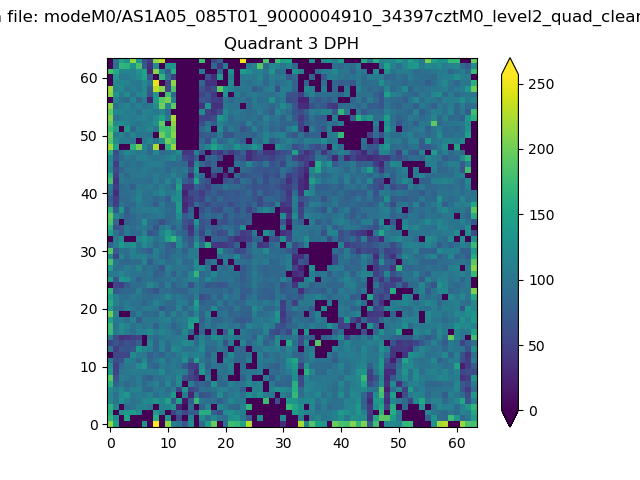 |
 |
Quadrant C |
| Plot type | Count rate plots | Images |
|---|---|---|
| Comparison with Poisson distribution Blue bars denote a histogram of data divided into 1 sec bins. Red curve is a Poisson curve with rate = median count rate of data. |
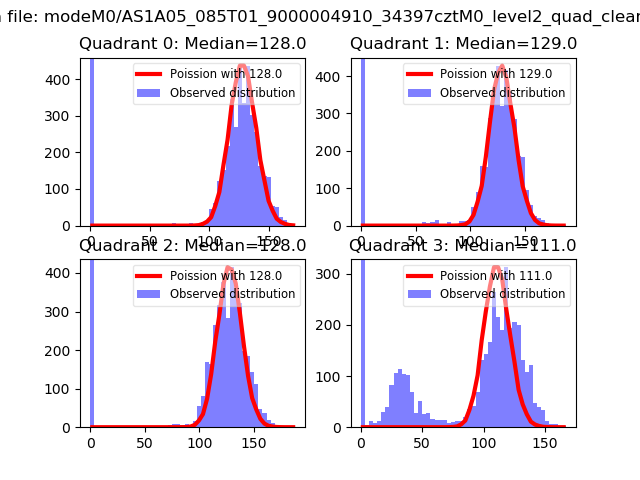 |
 |
| Quadrant-wise count rates Data is divided into 100 sec bins |
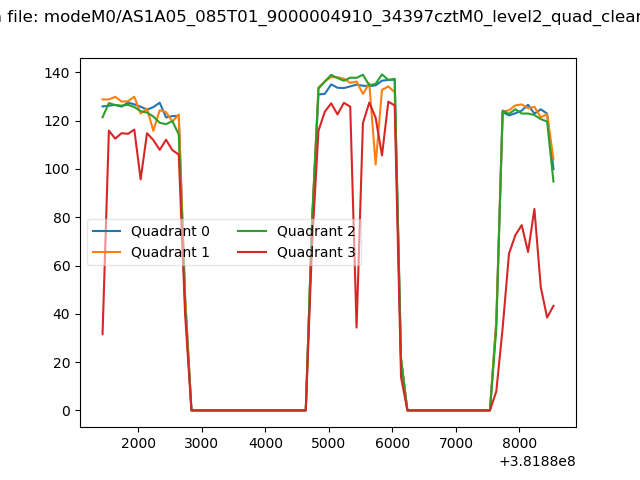 |
|
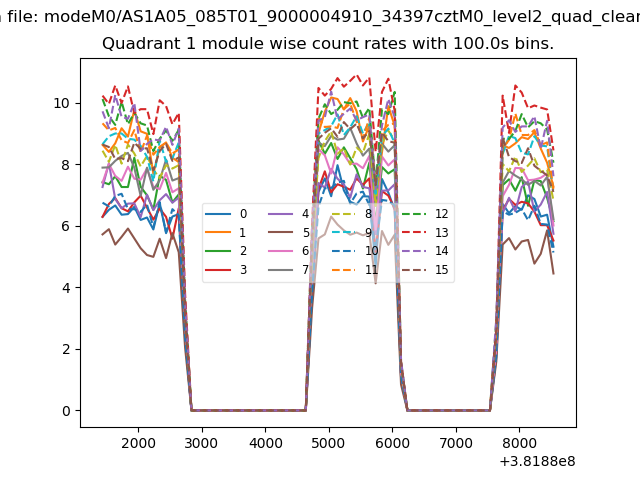
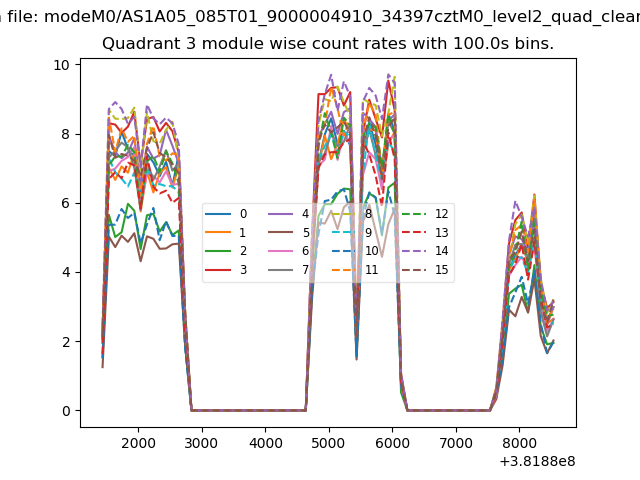
| Module-wise count rates for Quadrant A Data is divided into 100 sec bins |
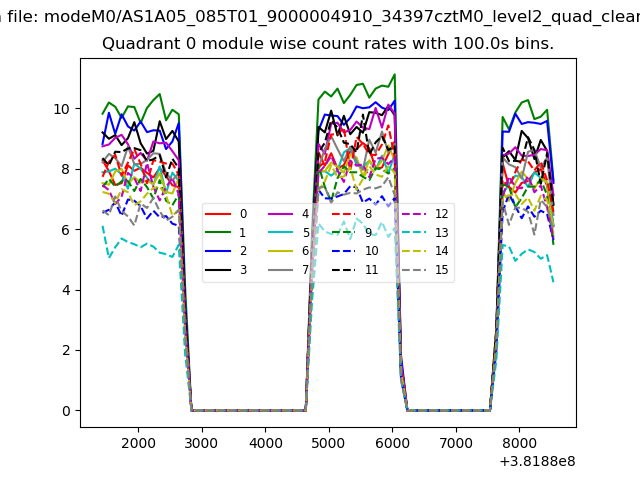 |
 |
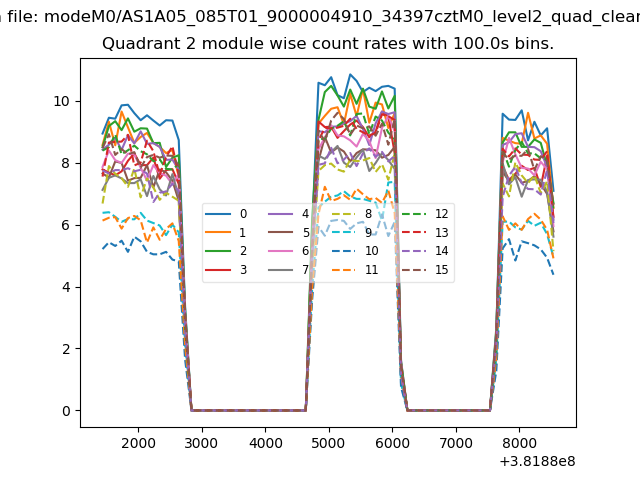
| Module-wise count rates for Quadrant B Data is divided into 100 sec bins |
 |
 |
| Module-wise count rates for Quadrant C Data is divided into 100 sec bins |
 |
 |
| Module-wise count rates for Quadrant D Data is divided into 100 sec bins |
 |
 |
| Parameter | Plot |
|---|---|
| CZT HV Monitor | 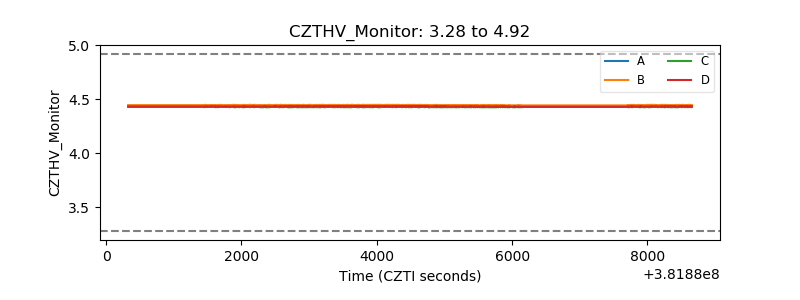 |
| D_VDD | 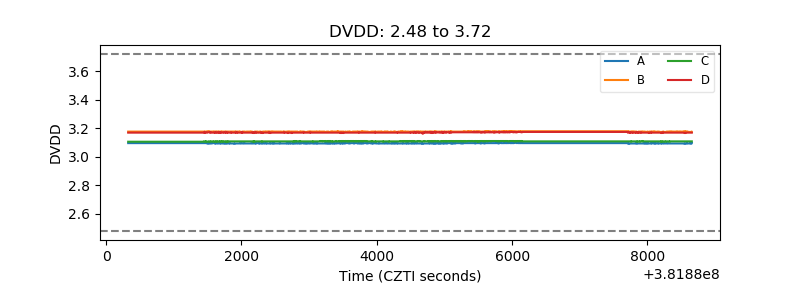 |
| Temperature 1 | 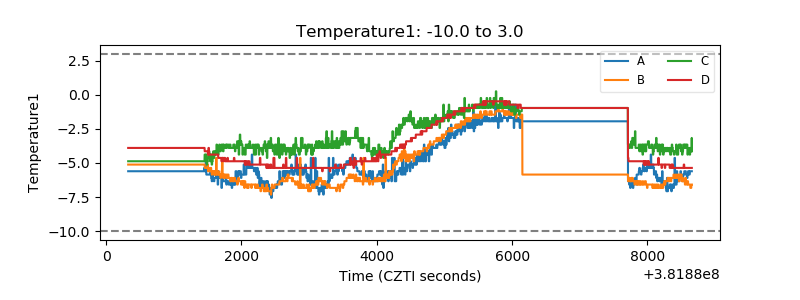 |
| Veto HV Monitor | 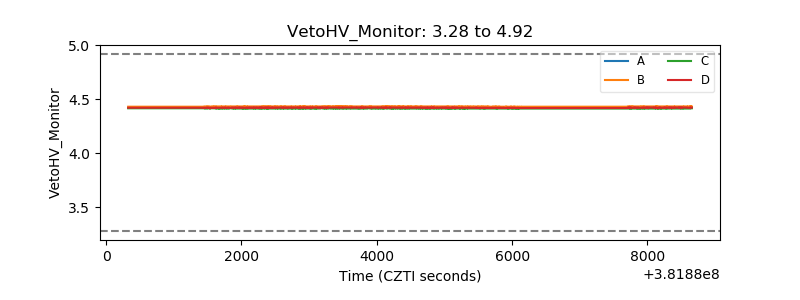 |
| Veto LLD | 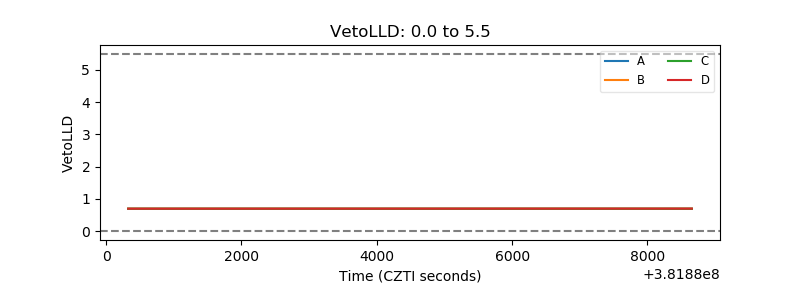 |
| Alpha Counter | 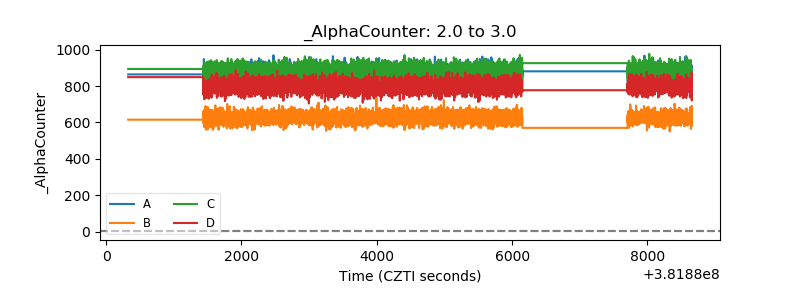 |
| _CPM_Rate | 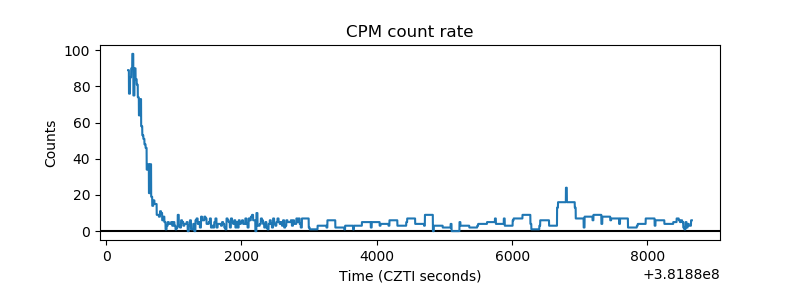 |
| CZT Counter | 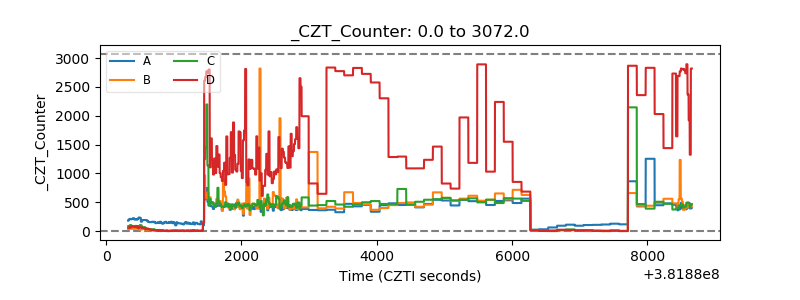 |
| +2.5 Volts monitor | 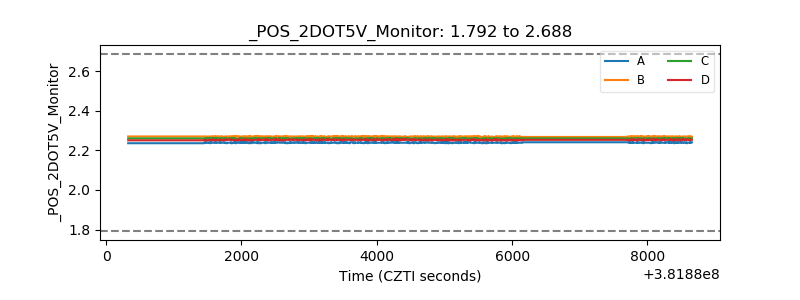 |
| +5 Volts monitor | 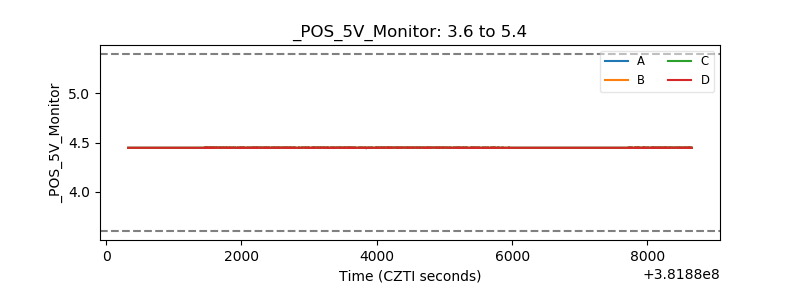 |
| _ROLL_ROT | 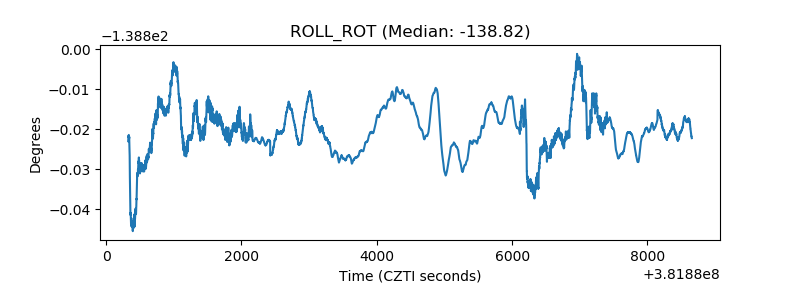 |
| _Roll_DEC | 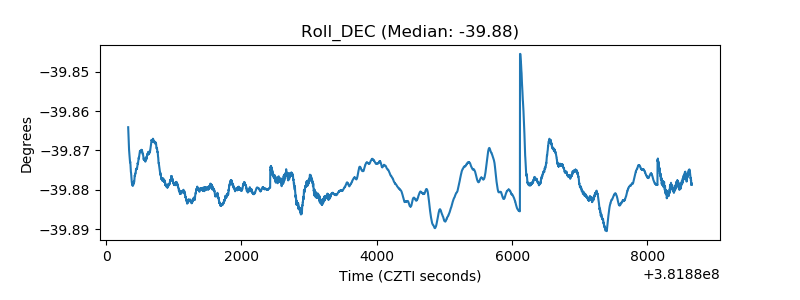 |
| _Roll_RA | 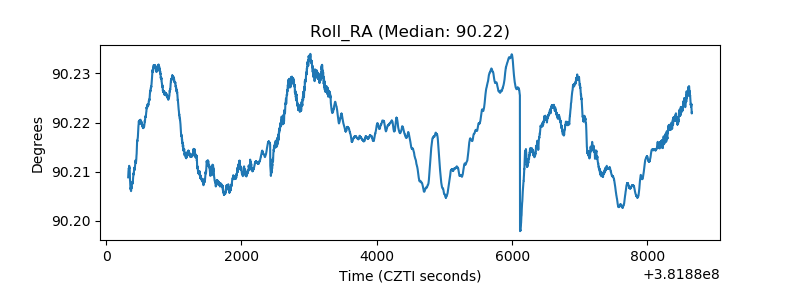 |
| Veto Counter | 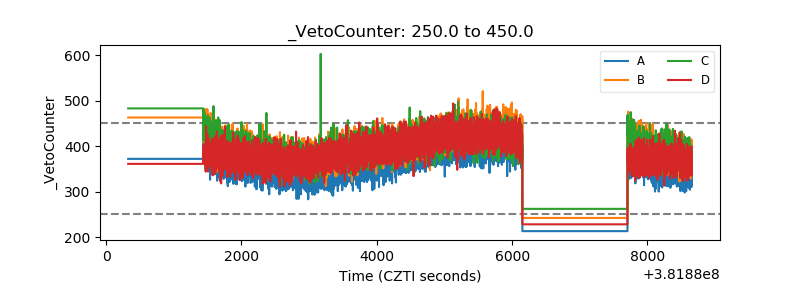 |