| Param | Original file | Final file |
|---|---|---|
| Filename | modeM0/AS1A05_085T01_9000004910_34396cztM0_level2.evt | modeM0/AS1A05_085T01_9000004910_34396cztM0_level2_quad_clean.evt |
| Size (bytes) | 517,887,360 | 59,826,240 |
| Size | 493.9 MB | 57.1 MB |
| Events in quadrant A | 2,325,750 | 400,079 |
| Events in quadrant B | 2,556,235 | 405,037 |
| Events in quadrant C | 2,557,262 | 397,179 |
| Events in quadrant D | 7,901,805 | 253,266 |
| Mode SS | |||
|---|---|---|---|
| Quadrant | BADHDUFLAG | Total packets | Discarded packets |
| A | 0 | 102 | 0 |
| B | 0 | 102 | 0 |
| C | 0 | 102 | 0 |
| D | 0 | 102 | 0 |
| Mode M9 | |||
|---|---|---|---|
| Quadrant | BADHDUFLAG | Total packets | Discarded packets |
| A | 0 | 28 | 0 |
| B | 0 | 28 | 0 |
| C | 0 | 28 | 0 |
| D | 0 | 29 | 0 |
| Mode M0 | |||
|---|---|---|---|
| Quadrant | BADHDUFLAG | Total packets | Discarded packets |
| A | 0 | 10324 | 3 |
| B | 0 | 10927 | 2 |
| C | 0 | 10657 | 2 |
| D | 0 | 26961 | 2 |
| Quadrant | Total seconds | Saturated seconds | Saturation percentage |
|---|---|---|---|
| A | 5067 | 8 | 0.157884% |
| B | 5067 | 28 | 0.552595% |
| C | 5067 | 24 | 0.473653% |
| D | 5067 | 1491 | 29.425696% |
Noise dominated data is calculated using 1-second bins in cleaned event files. If a bin has >2000 counts, and if more than 50% of those come from <1% of pixels, then it is considered to be noise-dominated and hence unusable.
| Quadrant | # 1 sec bins | Bins with >0 counts | Bins with >2000 counts | High rate bins dominated by noise | Noise dominated (total time) | Noise dominated (detector-on time) | Marked lightcurve |
|---|---|---|---|---|---|---|---|
| A | 6980 | 5068 | 2 | 2 | 0.03% | 0.04% | 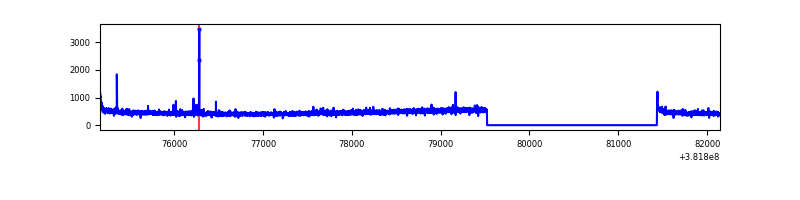 |
| B | 6980 | 5068 | 14 | 14 | 0.20% | 0.28% | 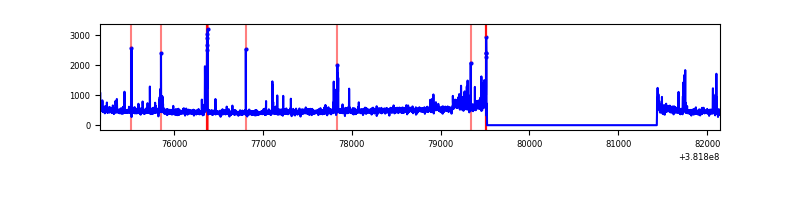 |
| C | 6980 | 5068 | 13 | 13 | 0.19% | 0.26% | 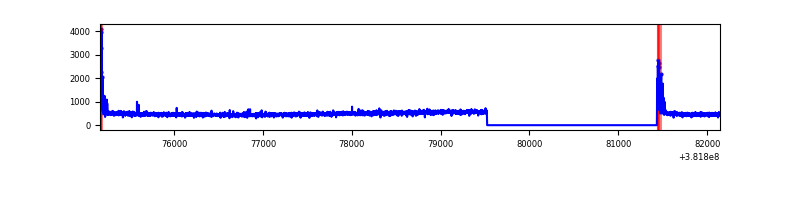 |
| D | 6980 | 5067 | 1475 | 1475 | 21.13% | 29.11% | 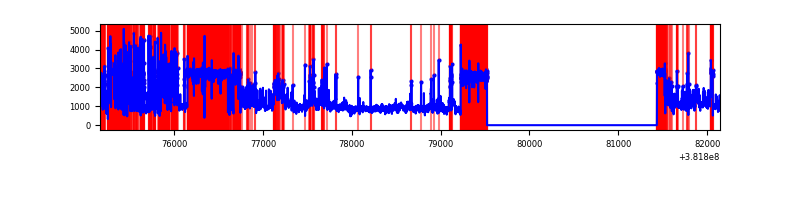 |
Top three noisy pixels from each quadrant. If the there are fewer than three noisy pixels in the level2.evt file, extra rows are filled as -1
| Pixel properties | Quadrant properties | ||||||
|---|---|---|---|---|---|---|---|
| Quadrant | DetID | PixID | Counts | Sigma | Mean | Median | Sigma |
| A | 10 | 83 | 34016 | 280.98 | 585 | 575 | 119.0 |
| A | 9 | 143 | 16264 | 131.82 | 585 | 575 | 119.0 |
| A | 13 | 6 | 11200 | 89.27 | 585 | 575 | 119.0 |
| B | 5 | 172 | 90702 | 804.65 | 586 | 569 | 112.0 |
| B | 0 | 190 | 84098 | 745.69 | 586 | 569 | 112.0 |
| B | 4 | 232 | 15476 | 133.08 | 586 | 569 | 112.0 |
| C | 15 | 214 | 214025 | 1608.81 | 571 | 576 | 132.7 |
| C | 0 | 10 | 98709 | 739.65 | 571 | 576 | 132.7 |
| C | 14 | 67 | 5545 | 37.45 | 571 | 576 | 132.7 |
| D | 7 | 223 | 4492034 | 37972.54 | 475 | 461 | 118.3 |
| D | 8 | 195 | 597923 | 5051.05 | 475 | 461 | 118.3 |
| D | 2 | 249 | 353637 | 2985.81 | 475 | 461 | 118.3 |
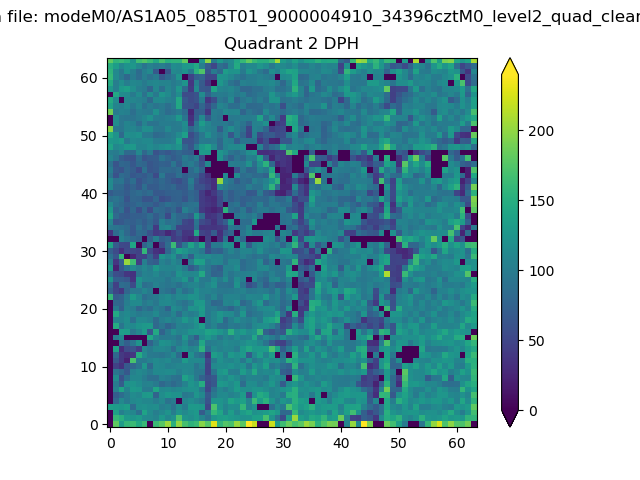
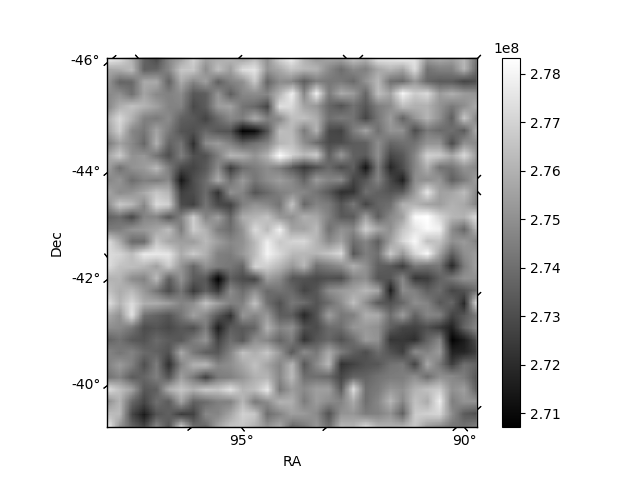
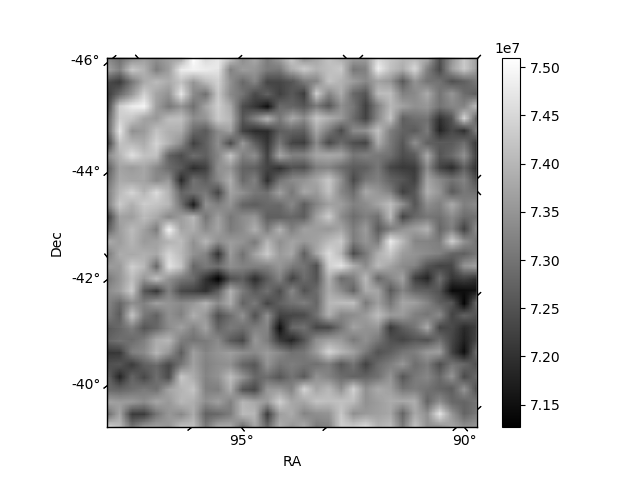
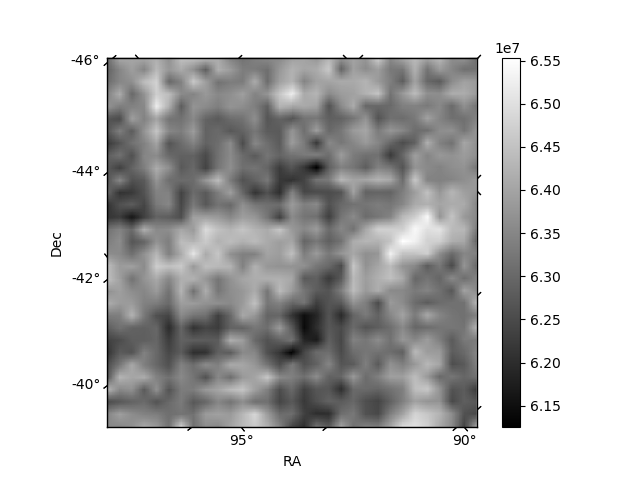
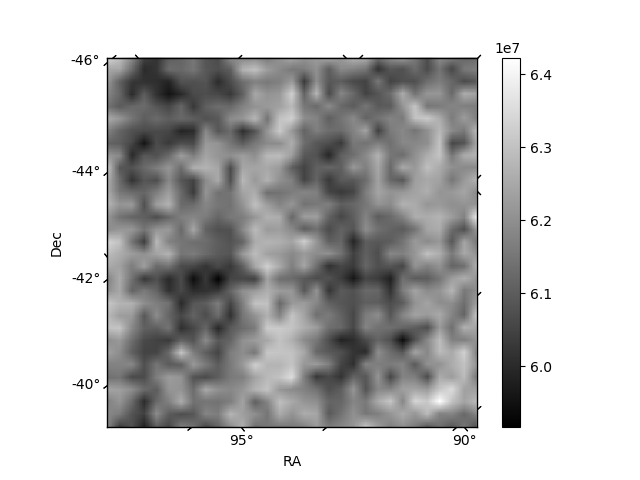
Histogram calculated using DETX and DETY for each event in the final _common_clean file
| Quadrant A | 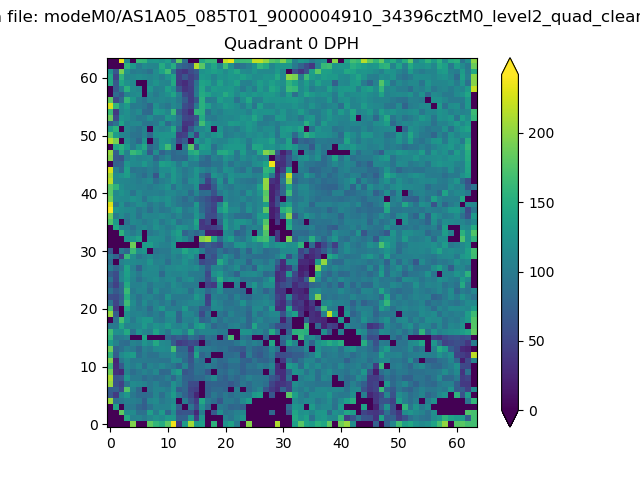 |
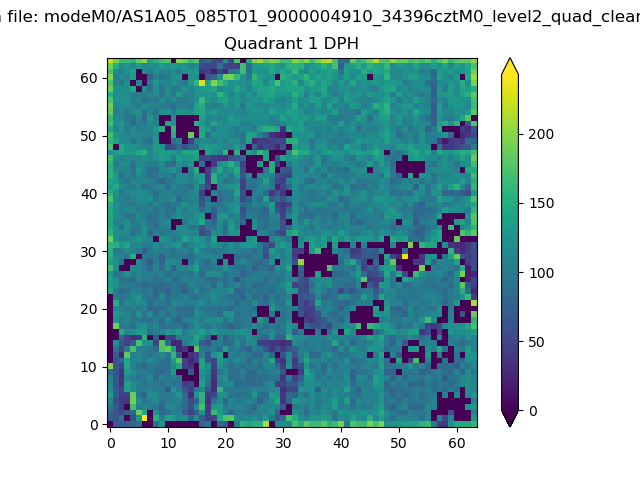 |
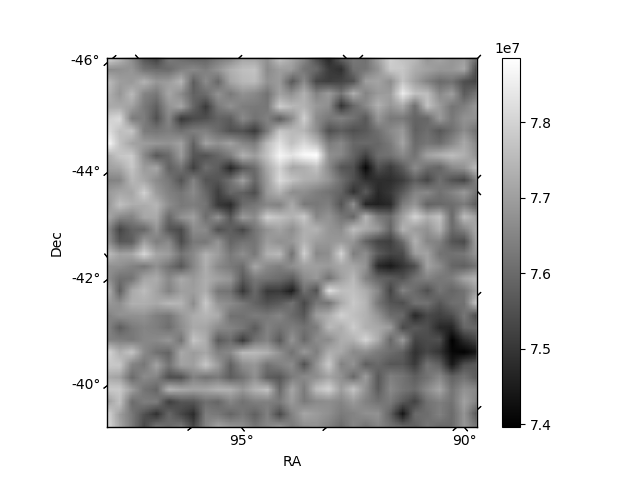
Quadrant B |
|---|---|---|---|
| Quadrant D | 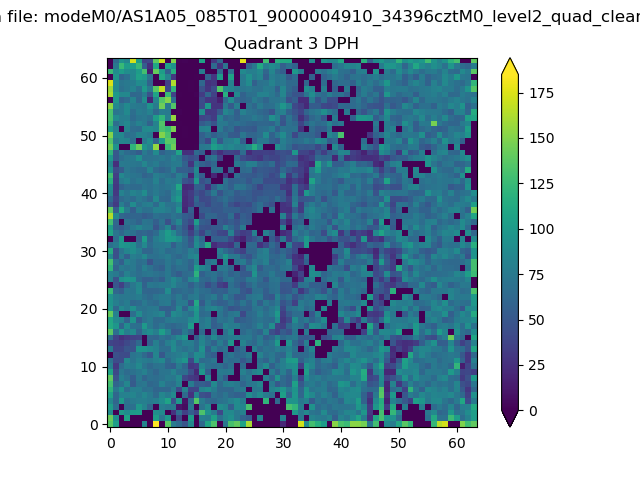 |
 |
Quadrant C |
| Plot type | Count rate plots | Images |
|---|---|---|
| Comparison with Poisson distribution Blue bars denote a histogram of data divided into 1 sec bins. Red curve is a Poisson curve with rate = median count rate of data. |
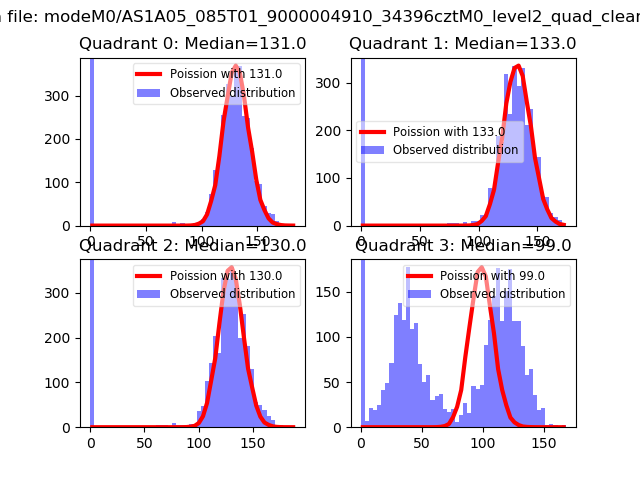 |
 |
| Quadrant-wise count rates Data is divided into 100 sec bins |
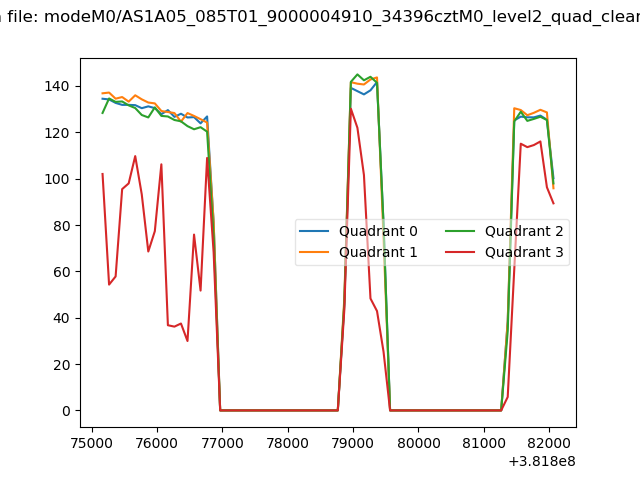 |
|
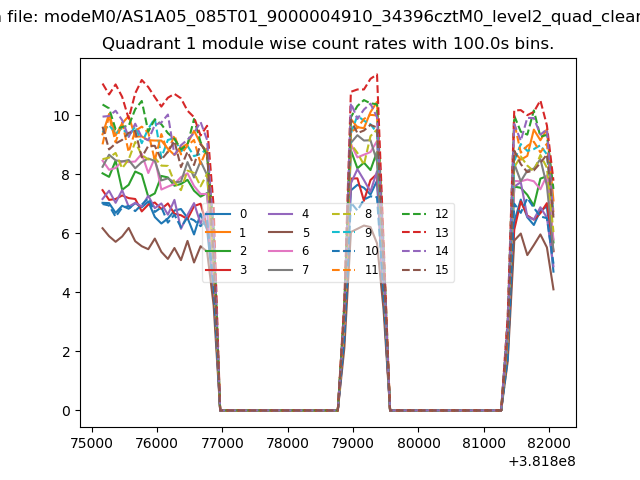
| Module-wise count rates for Quadrant A Data is divided into 100 sec bins |
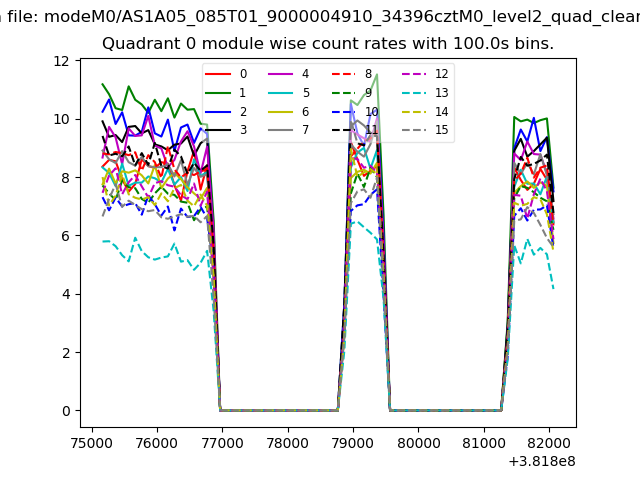 |
 |
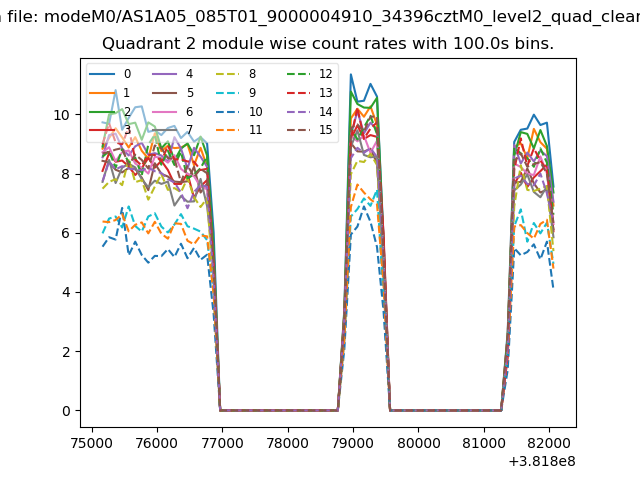
| Module-wise count rates for Quadrant B Data is divided into 100 sec bins |
 |
 |
| Module-wise count rates for Quadrant C Data is divided into 100 sec bins |
 |
 |
| Module-wise count rates for Quadrant D Data is divided into 100 sec bins |
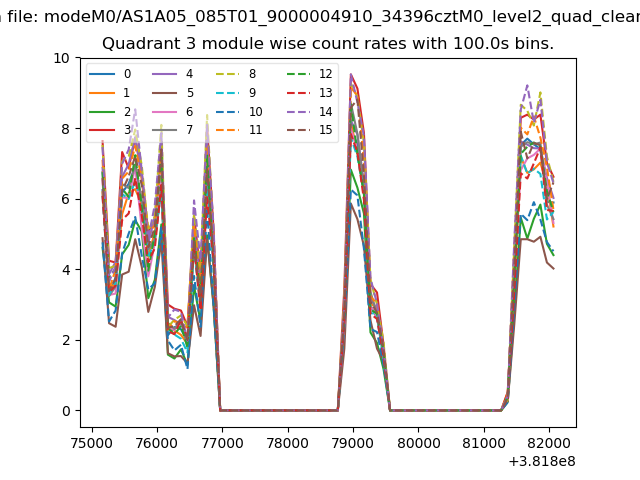 |
 |
| Parameter | Plot |
|---|---|
| CZT HV Monitor | 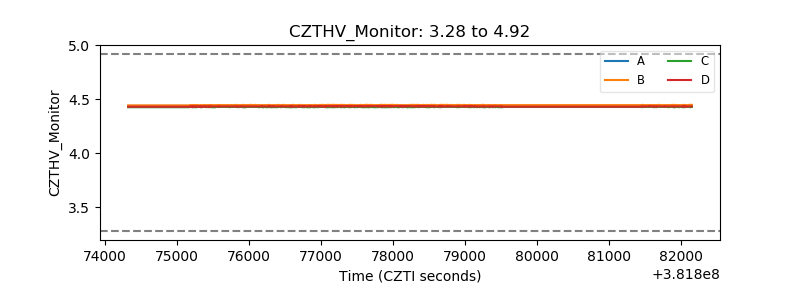 |
| D_VDD | 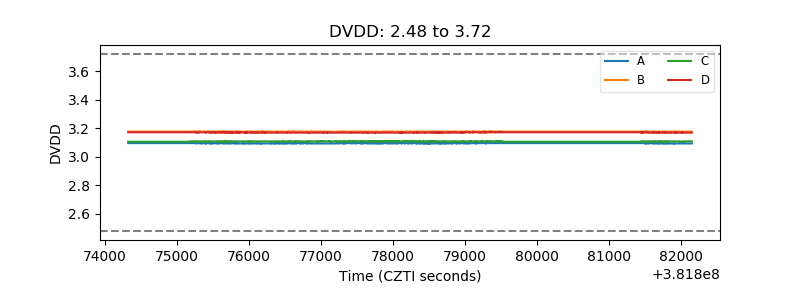 |
| Temperature 1 | 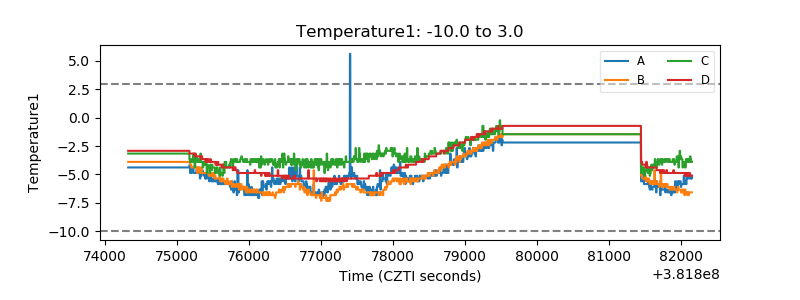 |
| Veto HV Monitor | 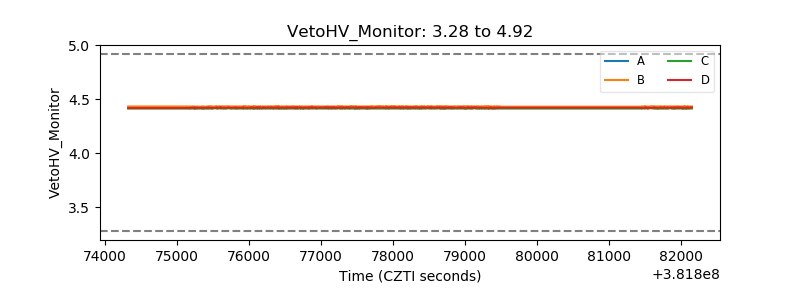 |
| Veto LLD | 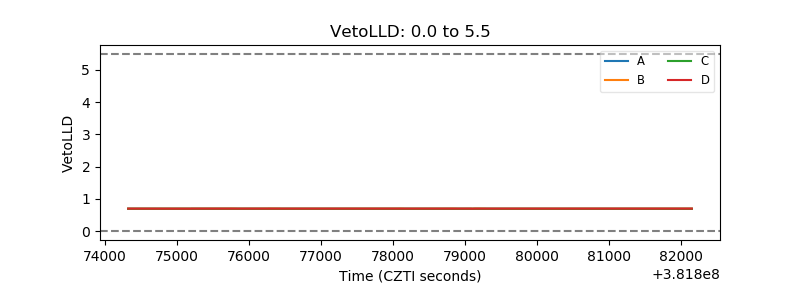 |
| Alpha Counter | 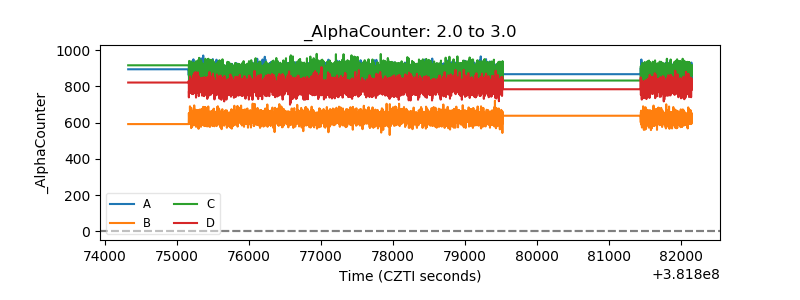 |
| _CPM_Rate | 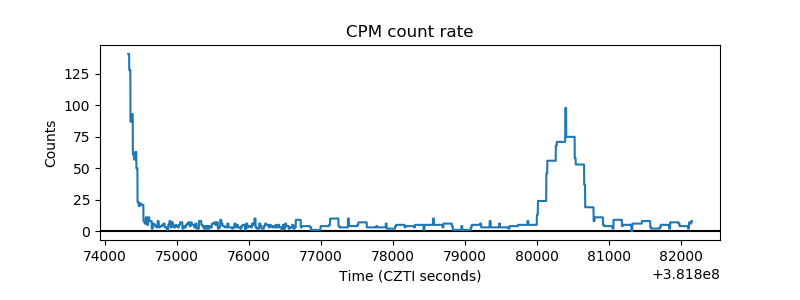 |
| CZT Counter | 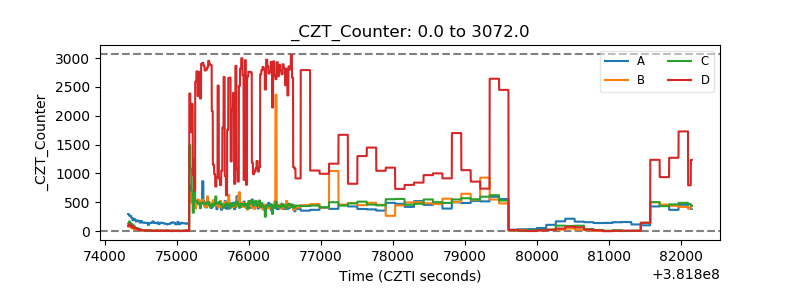 |
| +2.5 Volts monitor | 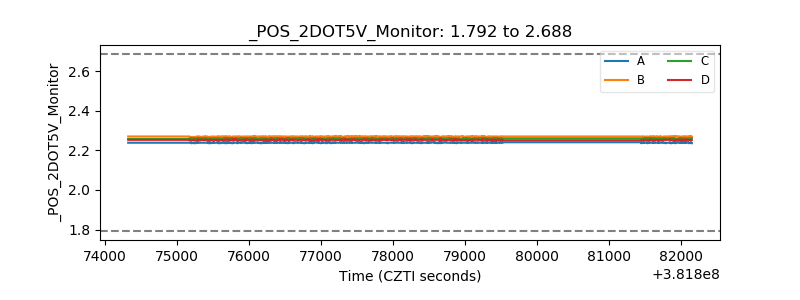 |
| +5 Volts monitor |  |
| _ROLL_ROT | 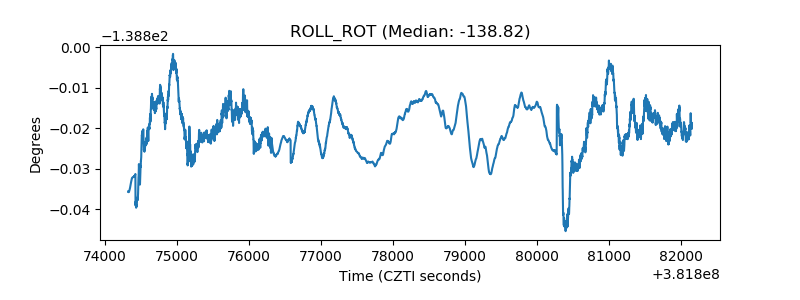 |
| _Roll_DEC | 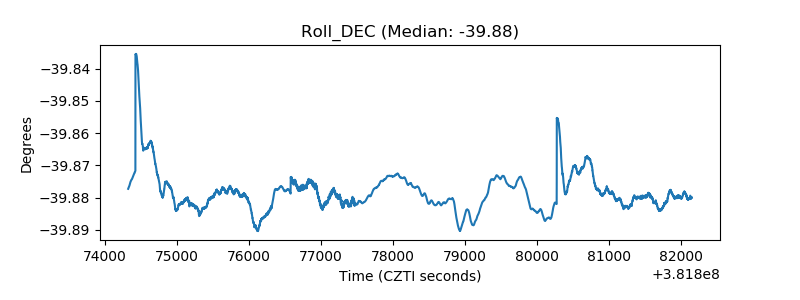 |
| _Roll_RA | 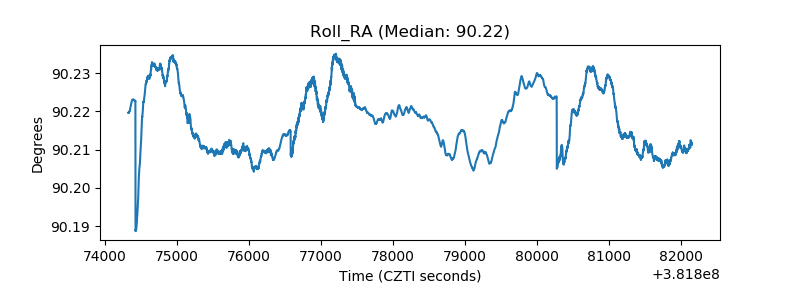 |
| Veto Counter | 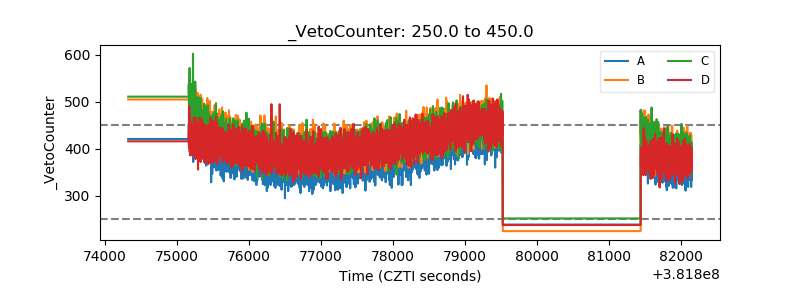 |