| Param | Original file | Final file |
|---|---|---|
| Filename | modeM0/AS1A05_085T01_9000004910_34395cztM0_level2.evt | modeM0/AS1A05_085T01_9000004910_34395cztM0_level2_quad_clean.evt |
| Size (bytes) | 522,550,080 | 60,860,160 |
| Size | 498.3 MB | 58.0 MB |
| Events in quadrant A | 2,353,443 | 411,628 |
| Events in quadrant B | 2,637,445 | 415,670 |
| Events in quadrant C | 2,596,905 | 401,973 |
| Events in quadrant D | 7,900,356 | 264,012 |
| Mode SS | |||
|---|---|---|---|
| Quadrant | BADHDUFLAG | Total packets | Discarded packets |
| A | 0 | 102 | 0 |
| B | 0 | 102 | 0 |
| C | 0 | 102 | 0 |
| D | 0 | 102 | 0 |
| Mode M9 | |||
|---|---|---|---|
| Quadrant | BADHDUFLAG | Total packets | Discarded packets |
| A | 0 | 27 | 0 |
| B | 0 | 27 | 0 |
| C | 0 | 27 | 0 |
| D | 0 | 28 | 0 |
| Mode M0 | |||
|---|---|---|---|
| Quadrant | BADHDUFLAG | Total packets | Discarded packets |
| A | 0 | 10235 | 3 |
| B | 0 | 10938 | 2 |
| C | 0 | 10654 | 2 |
| D | 0 | 26973 | 2 |
| Quadrant | Total seconds | Saturated seconds | Saturation percentage |
|---|---|---|---|
| A | 4971 | 11 | 0.221283% |
| B | 4971 | 40 | 0.804667% |
| C | 4971 | 32 | 0.643734% |
| D | 4971 | 1785 | 35.908268% |
Noise dominated data is calculated using 1-second bins in cleaned event files. If a bin has >2000 counts, and if more than 50% of those come from <1% of pixels, then it is considered to be noise-dominated and hence unusable.
| Quadrant | # 1 sec bins | Bins with >0 counts | Bins with >2000 counts | High rate bins dominated by noise | Noise dominated (total time) | Noise dominated (detector-on time) | Marked lightcurve |
|---|---|---|---|---|---|---|---|
| A | 7064 | 4972 | 3 | 3 | 0.04% | 0.06% | 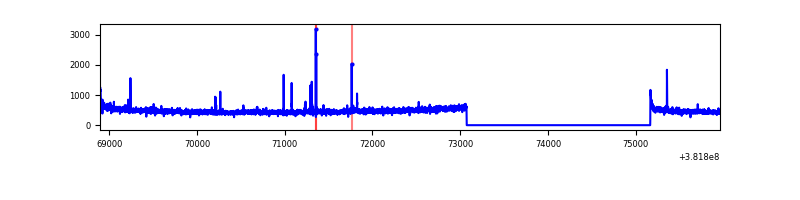 |
| B | 7064 | 4972 | 21 | 21 | 0.30% | 0.42% | 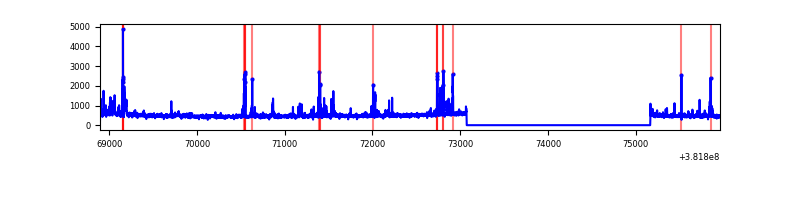 |
| C | 7064 | 4972 | 29 | 29 | 0.41% | 0.58% | 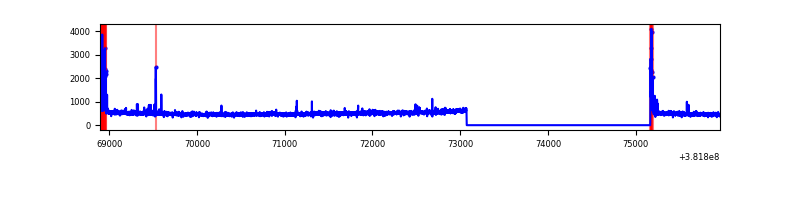 |
| D | 7064 | 4972 | 1658 | 1658 | 23.47% | 33.35% | 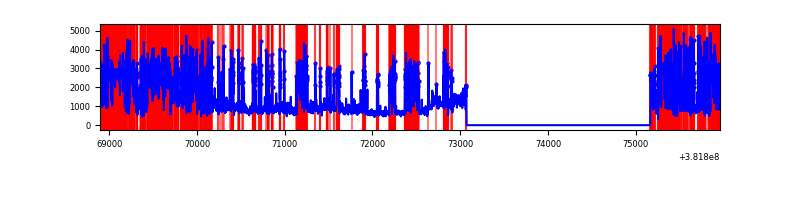 |
Top three noisy pixels from each quadrant. If the there are fewer than three noisy pixels in the level2.evt file, extra rows are filled as -1
| Pixel properties | Quadrant properties | ||||||
|---|---|---|---|---|---|---|---|
| Quadrant | DetID | PixID | Counts | Sigma | Mean | Median | Sigma |
| A | 9 | 143 | 36904 | 309.69 | 587 | 576 | 117.3 |
| A | 10 | 83 | 34609 | 290.13 | 587 | 576 | 117.3 |
| A | 13 | 6 | 14111 | 115.38 | 587 | 576 | 117.3 |
| B | 5 | 172 | 156030 | 1392.08 | 588 | 576 | 111.7 |
| B | 5 | 200 | 51918 | 459.77 | 588 | 576 | 111.7 |
| B | 0 | 190 | 50694 | 448.8 | 588 | 576 | 111.7 |
| C | 15 | 214 | 209426 | 1591.22 | 569 | 572 | 131.3 |
| C | 0 | 10 | 113566 | 860.88 | 569 | 572 | 131.3 |
| C | 12 | 249 | 22273 | 165.34 | 569 | 572 | 131.3 |
| D | 7 | 223 | 4577068 | 40616.44 | 464 | 451 | 112.7 |
| D | 8 | 195 | 409742 | 3632.37 | 464 | 451 | 112.7 |
| D | 7 | 38 | 318485 | 2822.48 | 464 | 451 | 112.7 |
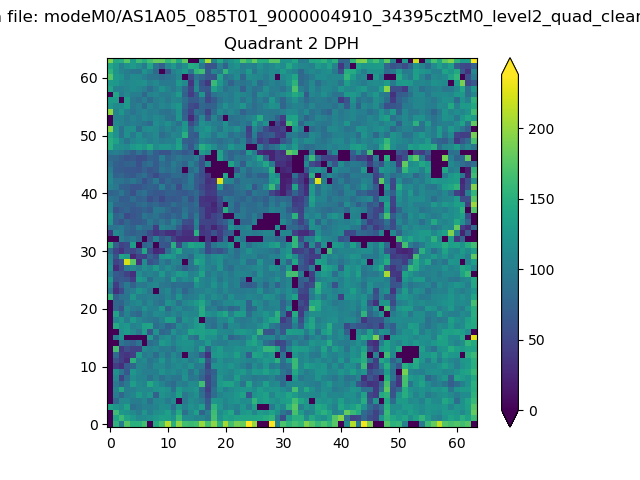
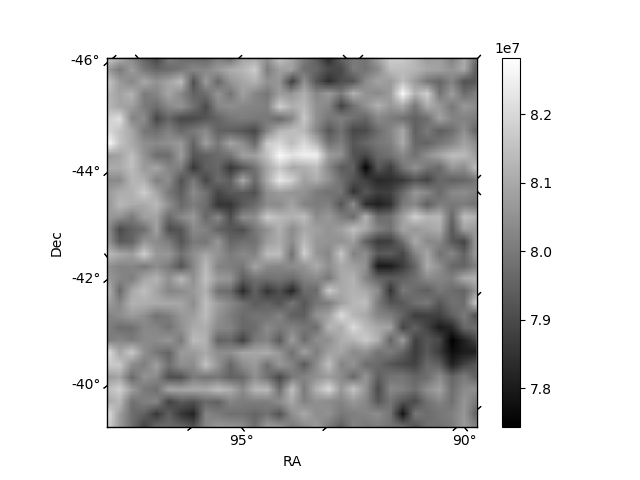
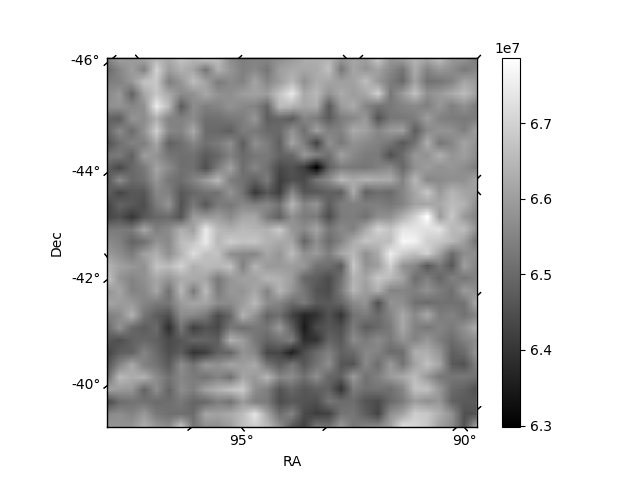
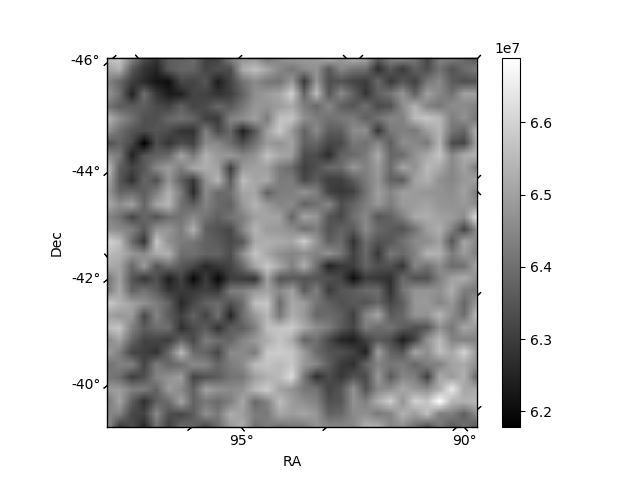
Histogram calculated using DETX and DETY for each event in the final _common_clean file
| Quadrant A | 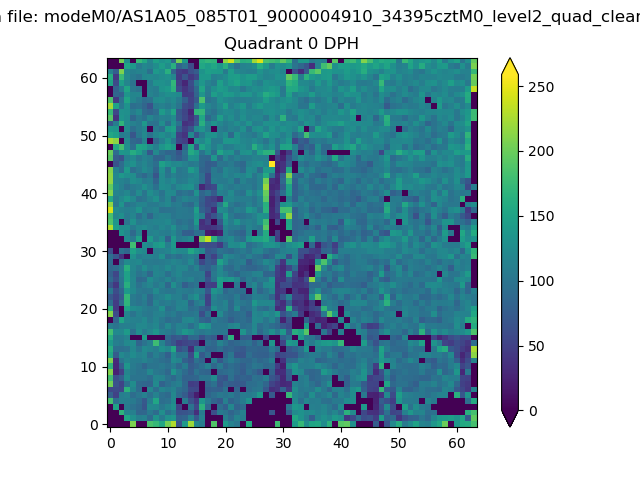 |
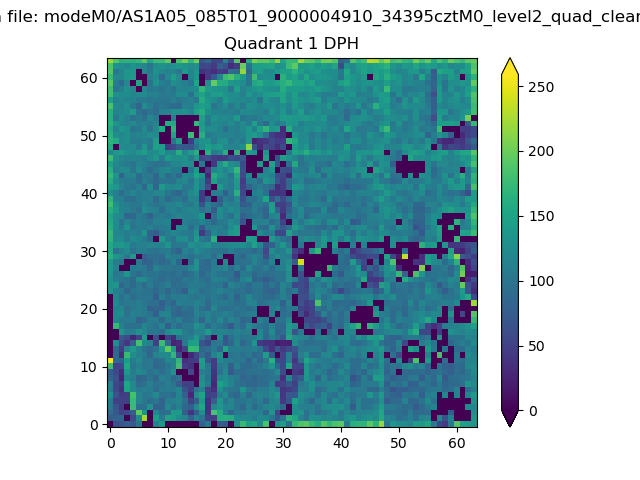 |
Quadrant B |
|---|---|---|---|
| Quadrant D | 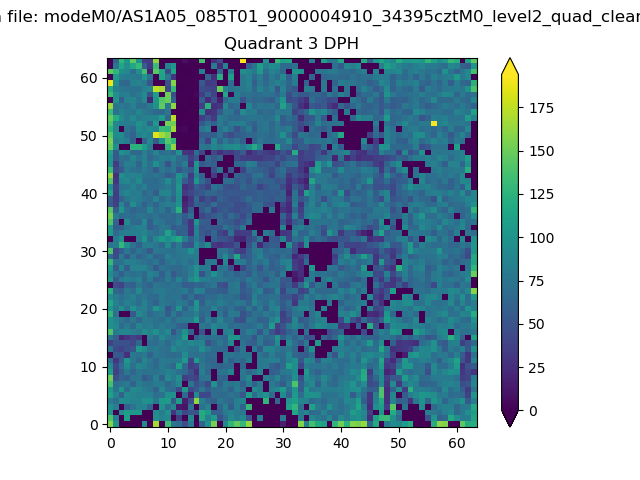 |
 |
Quadrant C |
| Plot type | Count rate plots | Images |
|---|---|---|
| Comparison with Poisson distribution Blue bars denote a histogram of data divided into 1 sec bins. Red curve is a Poisson curve with rate = median count rate of data. |
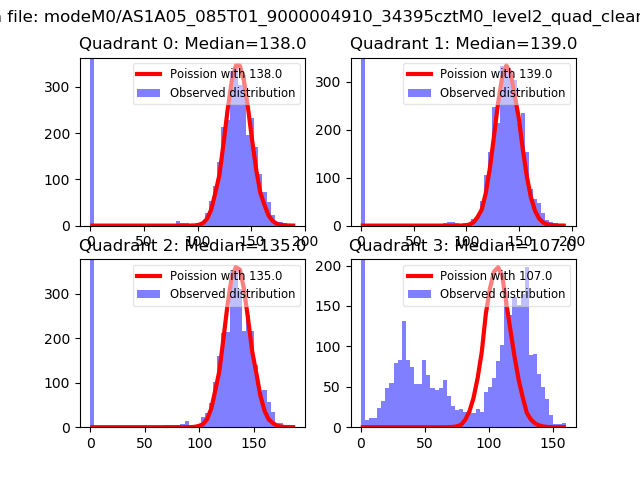 |
 |
| Quadrant-wise count rates Data is divided into 100 sec bins |
 |
|
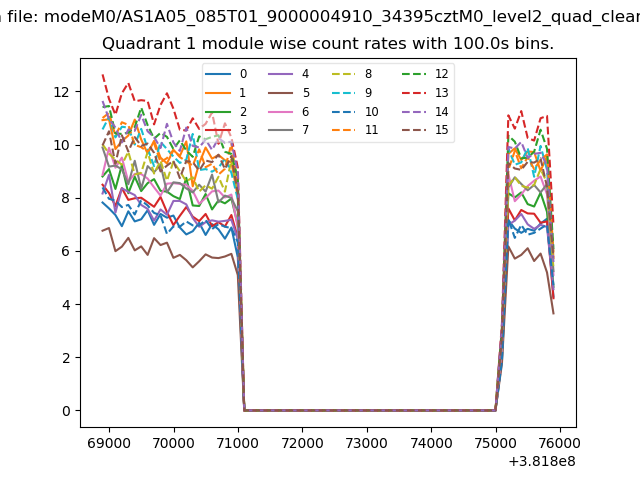
| Module-wise count rates for Quadrant A Data is divided into 100 sec bins |
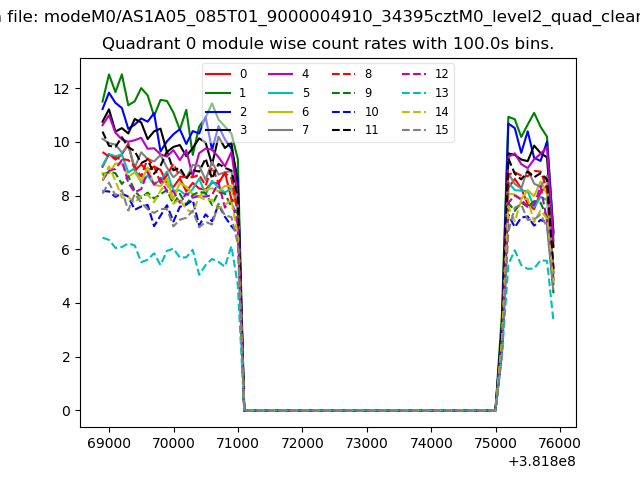 |
 |
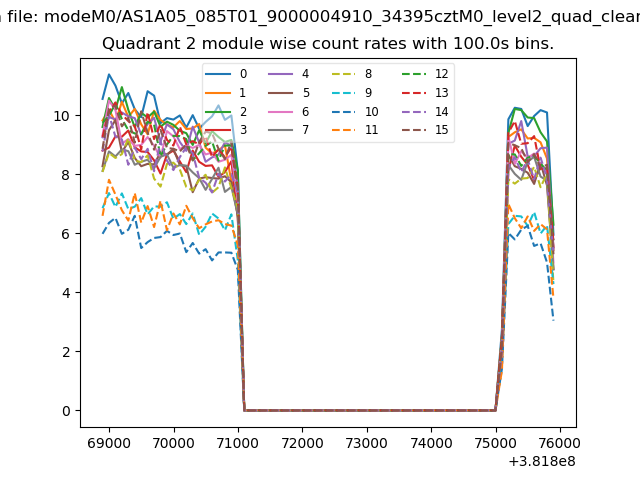
| Module-wise count rates for Quadrant B Data is divided into 100 sec bins |
 |
 |
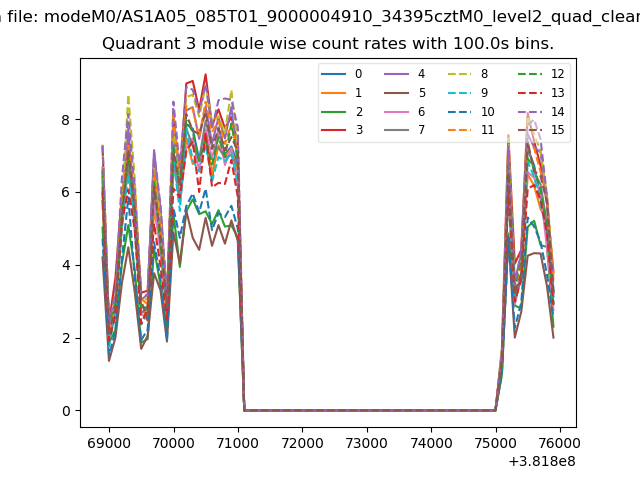
| Module-wise count rates for Quadrant C Data is divided into 100 sec bins |
 |
 |
| Module-wise count rates for Quadrant D Data is divided into 100 sec bins |
 |
 |
| Parameter | Plot |
|---|---|
| CZT HV Monitor | 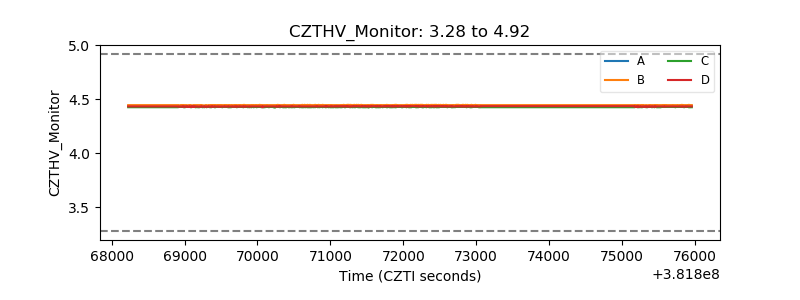 |
| D_VDD | 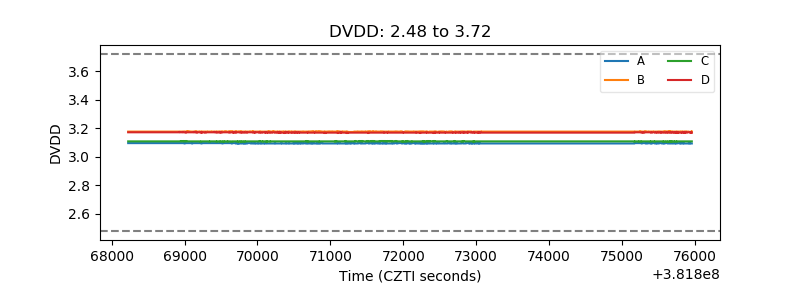 |
| Temperature 1 | 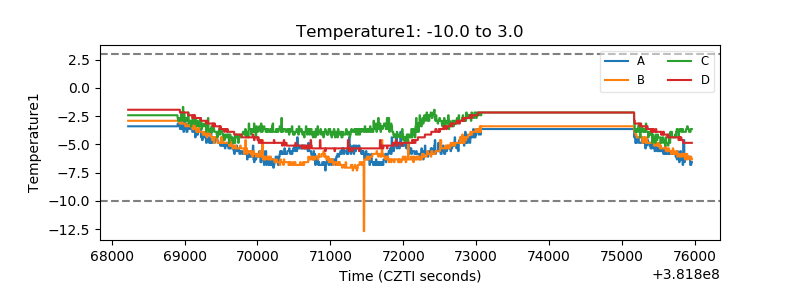 |
| Veto HV Monitor | 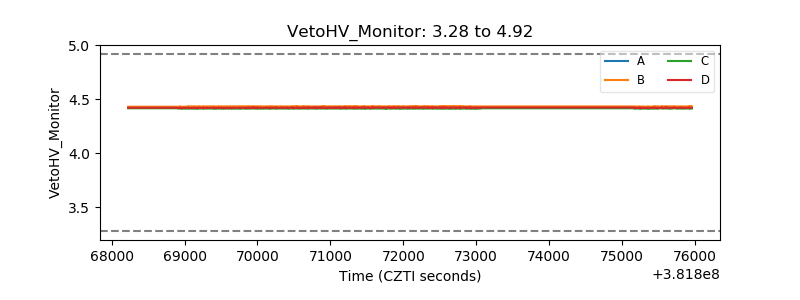 |
| Veto LLD | 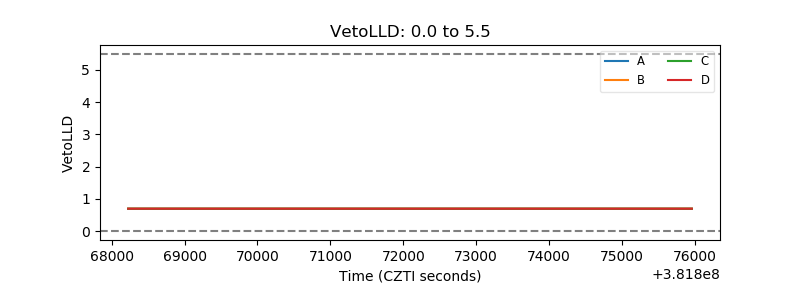 |
| Alpha Counter | 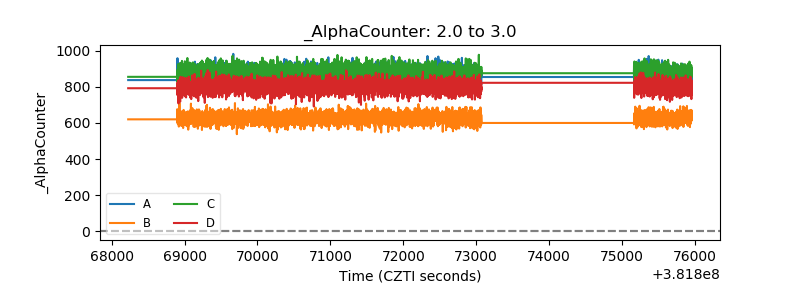 |
| _CPM_Rate | 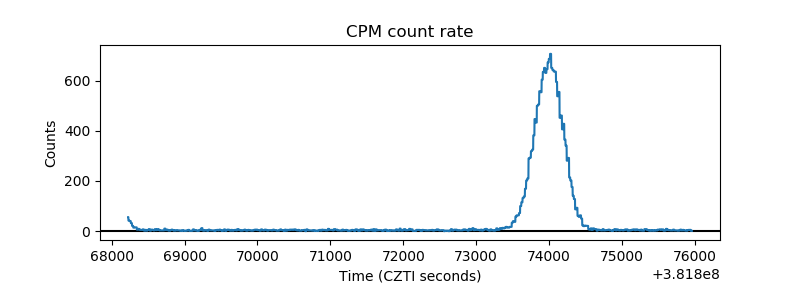 |
| CZT Counter | 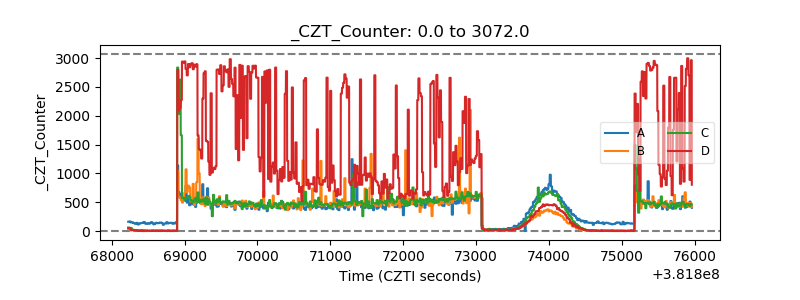 |
| +2.5 Volts monitor | 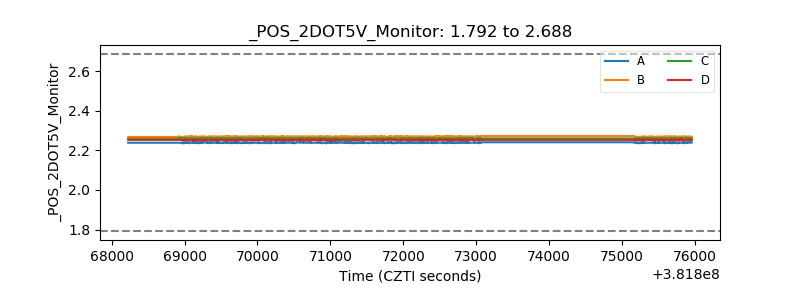 |
| +5 Volts monitor | 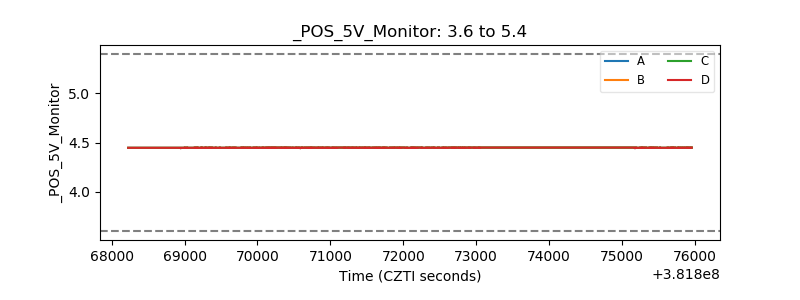 |
| _ROLL_ROT | 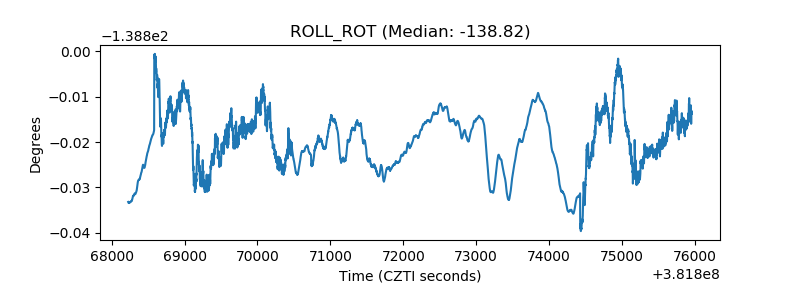 |
| _Roll_DEC | 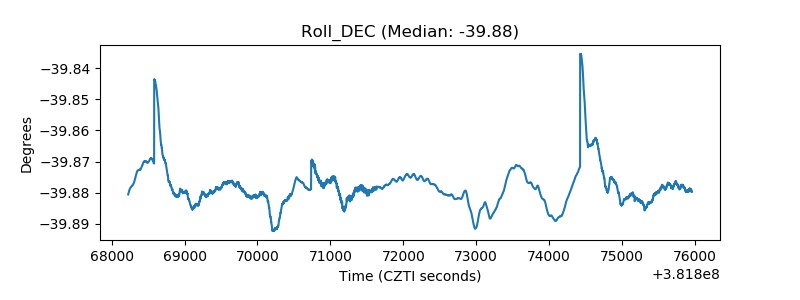 |
| _Roll_RA | 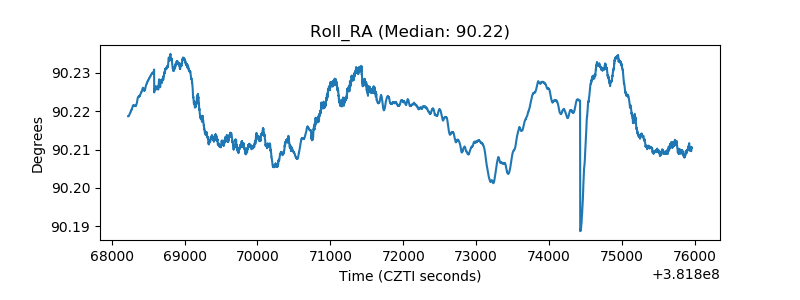 |
| Veto Counter | 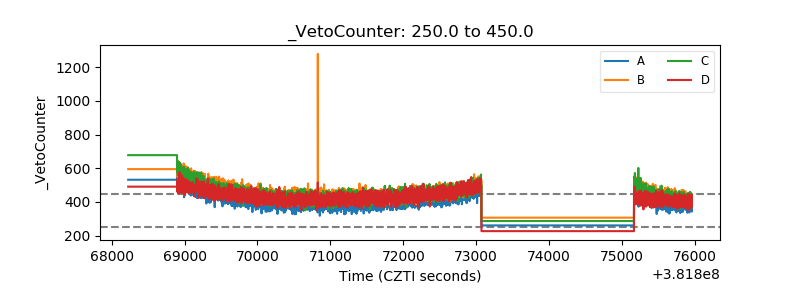 |