| Param | Original file | Final file |
|---|---|---|
| Filename | modeM0/AS1A05_085T01_9000004910_34394cztM0_level2.evt | modeM0/AS1A05_085T01_9000004910_34394cztM0_level2_quad_clean.evt |
| Size (bytes) | 632,347,200 | 71,107,200 |
| Size | 603.1 MB | 67.8 MB |
| Events in quadrant A | 2,782,654 | 496,746 |
| Events in quadrant B | 3,312,331 | 496,388 |
| Events in quadrant C | 2,730,439 | 507,437 |
| Events in quadrant D | 9,983,582 | 297,487 |
| Mode SS | |||
|---|---|---|---|
| Quadrant | BADHDUFLAG | Total packets | Discarded packets |
| A | 0 | 104 | 0 |
| B | 0 | 104 | 0 |
| C | 0 | 104 | 0 |
| D | 0 | 104 | 0 |
| Mode M9 | |||
|---|---|---|---|
| Quadrant | BADHDUFLAG | Total packets | Discarded packets |
| A | 0 | 24 | 0 |
| B | 0 | 24 | 0 |
| C | 0 | 24 | 0 |
| D | 0 | 25 | 0 |
| Mode M0 | |||
|---|---|---|---|
| Quadrant | BADHDUFLAG | Total packets | Discarded packets |
| A | 0 | 11435 | 2 |
| B | 0 | 12958 | 1 |
| C | 0 | 10991 | 1 |
| D | 0 | 33054 | 1 |
| Quadrant | Total seconds | Saturated seconds | Saturation percentage |
|---|---|---|---|
| A | 5046 | 194 | 3.844629% |
| B | 5046 | 311 | 6.163298% |
| C | 5046 | 40 | 0.792707% |
| D | 5046 | 2589 | 51.307967% |
Noise dominated data is calculated using 1-second bins in cleaned event files. If a bin has >2000 counts, and if more than 50% of those come from <1% of pixels, then it is considered to be noise-dominated and hence unusable.
| Quadrant | # 1 sec bins | Bins with >0 counts | Bins with >2000 counts | High rate bins dominated by noise | Noise dominated (total time) | Noise dominated (detector-on time) | Marked lightcurve |
|---|---|---|---|---|---|---|---|
| A | 7200 | 5047 | 81 | 81 | 1.12% | 1.60% | 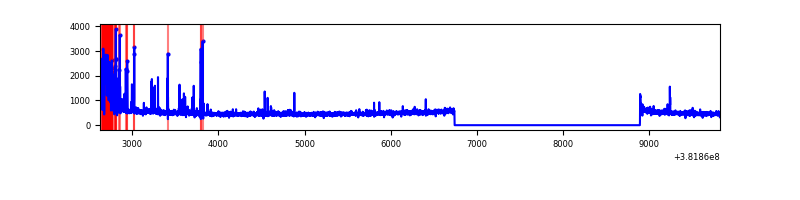 |
| B | 7200 | 5047 | 251 | 251 | 3.49% | 4.97% | 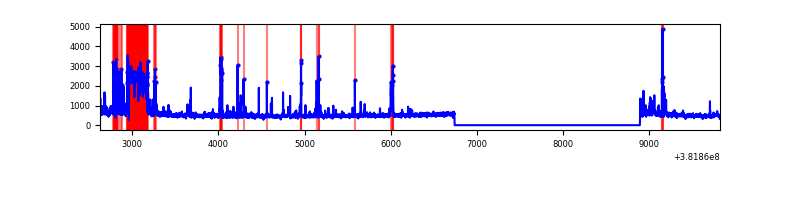 |
| C | 7200 | 5047 | 35 | 35 | 0.49% | 0.69% | 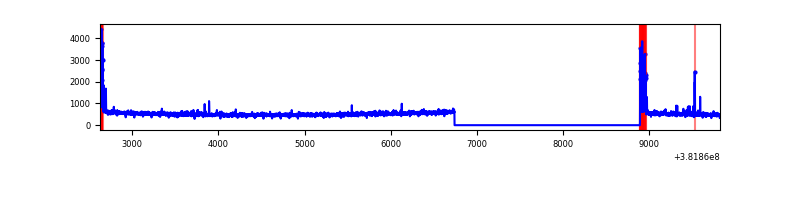 |
| D | 7200 | 5047 | 2552 | 2552 | 35.44% | 50.56% | 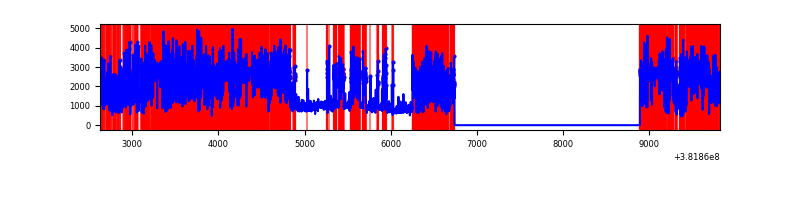 |
Top three noisy pixels from each quadrant. If the there are fewer than three noisy pixels in the level2.evt file, extra rows are filled as -1
| Pixel properties | Quadrant properties | ||||||
|---|---|---|---|---|---|---|---|
| Quadrant | DetID | PixID | Counts | Sigma | Mean | Median | Sigma |
| A | 9 | 143 | 359536 | 3003.84 | 599 | 591 | 119.5 |
| A | 7 | 16 | 64656 | 536.13 | 599 | 591 | 119.5 |
| A | 10 | 83 | 29330 | 240.5 | 599 | 591 | 119.5 |
| B | 5 | 172 | 709987 | 6344.11 | 594 | 582 | 111.8 |
| B | 5 | 200 | 82787 | 735.15 | 594 | 582 | 111.8 |
| B | 4 | 232 | 50246 | 444.14 | 594 | 582 | 111.8 |
| C | 15 | 214 | 213223 | 1566.61 | 591 | 596 | 135.7 |
| C | 0 | 10 | 136026 | 997.83 | 591 | 596 | 135.7 |
| C | 14 | 67 | 38520 | 279.42 | 591 | 596 | 135.7 |
| D | 7 | 223 | 7322937 | 67883.66 | 436 | 424 | 107.9 |
| D | 8 | 195 | 432552 | 4006.06 | 436 | 424 | 107.9 |
| D | 12 | 235 | 136145 | 1258.21 | 436 | 424 | 107.9 |
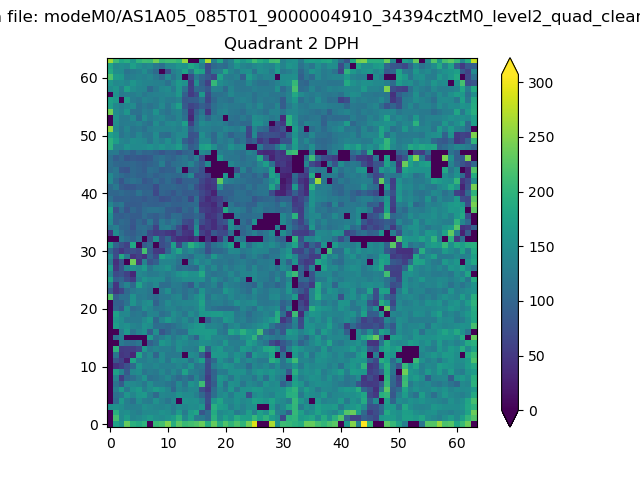
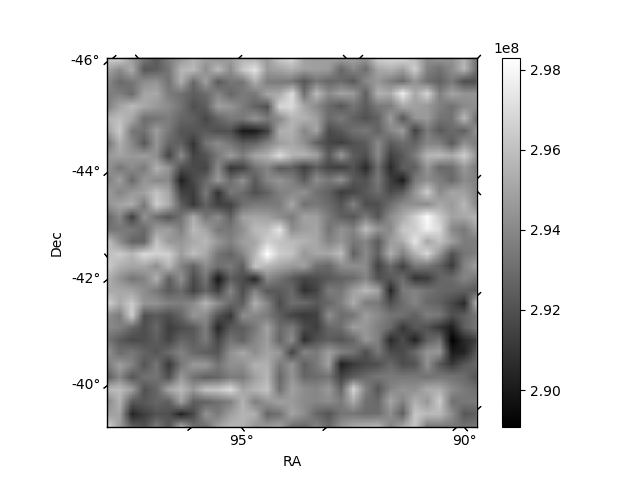
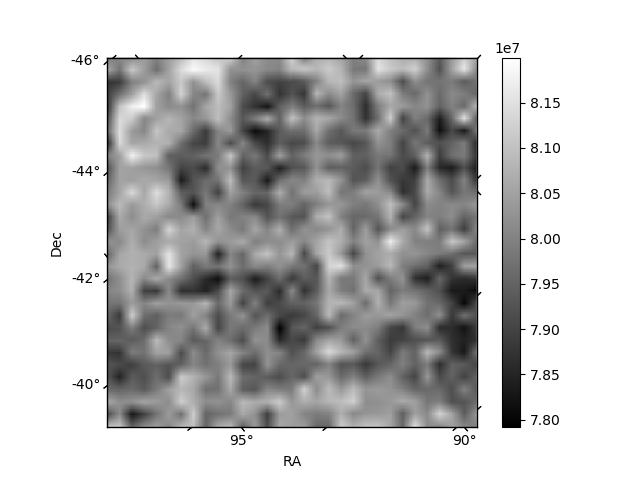
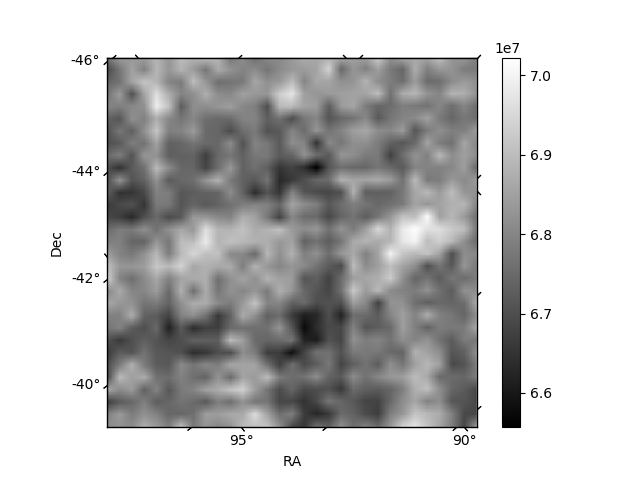
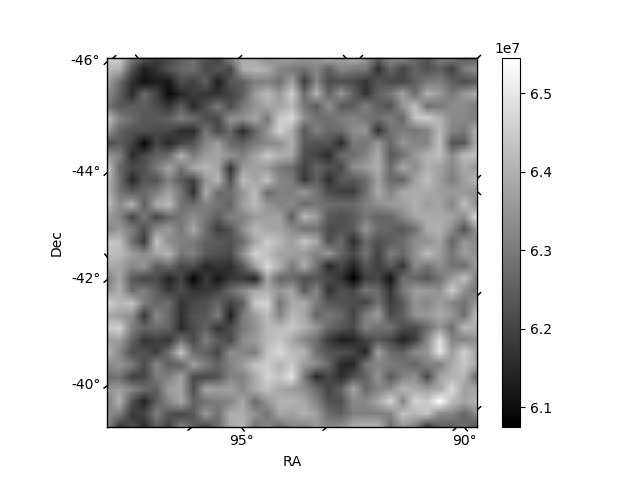
Histogram calculated using DETX and DETY for each event in the final _common_clean file
| Quadrant A | 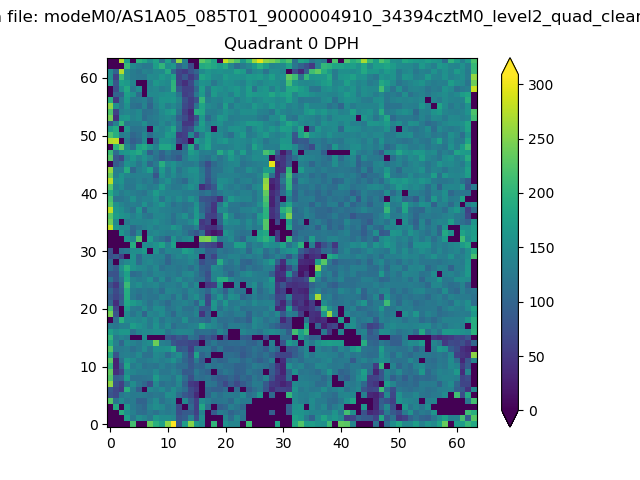 |
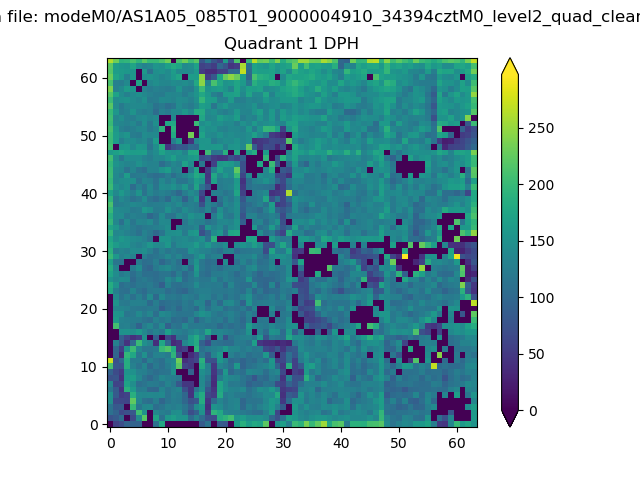 |
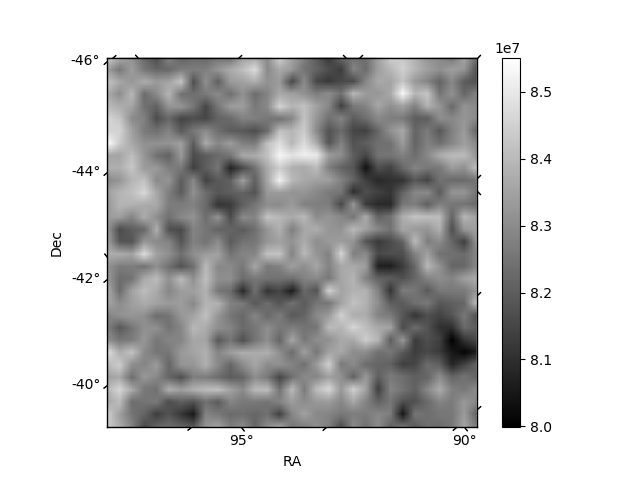
Quadrant B |
|---|---|---|---|
| Quadrant D | 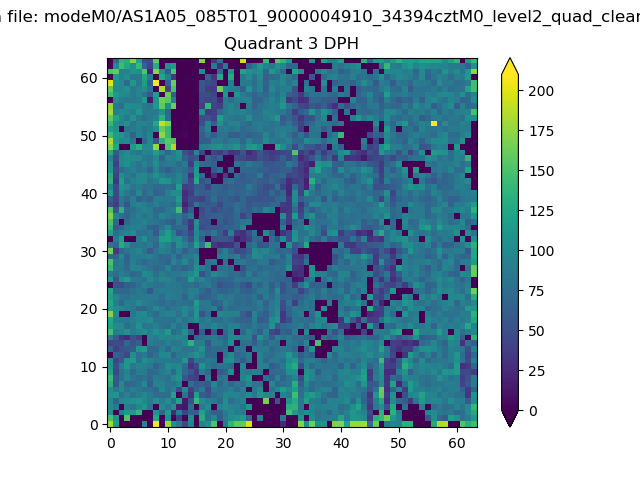 |
 |
Quadrant C |
| Plot type | Count rate plots | Images |
|---|---|---|
| Comparison with Poisson distribution Blue bars denote a histogram of data divided into 1 sec bins. Red curve is a Poisson curve with rate = median count rate of data. |
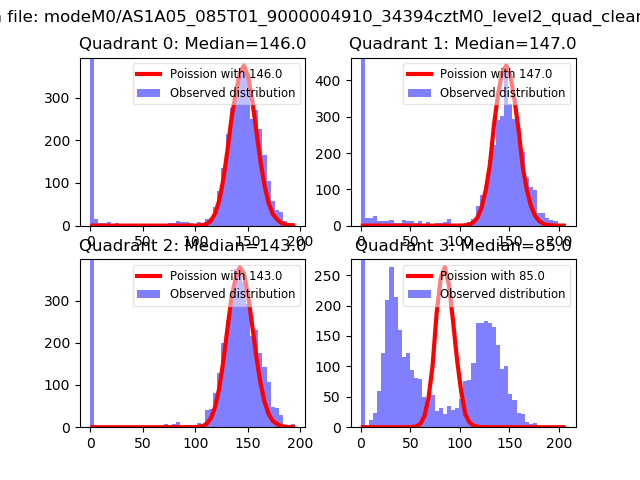 |
 |
| Quadrant-wise count rates Data is divided into 100 sec bins |
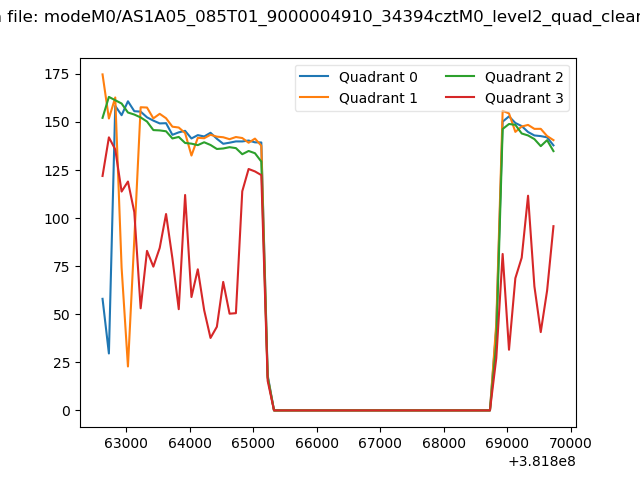 |
|
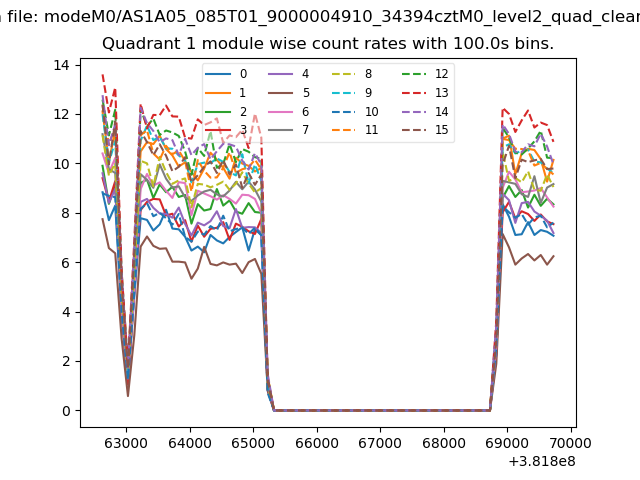
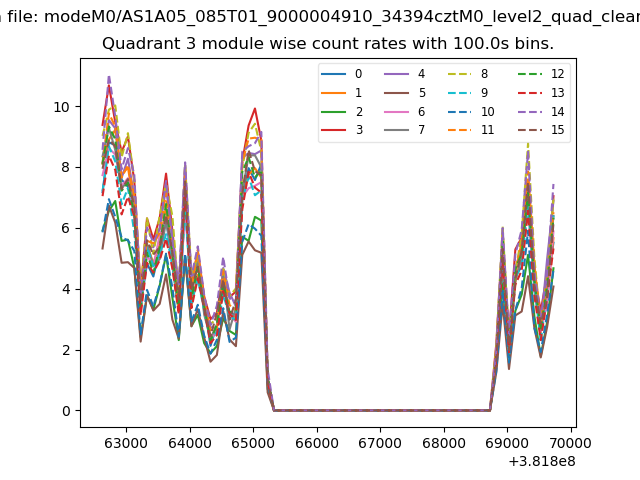
| Module-wise count rates for Quadrant A Data is divided into 100 sec bins |
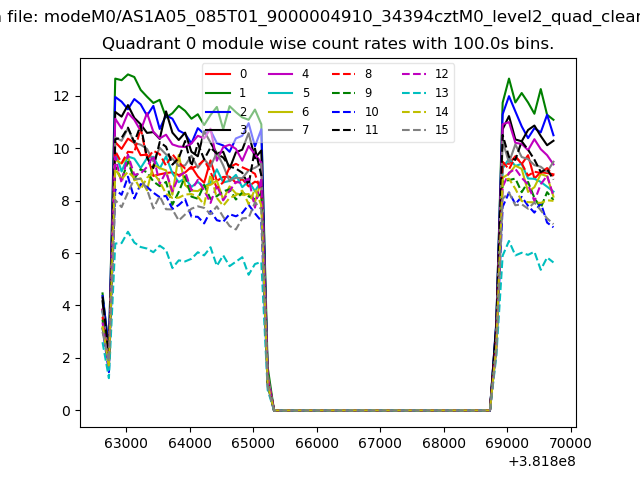 |
 |
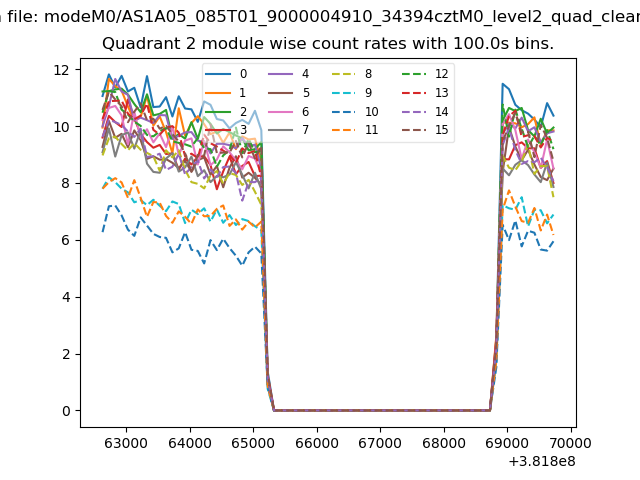
| Module-wise count rates for Quadrant B Data is divided into 100 sec bins |
 |
 |
| Module-wise count rates for Quadrant C Data is divided into 100 sec bins |
 |
 |
| Module-wise count rates for Quadrant D Data is divided into 100 sec bins |
 |
 |
| Parameter | Plot |
|---|---|
| CZT HV Monitor | 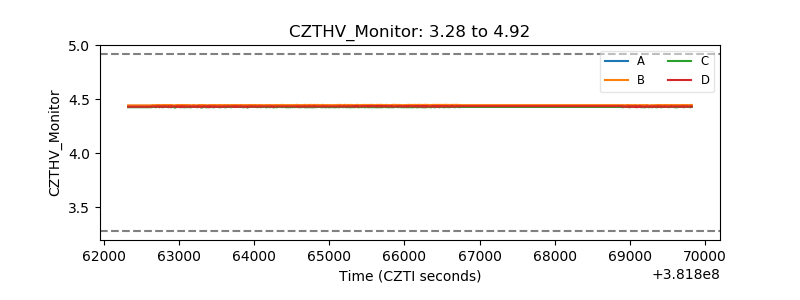 |
| D_VDD | 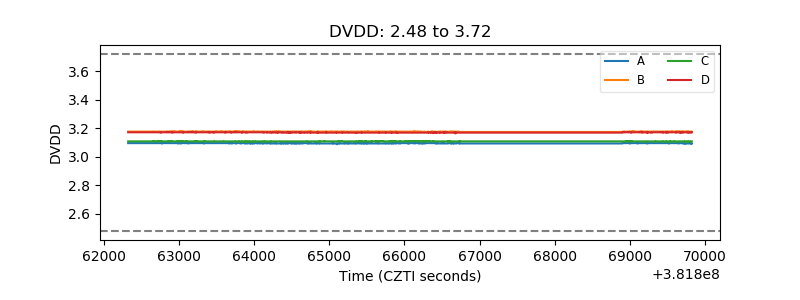 |
| Temperature 1 | 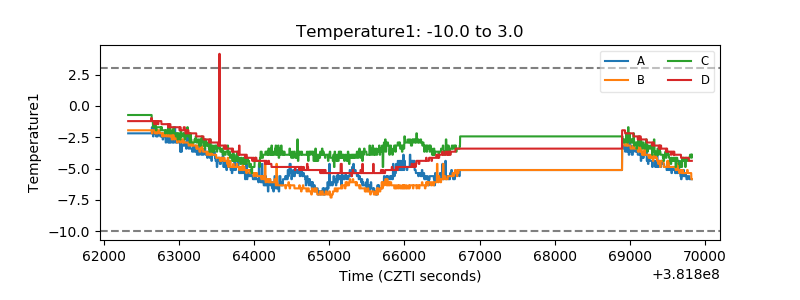 |
| Veto HV Monitor | 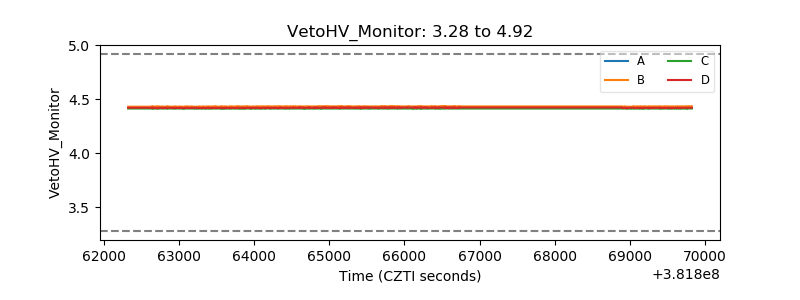 |
| Veto LLD | 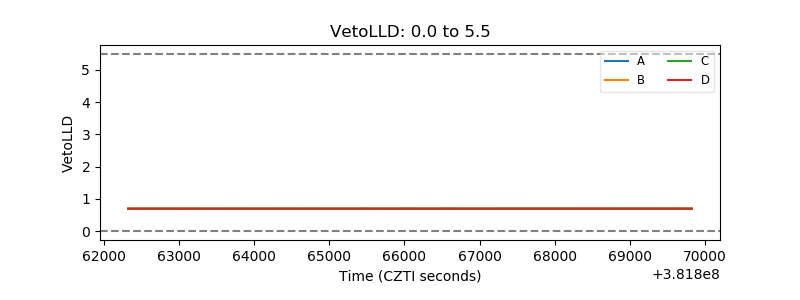 |
| Alpha Counter | 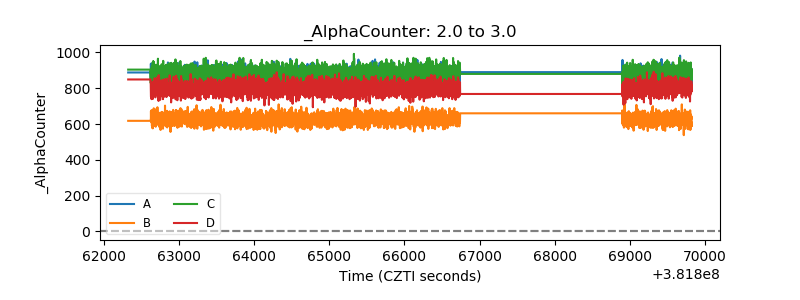 |
| _CPM_Rate | 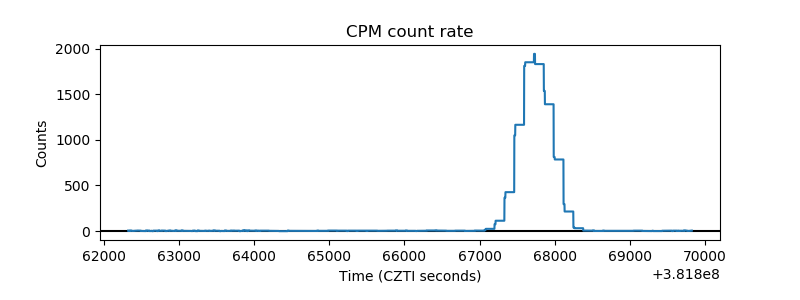 |
| CZT Counter | 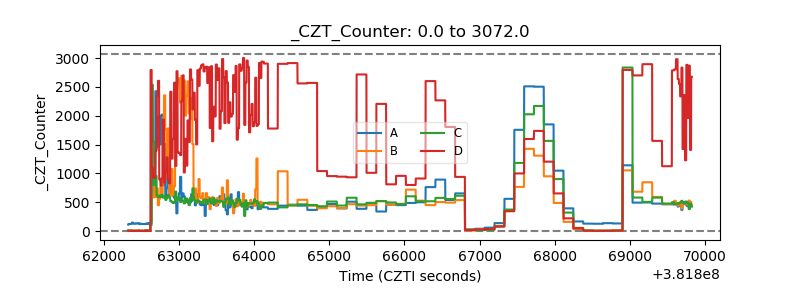 |
| +2.5 Volts monitor | 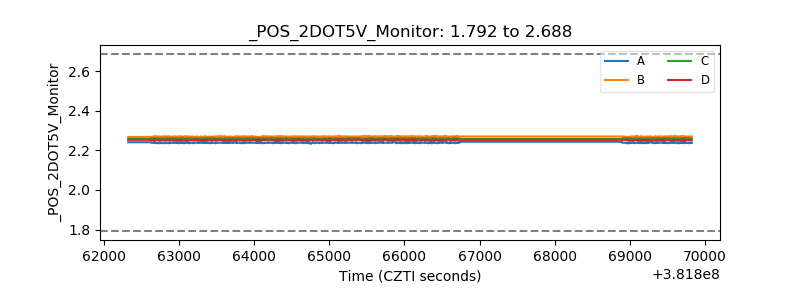 |
| +5 Volts monitor | 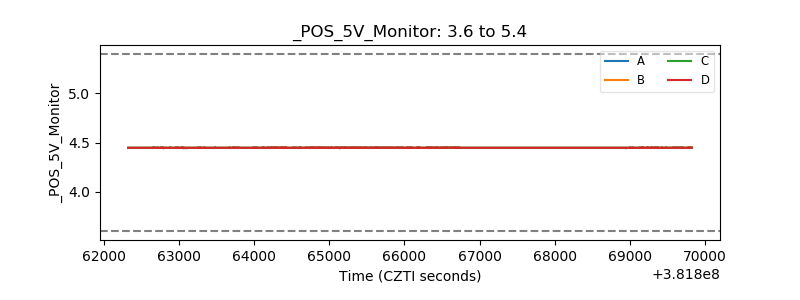 |
| _ROLL_ROT | 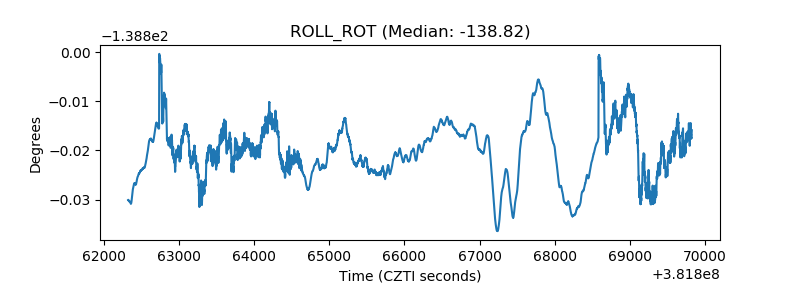 |
| _Roll_DEC | 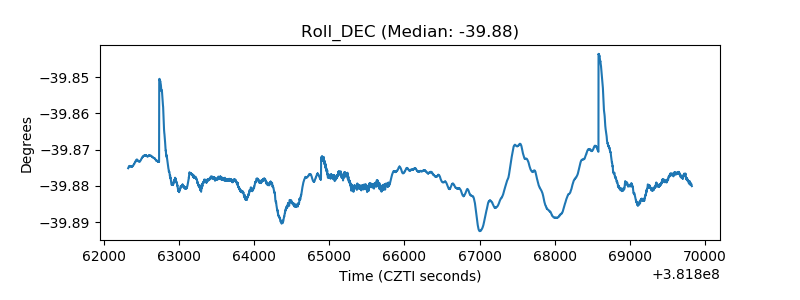 |
| _Roll_RA | 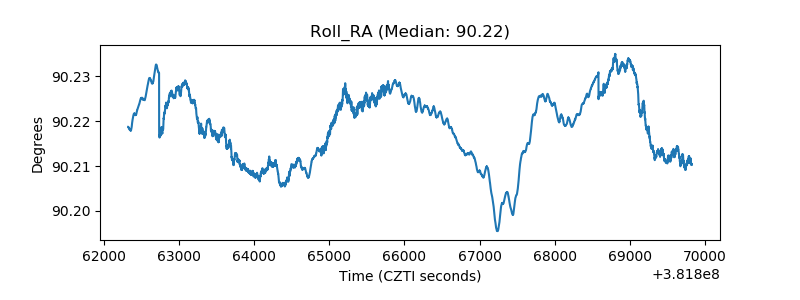 |
| Veto Counter | 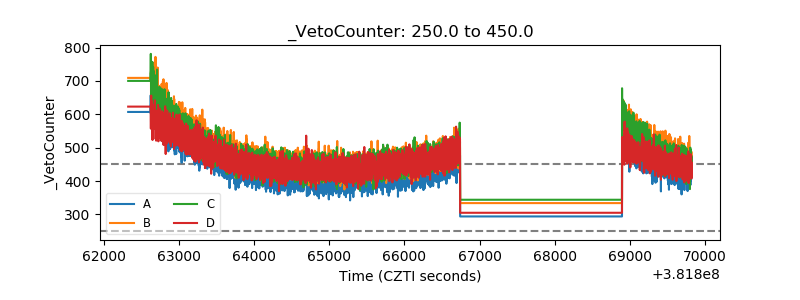 |