| Param | Original file | Final file |
|---|---|---|
| Filename | modeM0/AS1A05_085T01_9000004910_34392cztM0_level2.evt | modeM0/AS1A05_085T01_9000004910_34392cztM0_level2_quad_clean.evt |
| Size (bytes) | 565,214,400 | 95,895,360 |
| Size | 539.0 MB | 91.5 MB |
| Events in quadrant A | 2,660,466 | 685,415 |
| Events in quadrant B | 4,013,310 | 662,413 |
| Events in quadrant C | 2,813,415 | 664,530 |
| Events in quadrant D | 7,271,912 | 520,198 |
| Mode SS | |||
|---|---|---|---|
| Quadrant | BADHDUFLAG | Total packets | Discarded packets |
| A | 0 | 108 | 0 |
| B | 0 | 108 | 0 |
| C | 0 | 108 | 0 |
| D | 0 | 108 | 0 |
| Mode M9 | |||
|---|---|---|---|
| Quadrant | BADHDUFLAG | Total packets | Discarded packets |
| A | 0 | 20 | 0 |
| B | 0 | 20 | 0 |
| C | 0 | 20 | 0 |
| D | 0 | 20 | 0 |
| Mode M0 | |||
|---|---|---|---|
| Quadrant | BADHDUFLAG | Total packets | Discarded packets |
| A | 0 | 11186 | 2 |
| B | 0 | 15360 | 1 |
| C | 0 | 11442 | 1 |
| D | 0 | 25313 | 1 |
| Quadrant | Total seconds | Saturated seconds | Saturation percentage |
|---|---|---|---|
| A | 5296 | 9 | 0.169940% |
| B | 5296 | 394 | 7.439577% |
| C | 5296 | 14 | 0.264350% |
| D | 5296 | 1327 | 25.056647% |
Noise dominated data is calculated using 1-second bins in cleaned event files. If a bin has >2000 counts, and if more than 50% of those come from <1% of pixels, then it is considered to be noise-dominated and hence unusable.
| Quadrant | # 1 sec bins | Bins with >0 counts | Bins with >2000 counts | High rate bins dominated by noise | Noise dominated (total time) | Noise dominated (detector-on time) | Marked lightcurve |
|---|---|---|---|---|---|---|---|
| A | 7297 | 5297 | 1 | 1 | 0.01% | 0.02% | 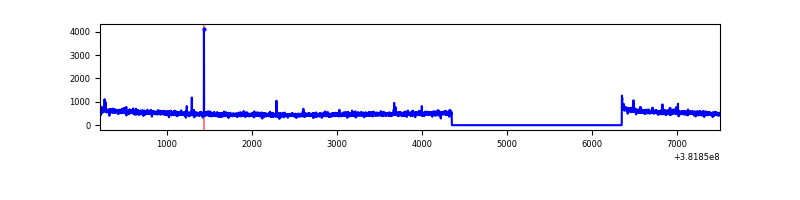 |
| B | 7297 | 5297 | 296 | 296 | 4.06% | 5.59% | 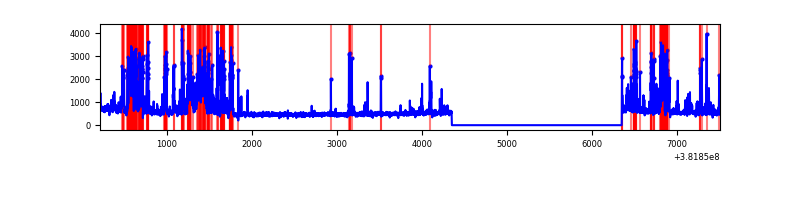 |
| C | 7297 | 5297 | 11 | 11 | 0.15% | 0.21% | 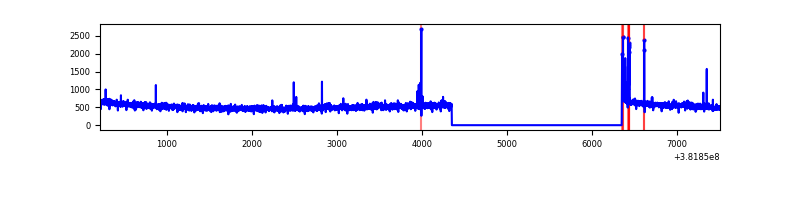 |
| D | 7296 | 5296 | 1289 | 1289 | 17.67% | 24.34% | 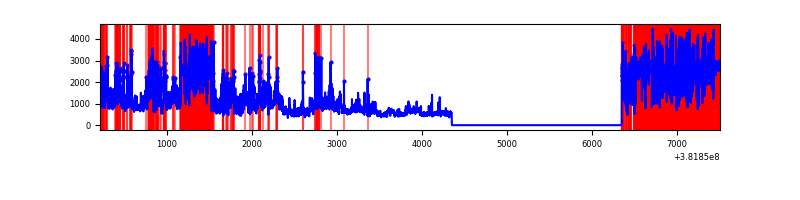 |
Top three noisy pixels from each quadrant. If the there are fewer than three noisy pixels in the level2.evt file, extra rows are filled as -1
| Pixel properties | Quadrant properties | ||||||
|---|---|---|---|---|---|---|---|
| Quadrant | DetID | PixID | Counts | Sigma | Mean | Median | Sigma |
| A | 10 | 83 | 24237 | 175.51 | 677 | 668 | 134.3 |
| A | 9 | 143 | 15437 | 109.98 | 677 | 668 | 134.3 |
| A | 13 | 254 | 10065 | 69.98 | 677 | 668 | 134.3 |
| B | 5 | 172 | 1264639 | 10327.16 | 653 | 639 | 122.4 |
| B | 5 | 200 | 79859 | 647.24 | 653 | 639 | 122.4 |
| B | 0 | 190 | 42757 | 344.11 | 653 | 639 | 122.4 |
| C | 15 | 214 | 221322 | 1502.37 | 639 | 646 | 146.9 |
| C | 0 | 10 | 50854 | 341.82 | 639 | 646 | 146.9 |
| C | 14 | 67 | 22845 | 151.13 | 639 | 646 | 146.9 |
| D | 7 | 223 | 1839170 | 13164.52 | 570 | 555 | 139.7 |
| D | 1 | 47 | 1014180 | 7257.58 | 570 | 555 | 139.7 |
| D | 8 | 195 | 792043 | 5667.07 | 570 | 555 | 139.7 |
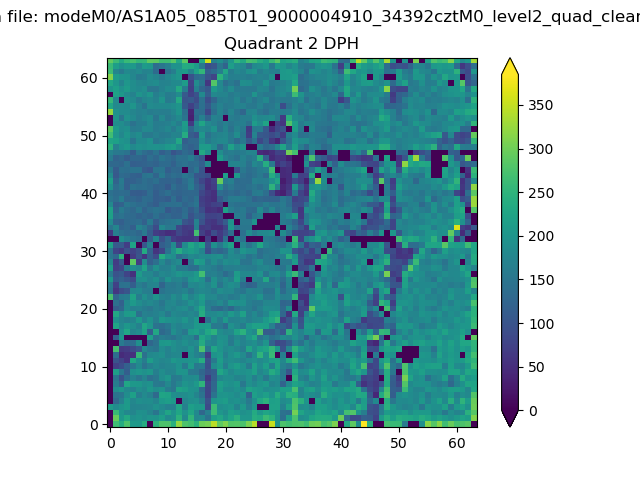
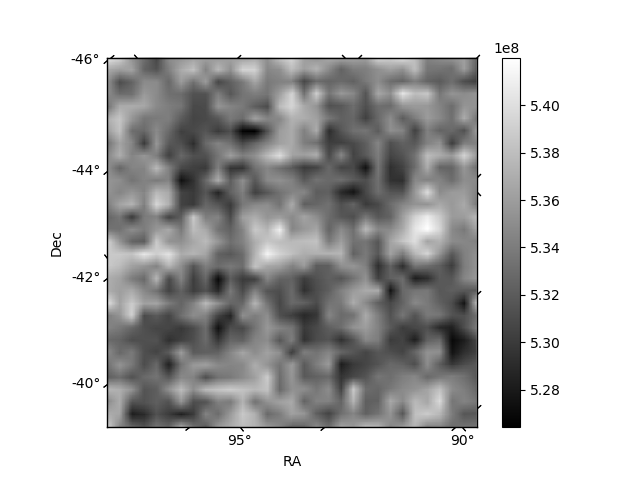
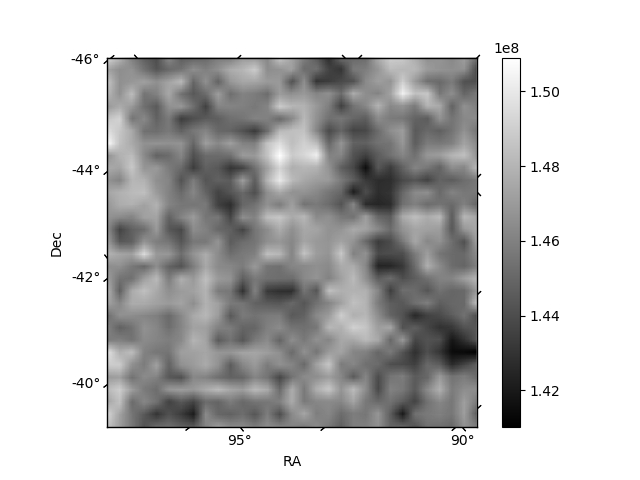
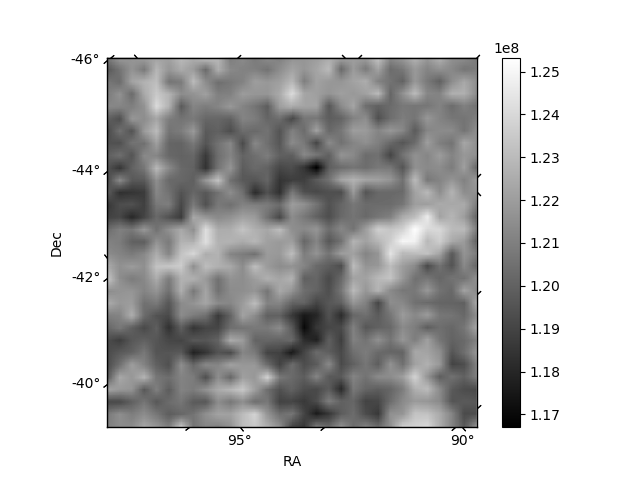
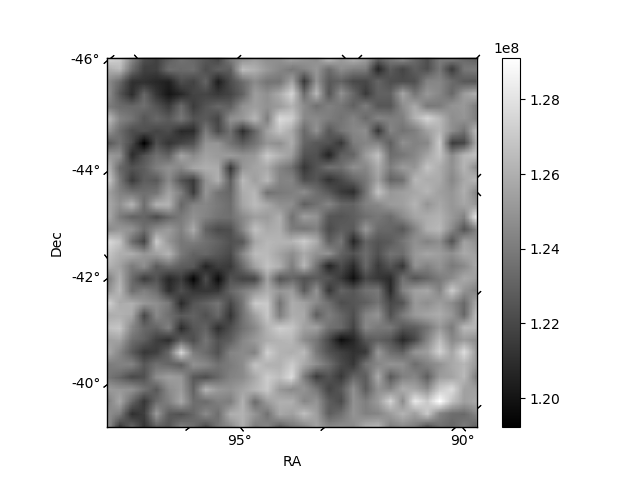
Histogram calculated using DETX and DETY for each event in the final _common_clean file
| Quadrant A | 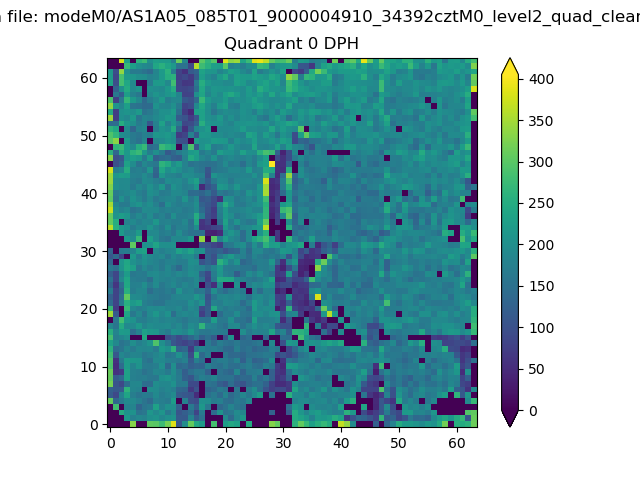 |
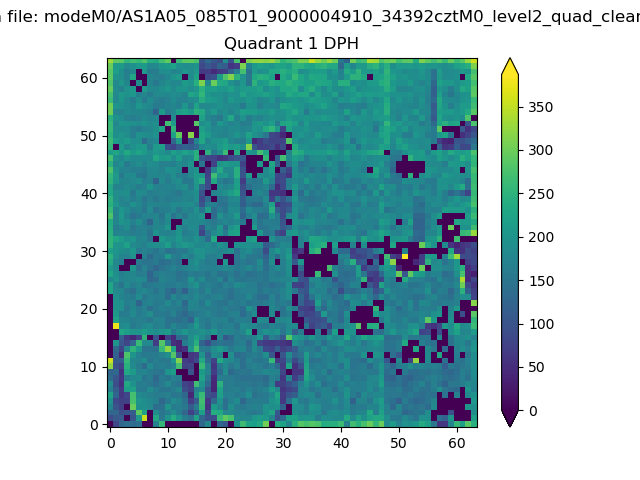 |
Quadrant B |
|---|---|---|---|
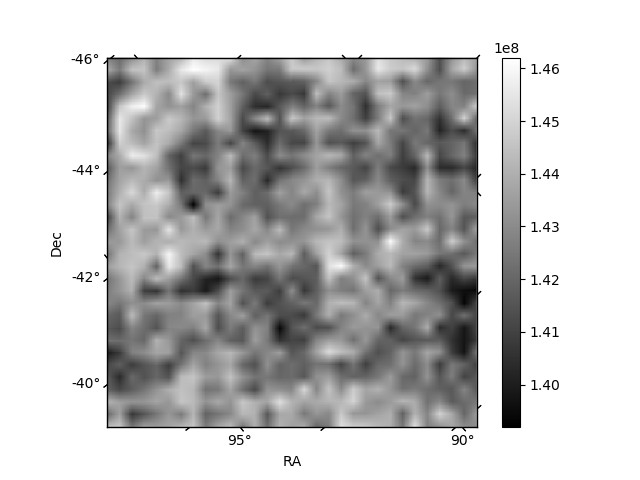
| Quadrant D | 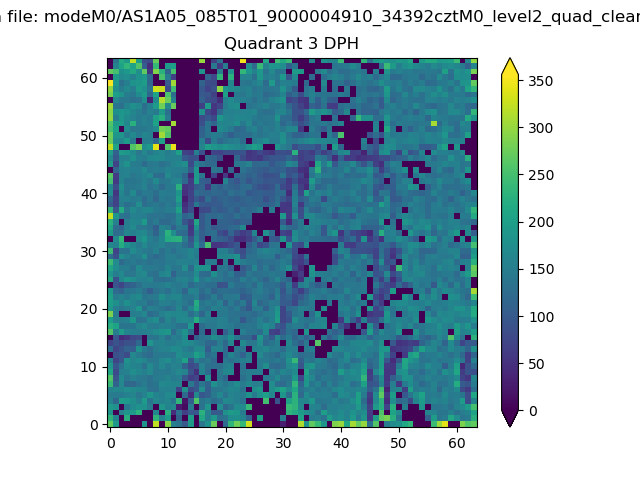 |
 |
Quadrant C |
| Plot type | Count rate plots | Images |
|---|---|---|
| Comparison with Poisson distribution Blue bars denote a histogram of data divided into 1 sec bins. Red curve is a Poisson curve with rate = median count rate of data. |
 |
 |
| Quadrant-wise count rates Data is divided into 100 sec bins |
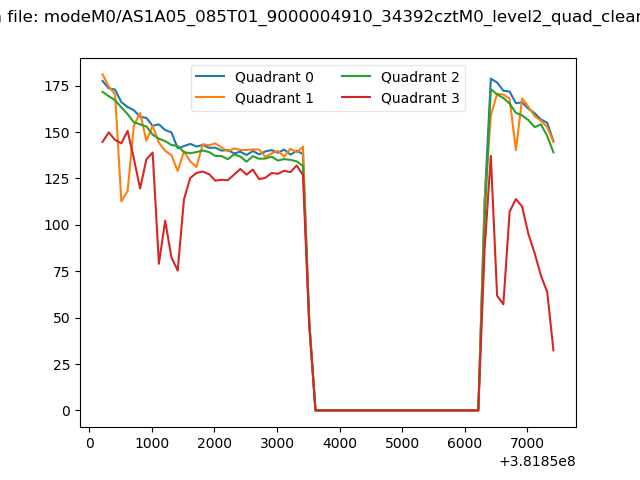 |
|
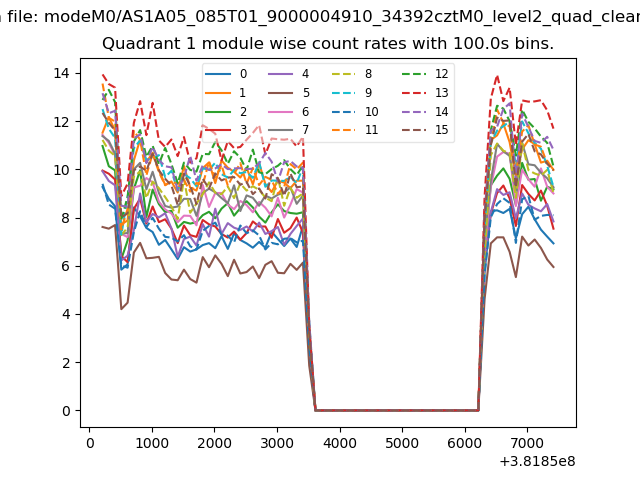
| Module-wise count rates for Quadrant A Data is divided into 100 sec bins |
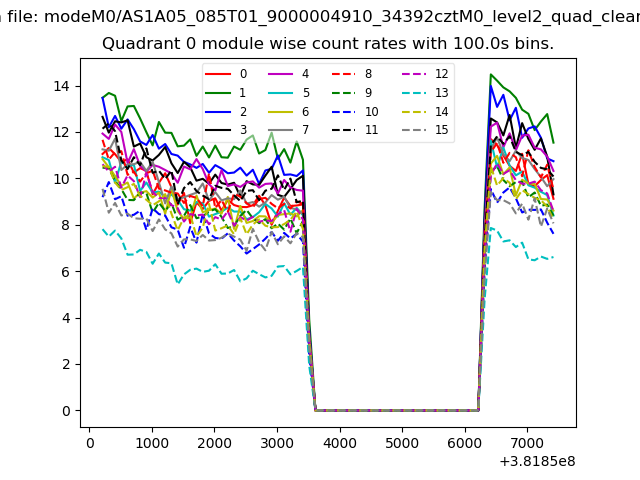 |
 |
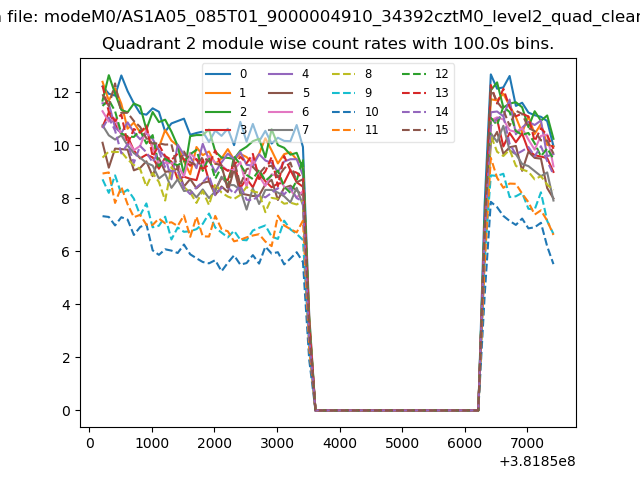
| Module-wise count rates for Quadrant B Data is divided into 100 sec bins |
 |
 |
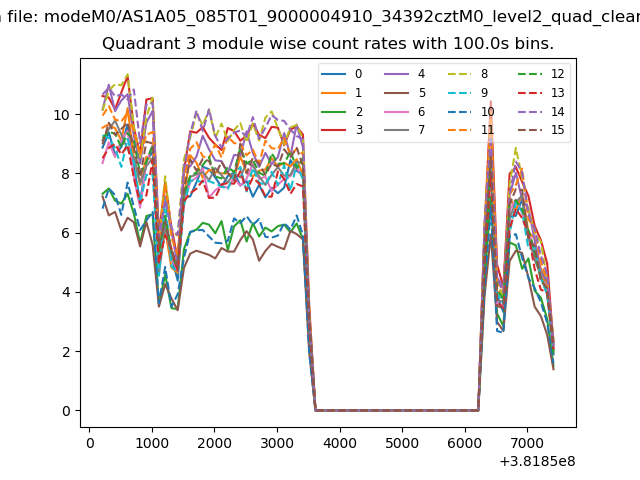
| Module-wise count rates for Quadrant C Data is divided into 100 sec bins |
 |
 |
| Module-wise count rates for Quadrant D Data is divided into 100 sec bins |
 |
 |
| Parameter | Plot |
|---|---|
| CZT HV Monitor | 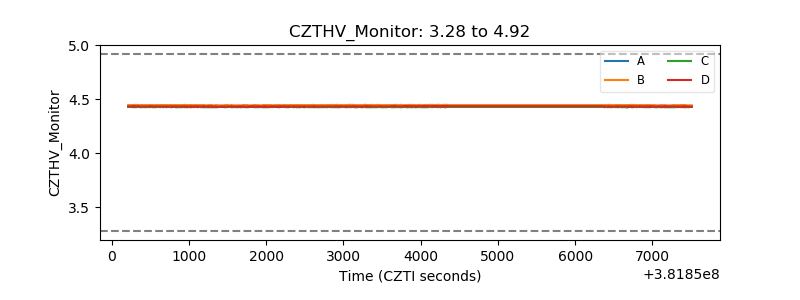 |
| D_VDD | 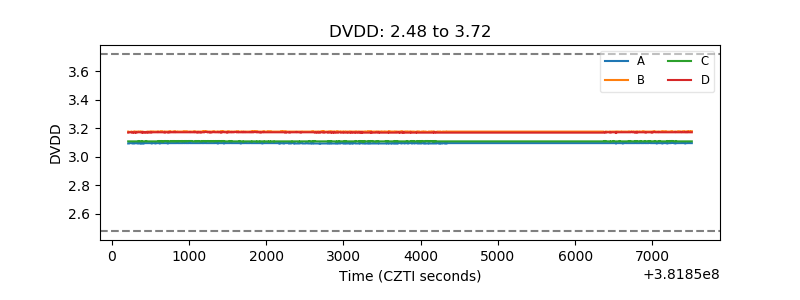 |
| Temperature 1 | 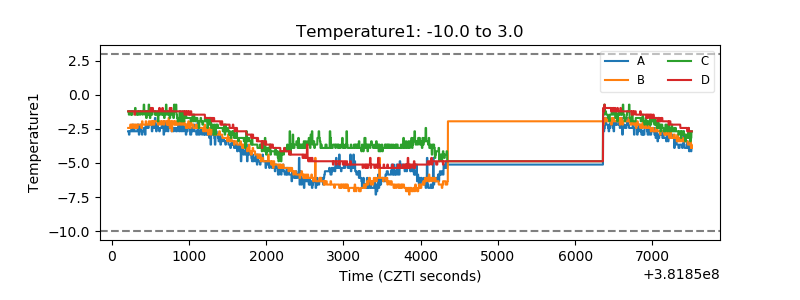 |
| Veto HV Monitor | 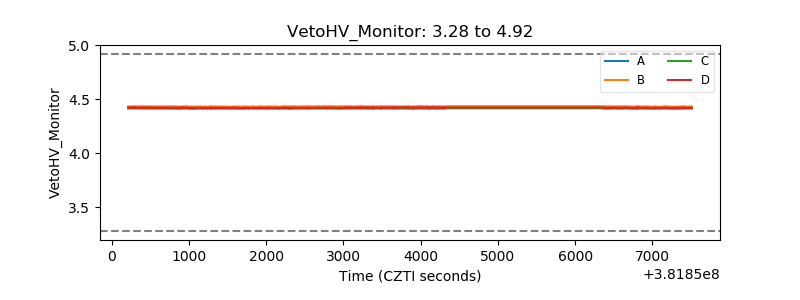 |
| Veto LLD | 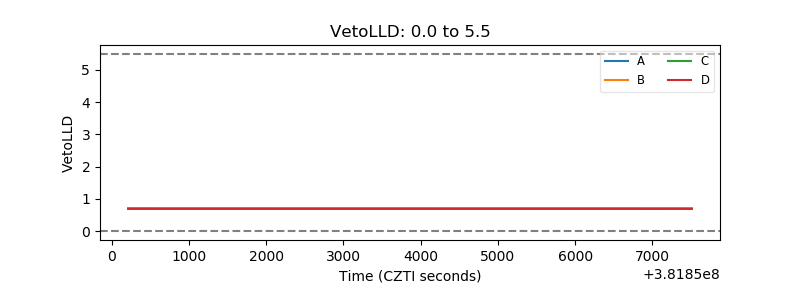 |
| Alpha Counter | 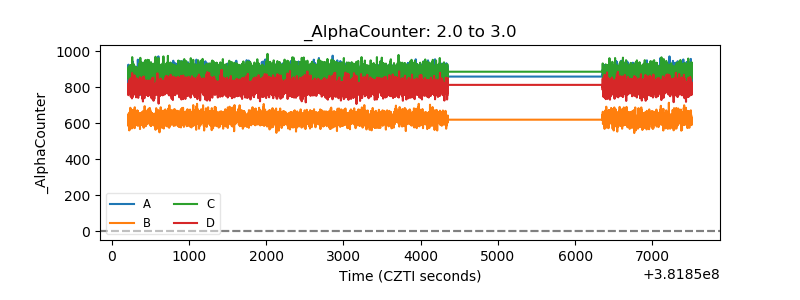 |
| _CPM_Rate | 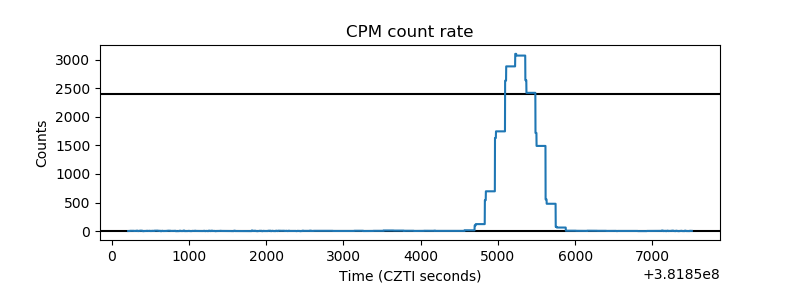 |
| CZT Counter | 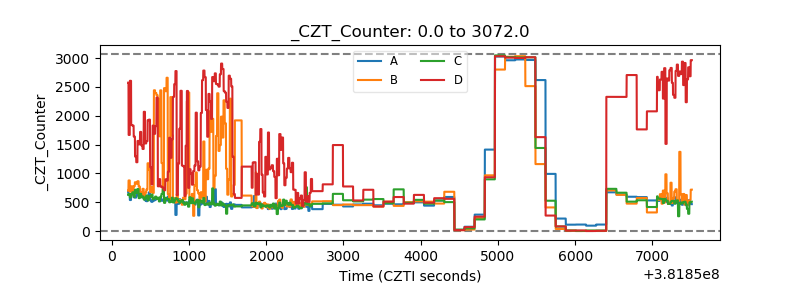 |
| +2.5 Volts monitor | 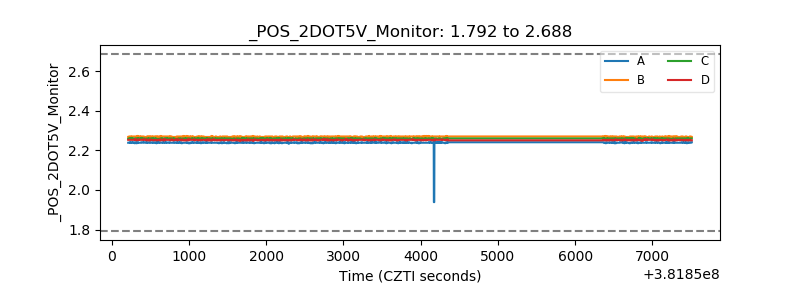 |
| +5 Volts monitor | 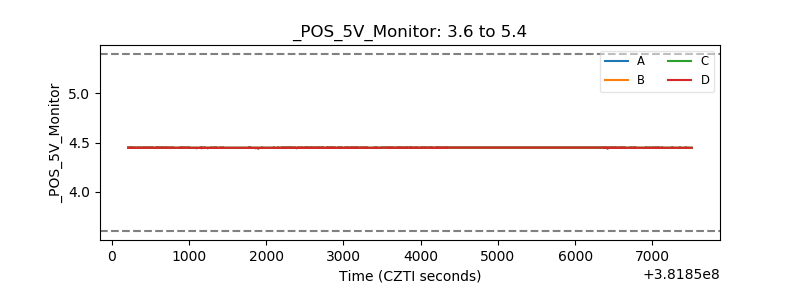 |
| _ROLL_ROT | 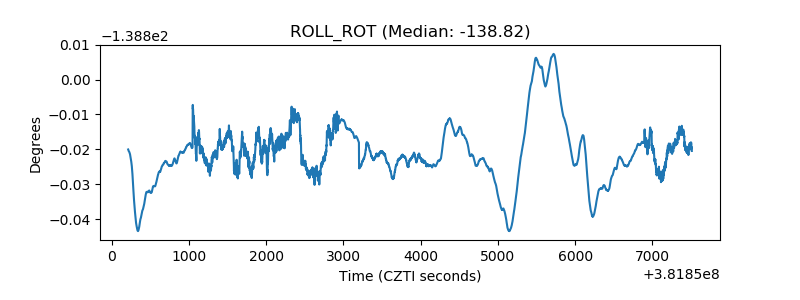 |
| _Roll_DEC | 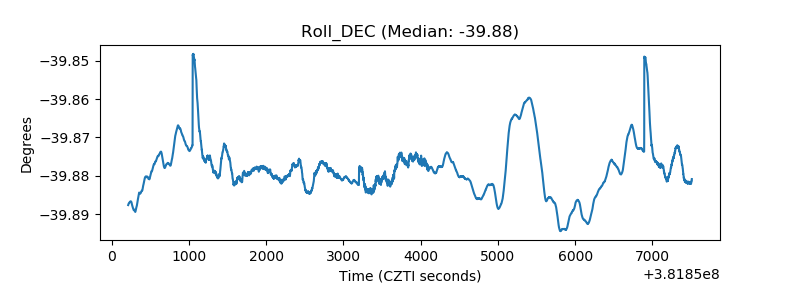 |
| _Roll_RA | 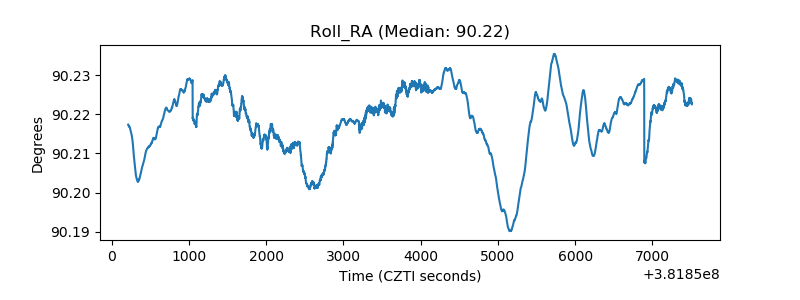 |
| Veto Counter | 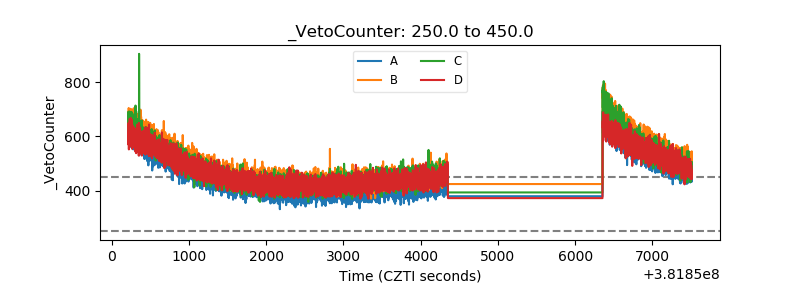 |