| Param | Original file | Final file |
|---|---|---|
| Filename | modeM0/AS1A05_085T01_9000004910_34388cztM0_level2.evt | modeM0/AS1A05_085T01_9000004910_34388cztM0_level2_quad_clean.evt |
| Size (bytes) | 638,098,560 | 76,320,000 |
| Size | 608.5 MB | 72.8 MB |
| Events in quadrant A | 2,597,406 | 523,468 |
| Events in quadrant B | 3,046,969 | 527,198 |
| Events in quadrant C | 2,936,952 | 529,041 |
| Events in quadrant D | 10,364,865 | 339,822 |
| Mode SS | |||
|---|---|---|---|
| Quadrant | BADHDUFLAG | Total packets | Discarded packets |
| A | 0 | 114 | 0 |
| B | 0 | 114 | 0 |
| C | 0 | 114 | 0 |
| D | 0 | 114 | 0 |
| Mode M9 | |||
|---|---|---|---|
| Quadrant | BADHDUFLAG | Total packets | Discarded packets |
| A | 0 | 22 | 0 |
| B | 0 | 22 | 0 |
| C | 0 | 22 | 0 |
| D | 0 | 23 | 0 |
| Mode M0 | |||
|---|---|---|---|
| Quadrant | BADHDUFLAG | Total packets | Discarded packets |
| A | 0 | 11370 | 3 |
| B | 0 | 12677 | 2 |
| C | 0 | 12128 | 2 |
| D | 0 | 34595 | 2 |
| Quadrant | Total seconds | Saturated seconds | Saturation percentage |
|---|---|---|---|
| A | 5579 | 6 | 0.107546% |
| B | 5579 | 134 | 2.401864% |
| C | 5579 | 27 | 0.483958% |
| D | 5579 | 3424 | 61.373006% |
Noise dominated data is calculated using 1-second bins in cleaned event files. If a bin has >2000 counts, and if more than 50% of those come from <1% of pixels, then it is considered to be noise-dominated and hence unusable.
| Quadrant | # 1 sec bins | Bins with >0 counts | Bins with >2000 counts | High rate bins dominated by noise | Noise dominated (total time) | Noise dominated (detector-on time) | Marked lightcurve |
|---|---|---|---|---|---|---|---|
| A | 7192 | 5580 | 0 | 0 | 0.00% | 0.00% | 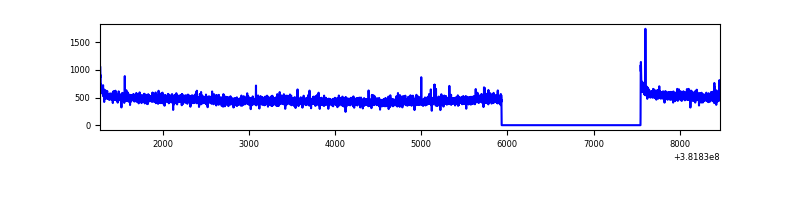 |
| B | 7192 | 5580 | 70 | 70 | 0.97% | 1.25% | 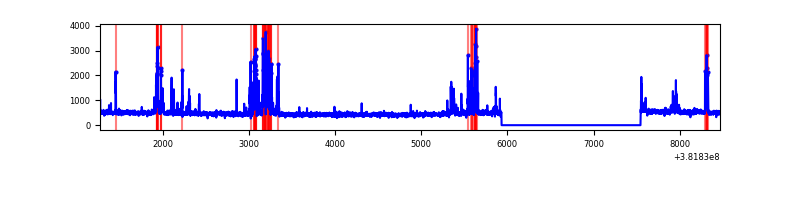 |
| C | 7192 | 5580 | 13 | 13 | 0.18% | 0.23% | 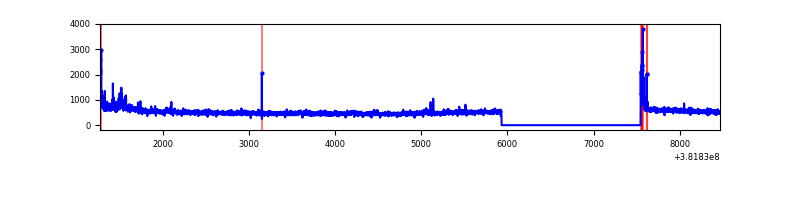 |
| D | 7192 | 5580 | 3155 | 3155 | 43.87% | 56.54% | 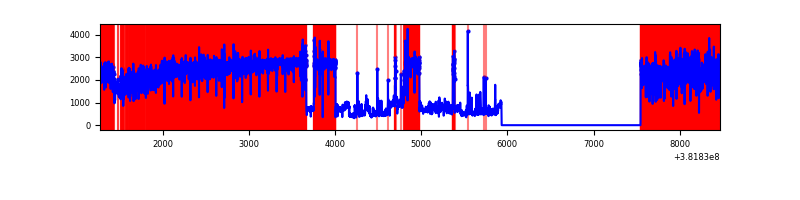 |
Top three noisy pixels from each quadrant. If the there are fewer than three noisy pixels in the level2.evt file, extra rows are filled as -1
| Pixel properties | Quadrant properties | ||||||
|---|---|---|---|---|---|---|---|
| Quadrant | DetID | PixID | Counts | Sigma | Mean | Median | Sigma |
| A | 10 | 83 | 33580 | 250.56 | 657 | 645 | 131.4 |
| A | 13 | 254 | 9747 | 69.24 | 657 | 645 | 131.4 |
| A | 9 | 143 | 8502 | 59.77 | 657 | 645 | 131.4 |
| B | 5 | 172 | 441657 | 3505.91 | 649 | 632 | 125.8 |
| B | 5 | 255 | 44645 | 349.88 | 649 | 632 | 125.8 |
| B | 12 | 111 | 15438 | 117.7 | 649 | 632 | 125.8 |
| C | 15 | 214 | 237761 | 1595.0 | 637 | 641 | 148.7 |
| C | 4 | 254 | 86471 | 577.34 | 637 | 641 | 148.7 |
| C | 0 | 10 | 68695 | 457.77 | 637 | 641 | 148.7 |
| D | 7 | 223 | 7317522 | 63224.48 | 476 | 463 | 115.7 |
| D | 8 | 195 | 835544 | 7215.68 | 476 | 463 | 115.7 |
| D | 12 | 235 | 95204 | 818.63 | 476 | 463 | 115.7 |
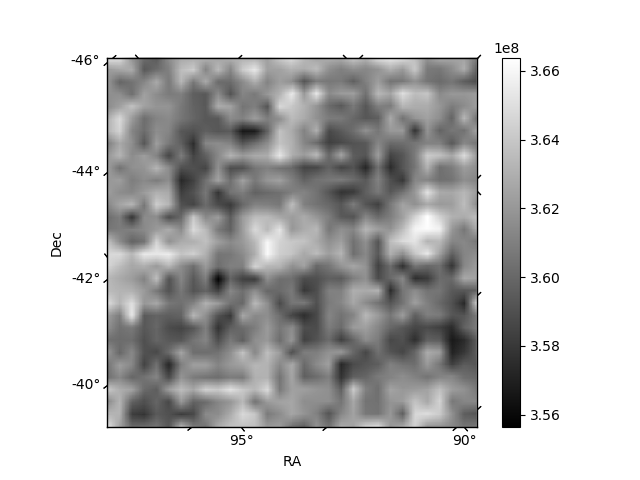
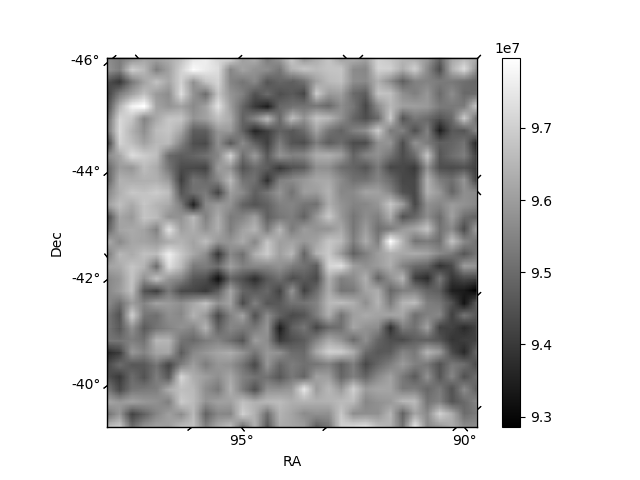
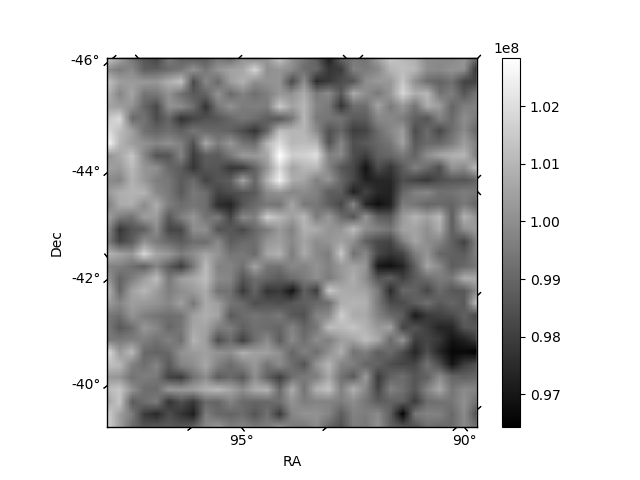
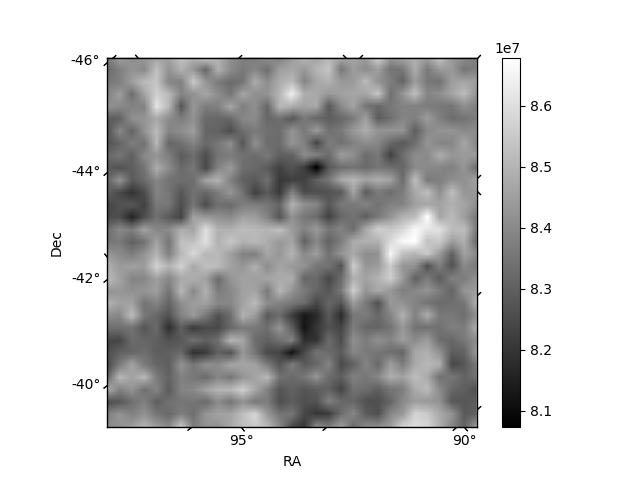
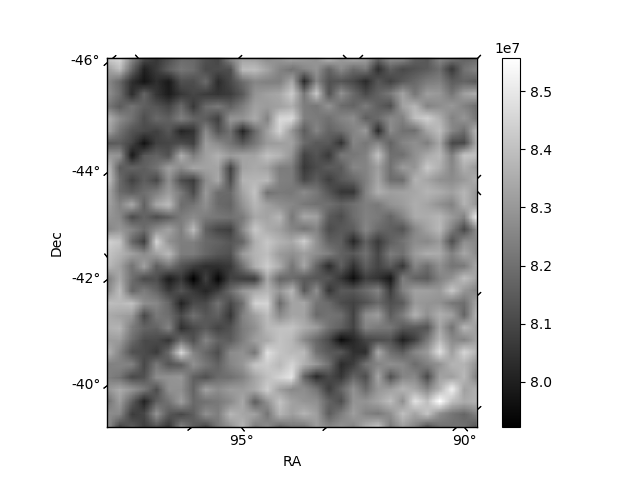
Histogram calculated using DETX and DETY for each event in the final _common_clean file
| Quadrant A | 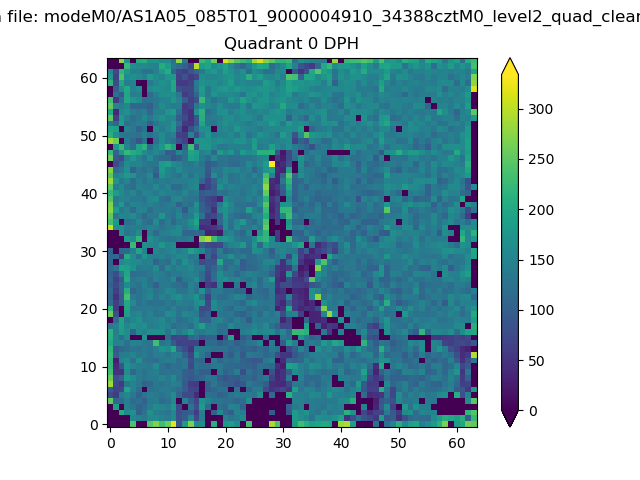 |
 |
Quadrant B |
|---|---|---|---|
| Quadrant D | 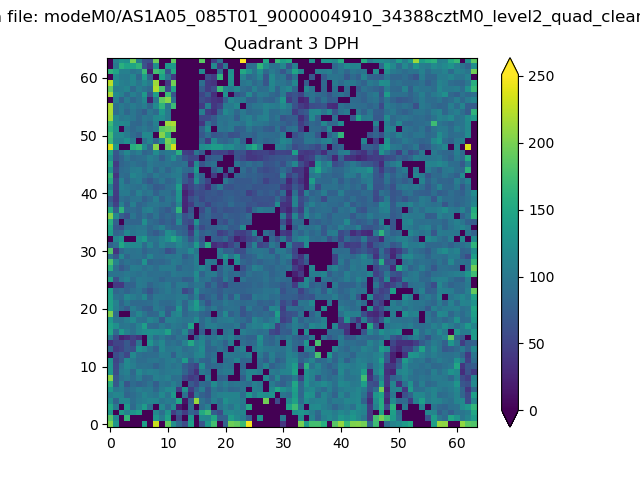 |
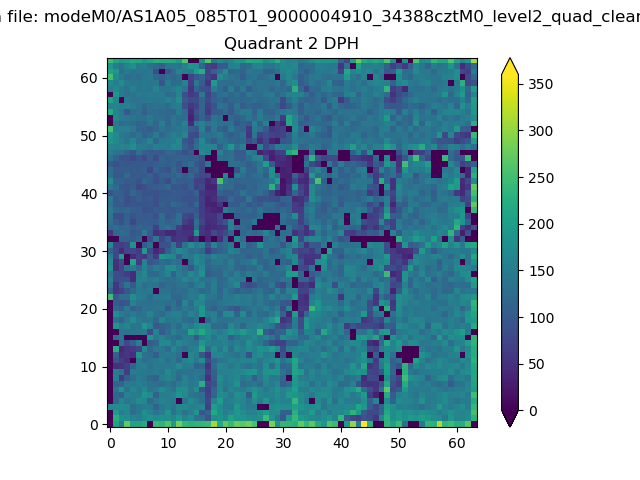 |
Quadrant C |
| Plot type | Count rate plots | Images |
|---|---|---|
| Comparison with Poisson distribution Blue bars denote a histogram of data divided into 1 sec bins. Red curve is a Poisson curve with rate = median count rate of data. |
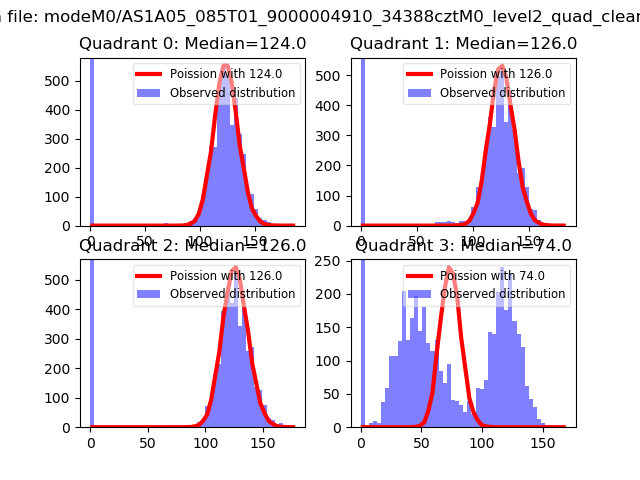 |
 |
| Quadrant-wise count rates Data is divided into 100 sec bins |
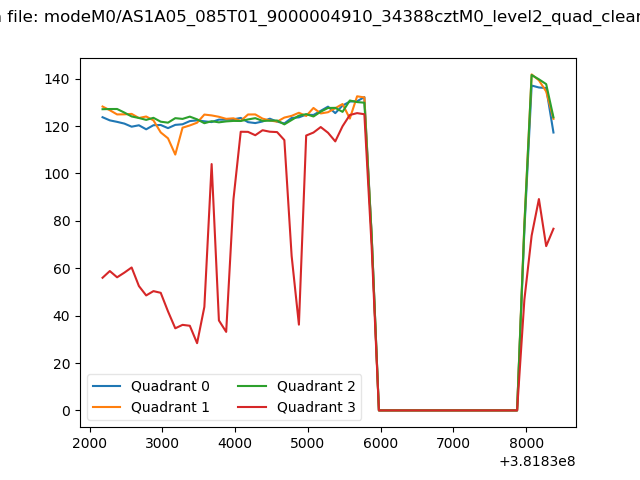 |
|
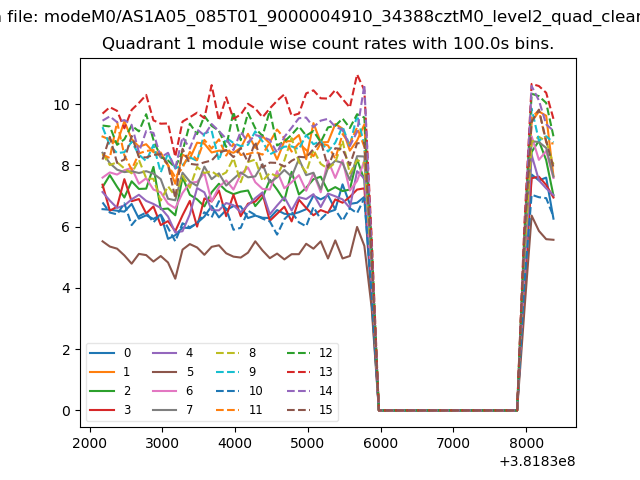
| Module-wise count rates for Quadrant A Data is divided into 100 sec bins |
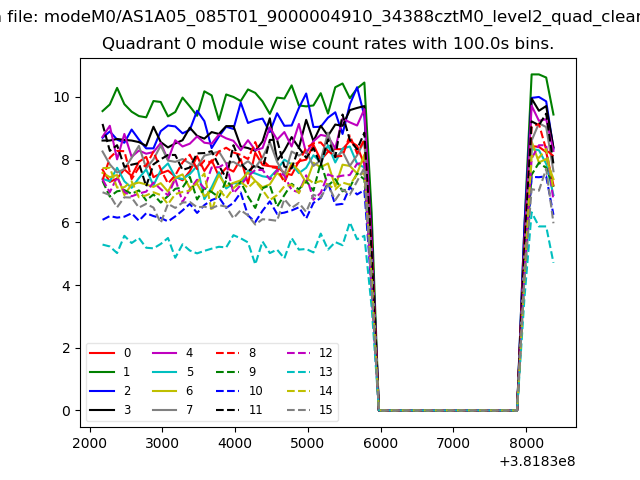 |
 |
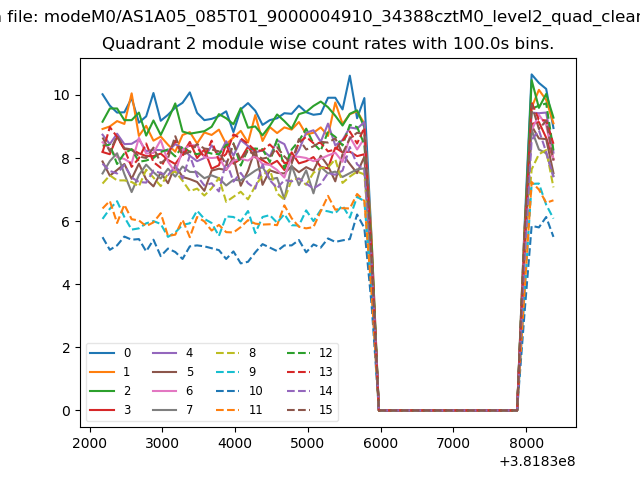
| Module-wise count rates for Quadrant B Data is divided into 100 sec bins |
 |
 |
| Module-wise count rates for Quadrant C Data is divided into 100 sec bins |
 |
 |
| Module-wise count rates for Quadrant D Data is divided into 100 sec bins |
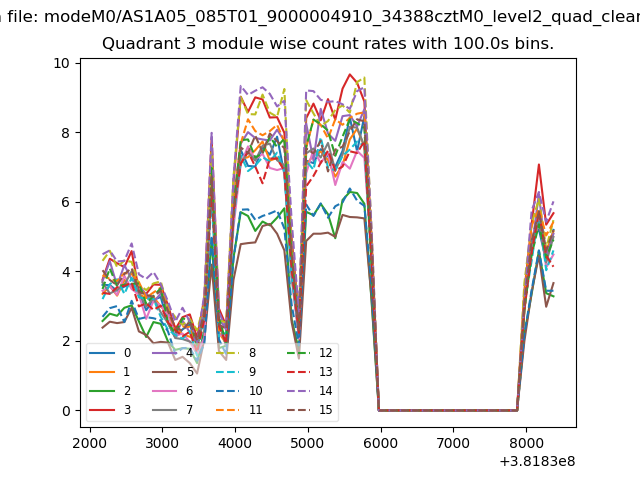 |
 |
| Parameter | Plot |
|---|---|
| CZT HV Monitor | 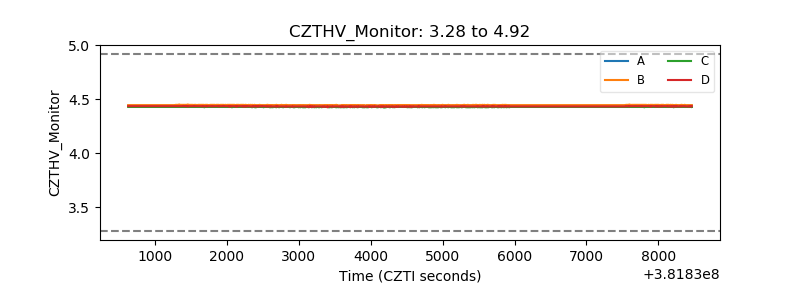 |
| D_VDD | 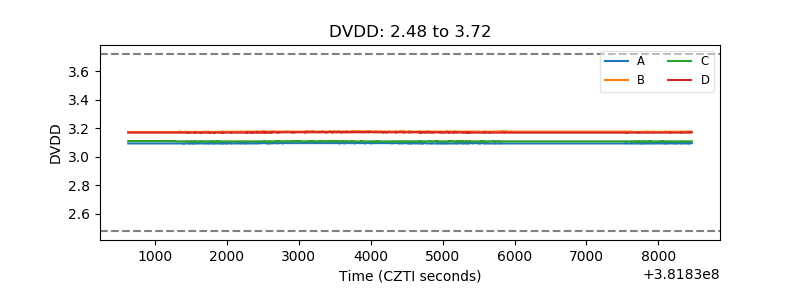 |
| Temperature 1 | 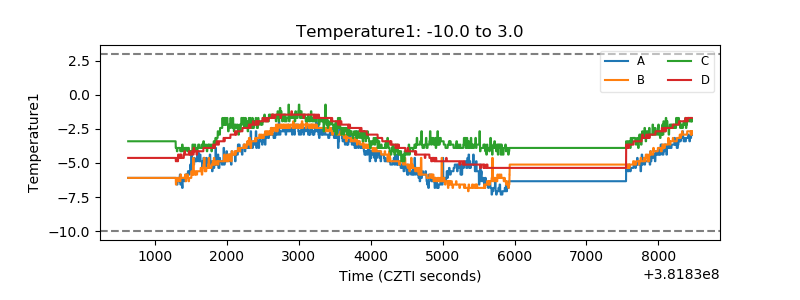 |
| Veto HV Monitor | 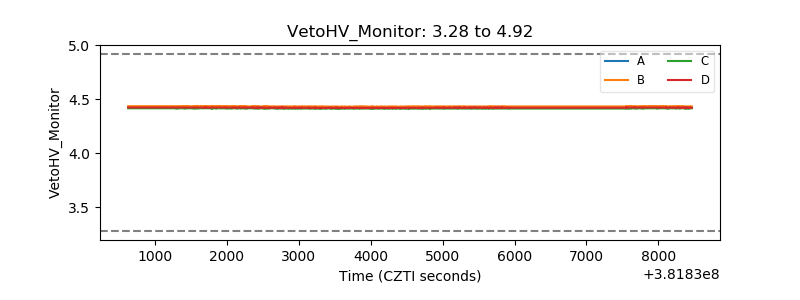 |
| Veto LLD | 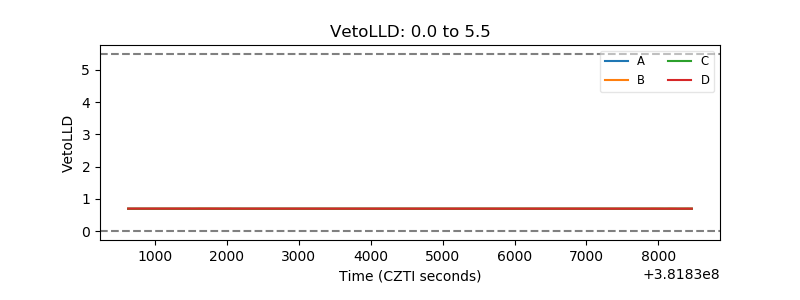 |
| Alpha Counter | 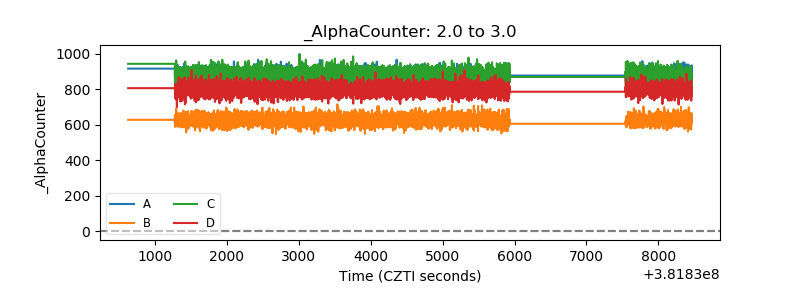 |
| _CPM_Rate | 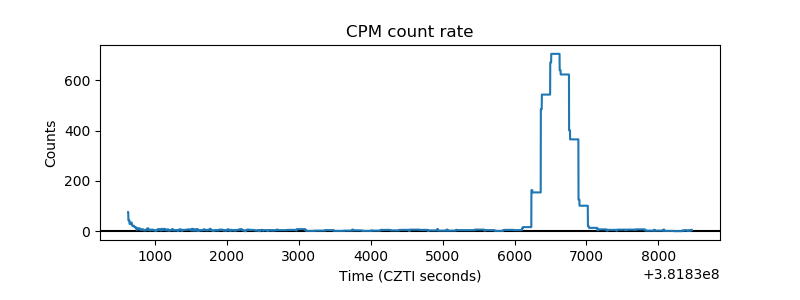 |
| CZT Counter | 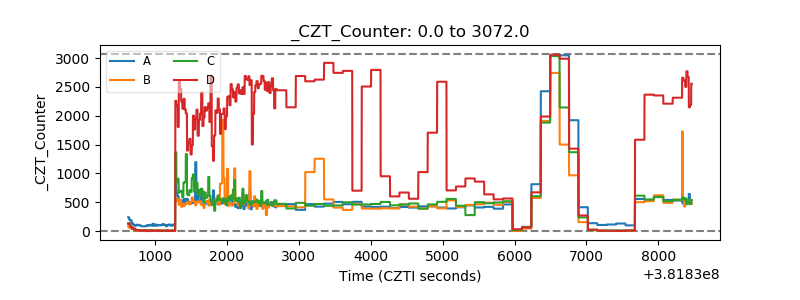 |
| +2.5 Volts monitor | 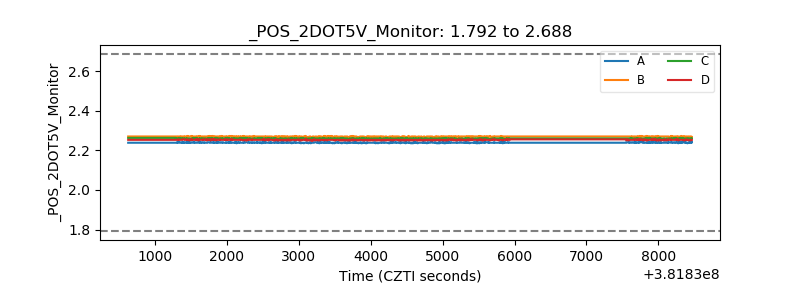 |
| +5 Volts monitor | 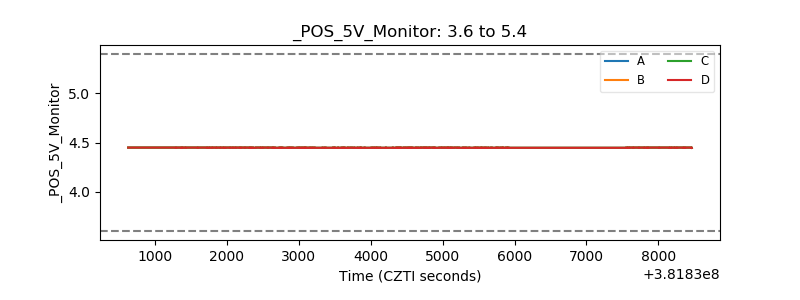 |
| _ROLL_ROT | 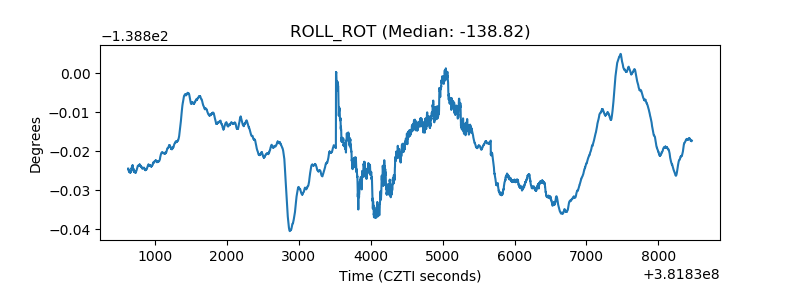 |
| _Roll_DEC | 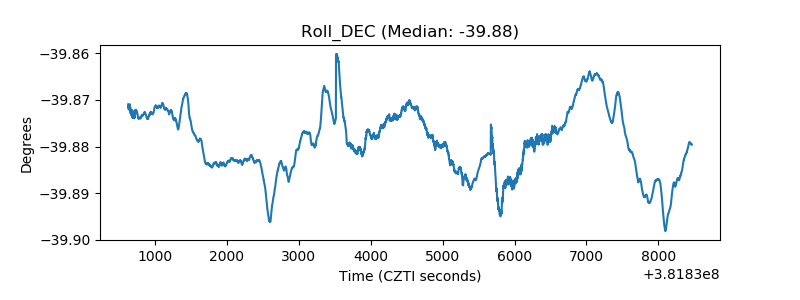 |
| _Roll_RA | 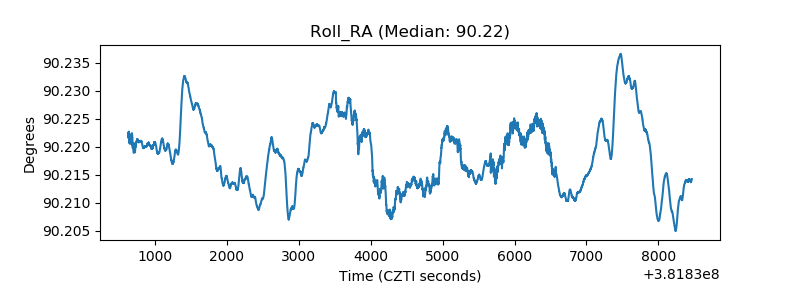 |
| Veto Counter |  |