| Param | Original file | Final file |
|---|---|---|
| Filename | modeM0/AS1A05_085T01_9000004910_34387cztM0_level2.evt | modeM0/AS1A05_085T01_9000004910_34387cztM0_level2_quad_clean.evt |
| Size (bytes) | 2,003,423,040 | 180,414,720 |
| Size | 1.9 GB | 172.1 MB |
| Events in quadrant A | 7,214,328 | 1,212,193 |
| Events in quadrant B | 8,599,892 | 1,208,093 |
| Events in quadrant C | 12,017,041 | 1,201,417 |
| Events in quadrant D | 31,783,962 | 752,819 |
| Mode SS | |||
|---|---|---|---|
| Quadrant | BADHDUFLAG | Total packets | Discarded packets |
| A | 0 | 324 | 0 |
| B | 0 | 324 | 0 |
| C | 0 | 324 | 0 |
| D | 0 | 324 | 0 |
| Mode M9 | |||
|---|---|---|---|
| Quadrant | BADHDUFLAG | Total packets | Discarded packets |
| A | 0 | 55 | 0 |
| B | 0 | 55 | 0 |
| C | 0 | 55 | 0 |
| D | 0 | 55 | 0 |
| Mode M0 | |||
|---|---|---|---|
| Quadrant | BADHDUFLAG | Total packets | Discarded packets |
| A | 0 | 31894 | 5 |
| B | 0 | 35770 | 4 |
| C | 0 | 46572 | 4 |
| D | 0 | 105207 | 4 |
| Quadrant | Total seconds | Saturated seconds | Saturation percentage |
|---|---|---|---|
| A | 15747 | 13 | 0.082555% |
| B | 15747 | 388 | 2.463961% |
| C | 15747 | 319 | 2.025783% |
| D | 15747 | 10097 | 64.120150% |
Noise dominated data is calculated using 1-second bins in cleaned event files. If a bin has >2000 counts, and if more than 50% of those come from <1% of pixels, then it is considered to be noise-dominated and hence unusable.
| Quadrant | # 1 sec bins | Bins with >0 counts | Bins with >2000 counts | High rate bins dominated by noise | Noise dominated (total time) | Noise dominated (detector-on time) | Marked lightcurve |
|---|---|---|---|---|---|---|---|
| A | 21237 | 15751 | 1 | 1 | 0.00% | 0.01% | 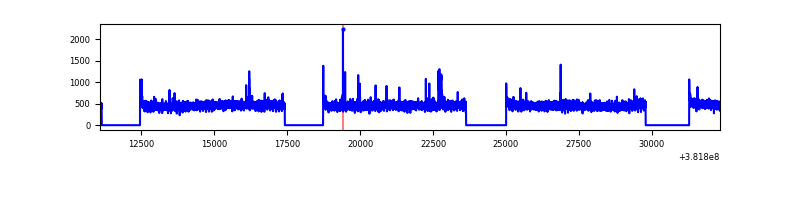 |
| B | 21237 | 15751 | 258 | 258 | 1.21% | 1.64% | 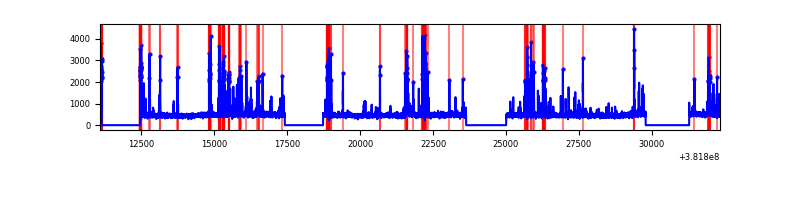 |
| C | 21237 | 15751 | 265 | 265 | 1.25% | 1.68% | 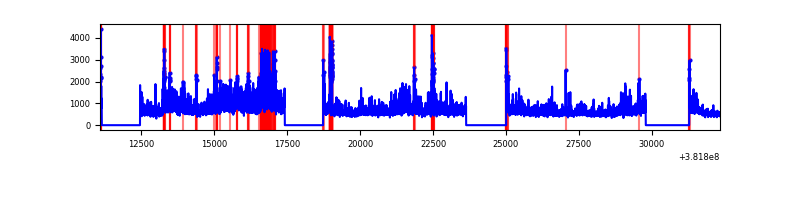 |
| D | 21236 | 15749 | 9771 | 9771 | 46.01% | 62.04% | 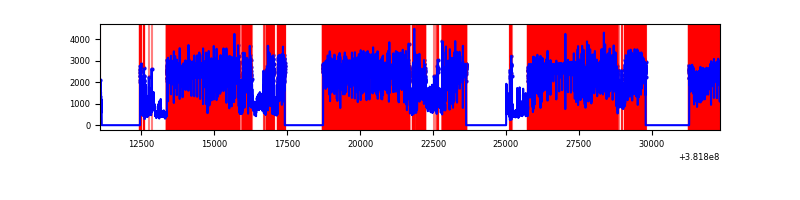 |
Top three noisy pixels from each quadrant. If the there are fewer than three noisy pixels in the level2.evt file, extra rows are filled as -1
| Pixel properties | Quadrant properties | ||||||
|---|---|---|---|---|---|---|---|
| Quadrant | DetID | PixID | Counts | Sigma | Mean | Median | Sigma |
| A | 10 | 83 | 71491 | 191.16 | 1815 | 1779 | 364.7 |
| A | 5 | 168 | 55369 | 146.95 | 1815 | 1779 | 364.7 |
| A | 9 | 143 | 43112 | 113.34 | 1815 | 1779 | 364.7 |
| B | 5 | 172 | 1232845 | 3605.91 | 1791 | 1743 | 341.4 |
| B | 5 | 200 | 176461 | 511.75 | 1791 | 1743 | 341.4 |
| B | 12 | 111 | 43490 | 122.28 | 1791 | 1743 | 341.4 |
| C | 4 | 254 | 4147913 | 10354.57 | 1751 | 1765 | 400.4 |
| C | 15 | 214 | 648098 | 1614.15 | 1751 | 1765 | 400.4 |
| C | 14 | 67 | 200270 | 495.75 | 1751 | 1765 | 400.4 |
| D | 7 | 223 | 12184242 | 39330.08 | 1264 | 1226 | 309.8 |
| D | 2 | 249 | 10310505 | 33281.15 | 1264 | 1226 | 309.8 |
| D | 8 | 195 | 2640445 | 8520.11 | 1264 | 1226 | 309.8 |
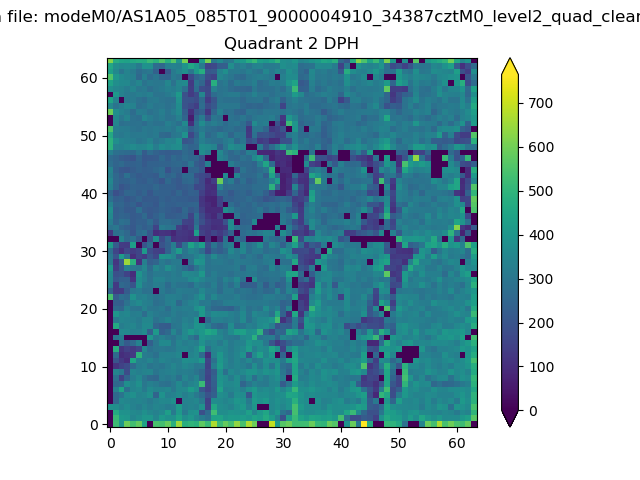
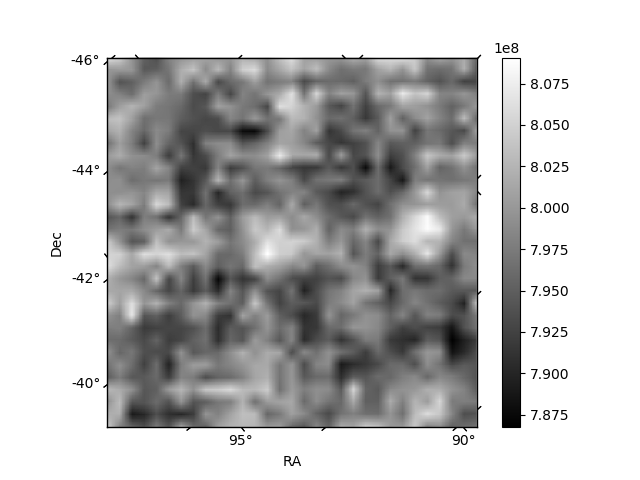
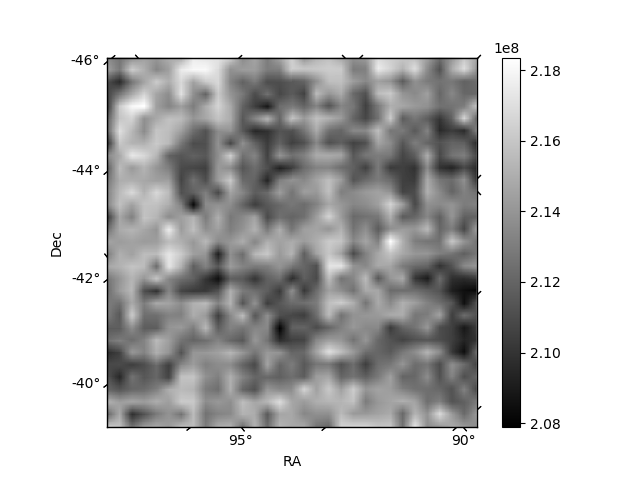
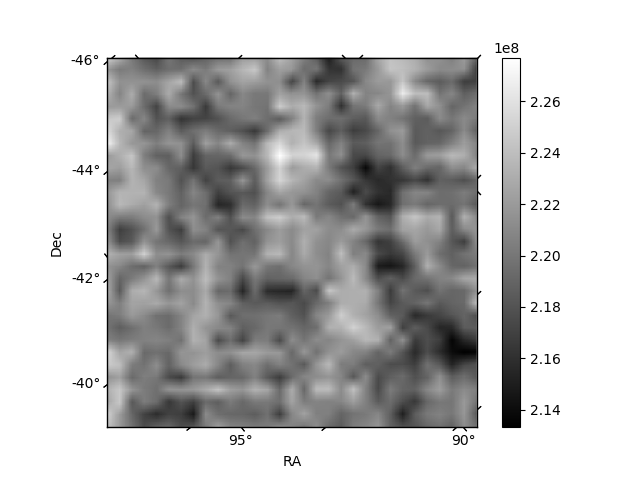
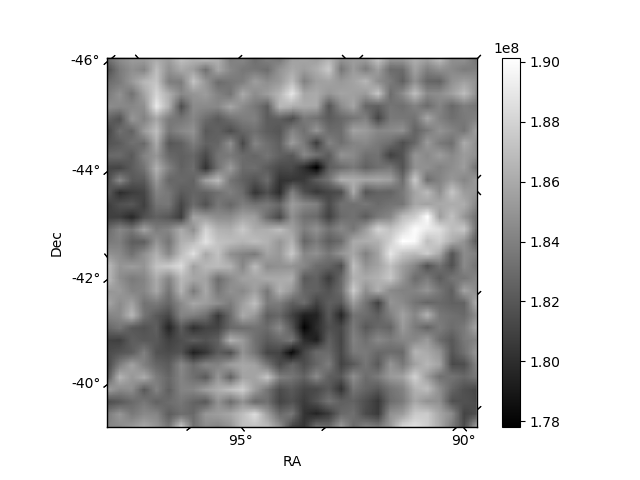
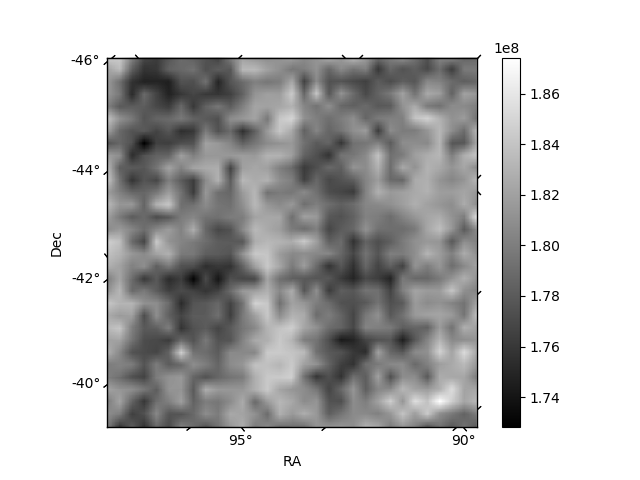
Histogram calculated using DETX and DETY for each event in the final _common_clean file
| Quadrant A | 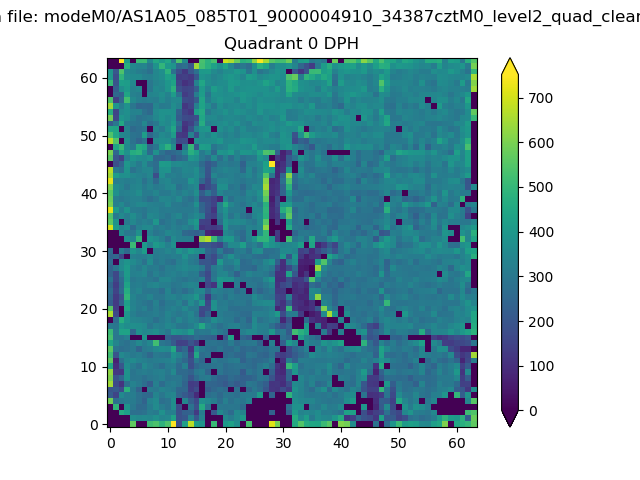 |
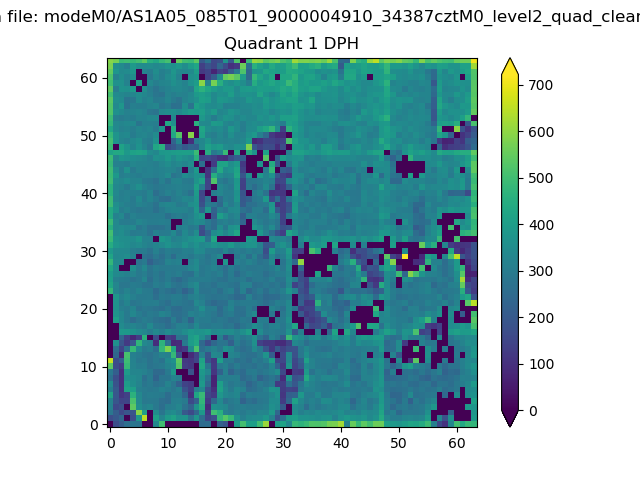 |
Quadrant B |
|---|---|---|---|
| Quadrant D | 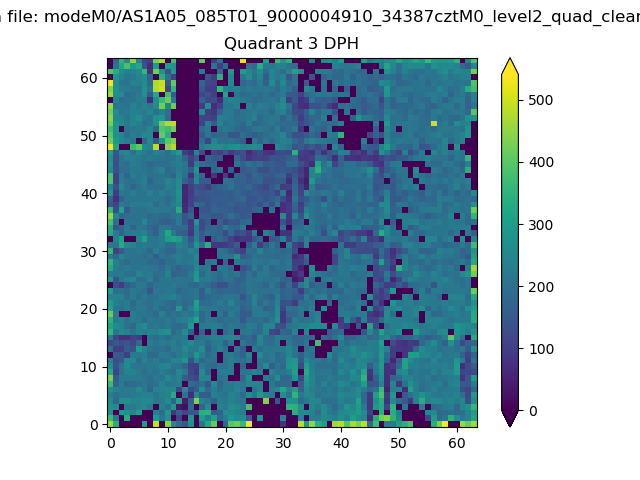 |
 |
Quadrant C |
| Plot type | Count rate plots | Images |
|---|---|---|
| Comparison with Poisson distribution Blue bars denote a histogram of data divided into 1 sec bins. Red curve is a Poisson curve with rate = median count rate of data. |
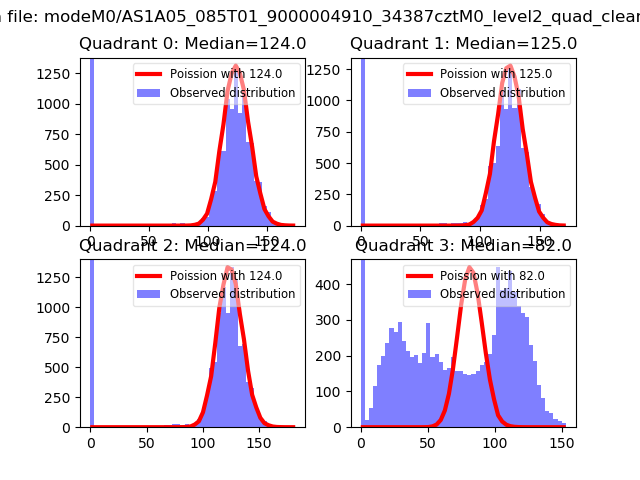 |
 |
| Quadrant-wise count rates Data is divided into 100 sec bins |
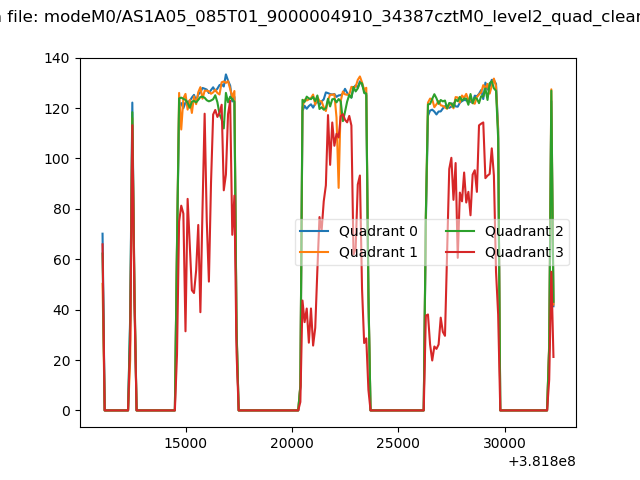 |
|
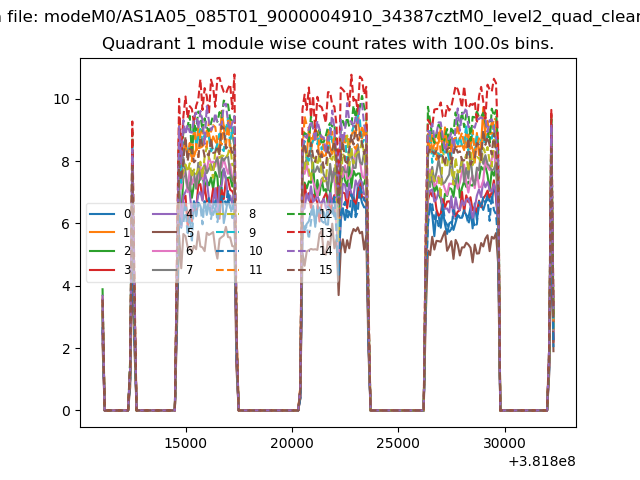
| Module-wise count rates for Quadrant A Data is divided into 100 sec bins |
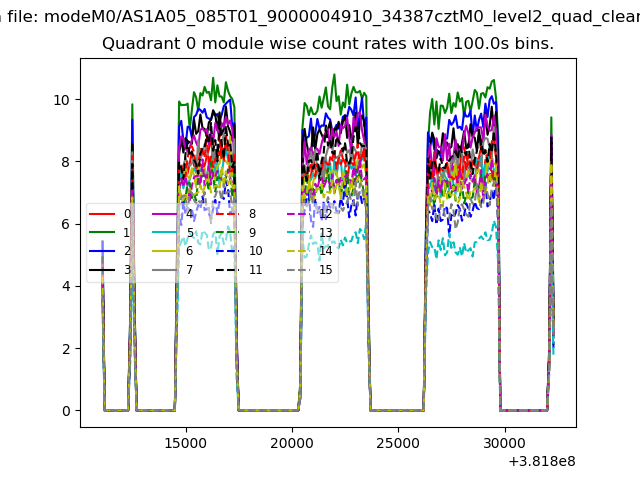 |
 |
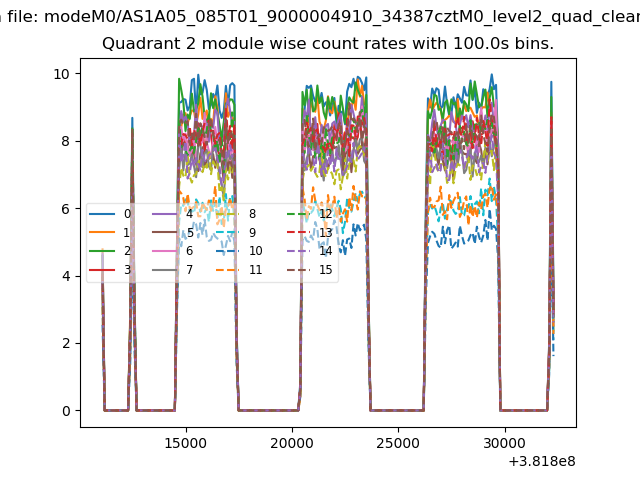
| Module-wise count rates for Quadrant B Data is divided into 100 sec bins |
 |
 |
| Module-wise count rates for Quadrant C Data is divided into 100 sec bins |
 |
 |
| Module-wise count rates for Quadrant D Data is divided into 100 sec bins |
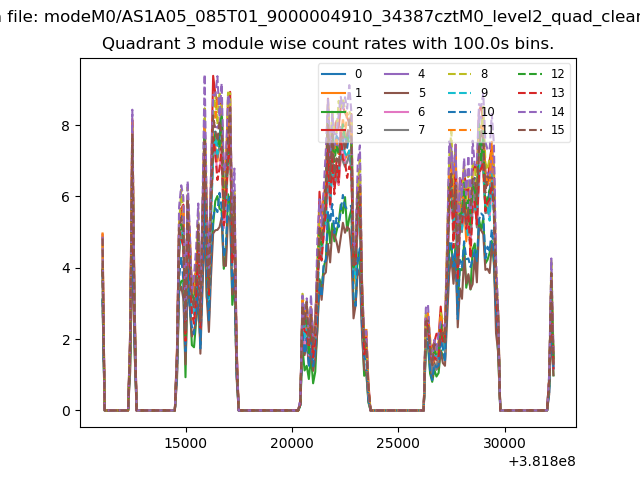 |
 |
| Parameter | Plot |
|---|---|
| CZT HV Monitor | 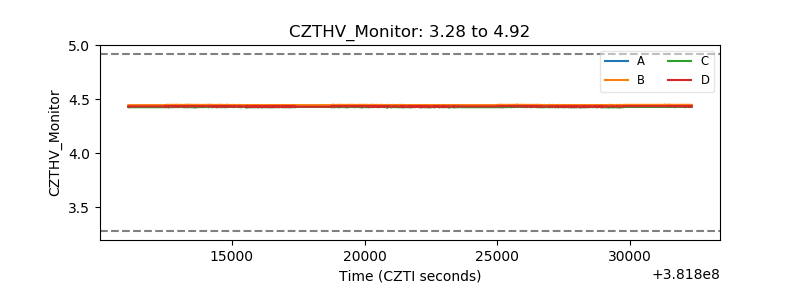 |
| D_VDD | 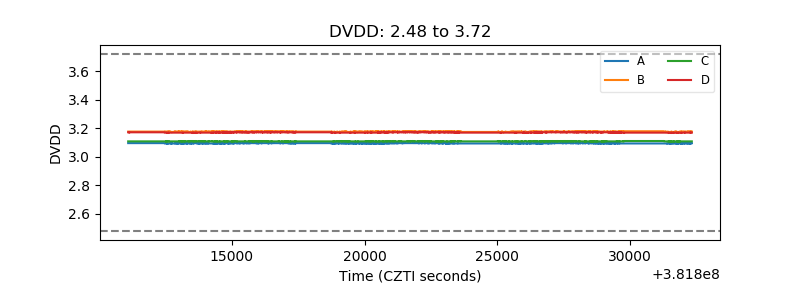 |
| Temperature 1 | 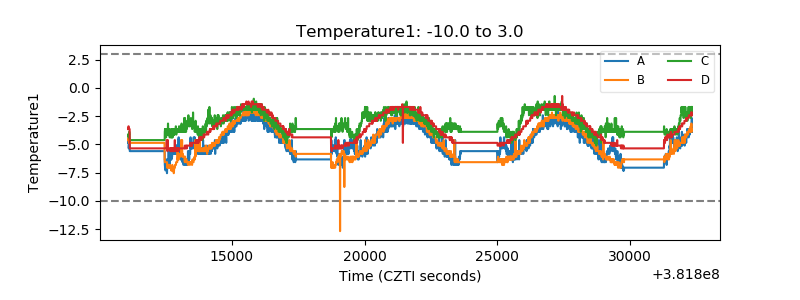 |
| Veto HV Monitor | 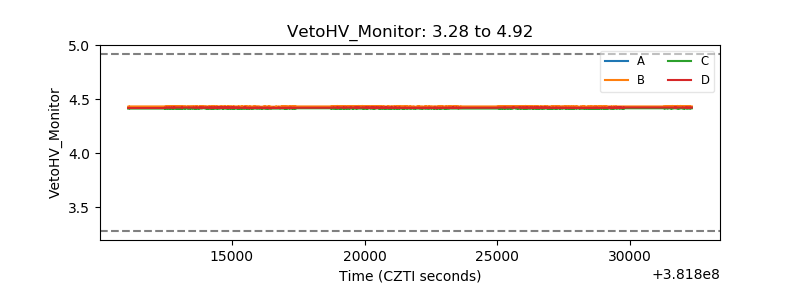 |
| Veto LLD | 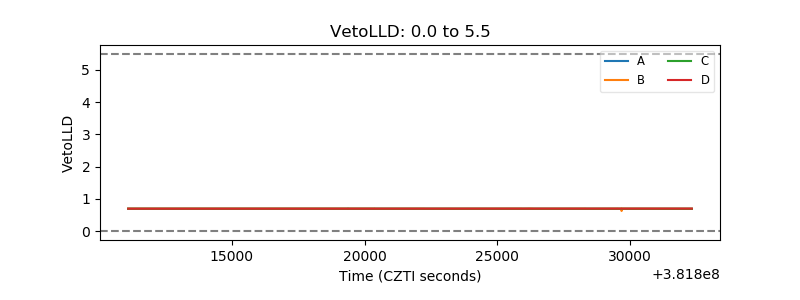 |
| Alpha Counter | 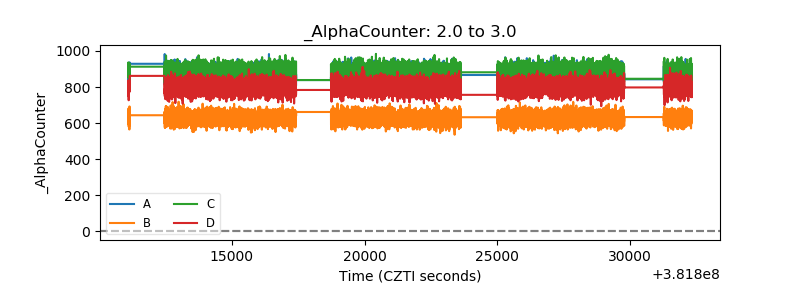 |
| _CPM_Rate |  |
| CZT Counter | 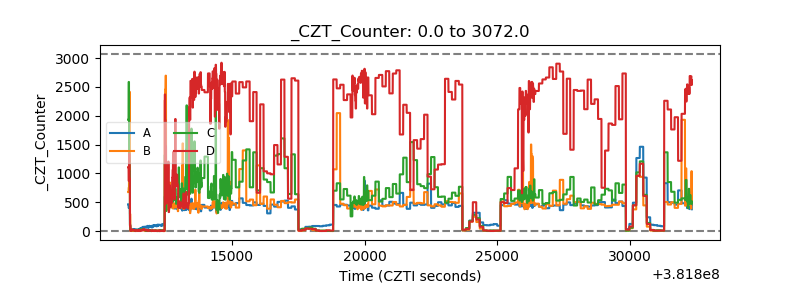 |
| +2.5 Volts monitor | 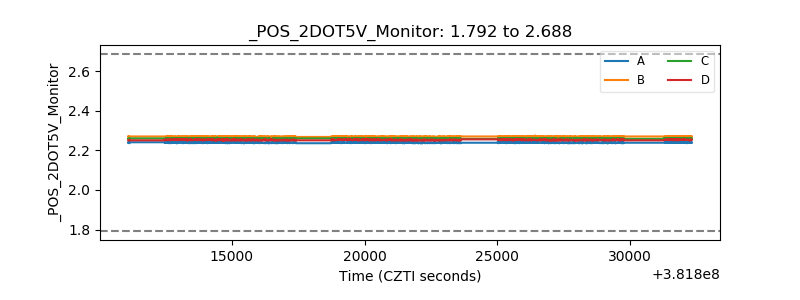 |
| +5 Volts monitor | 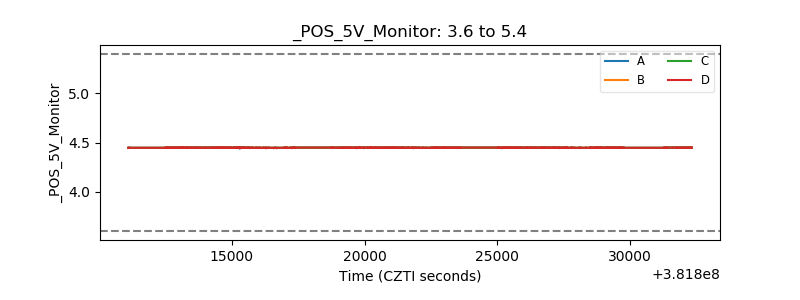 |
| _ROLL_ROT | 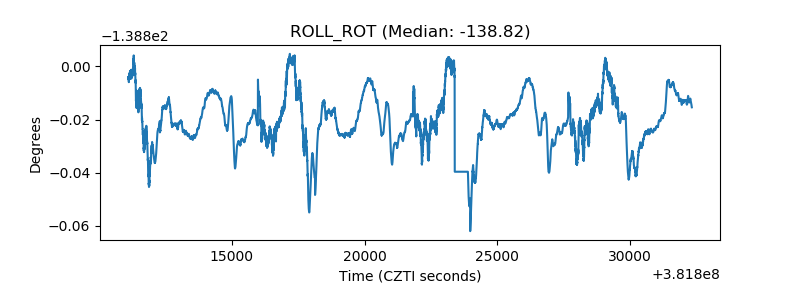 |
| _Roll_DEC | 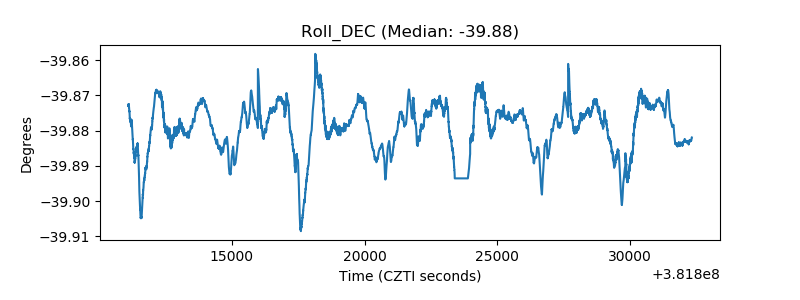 |
| _Roll_RA | 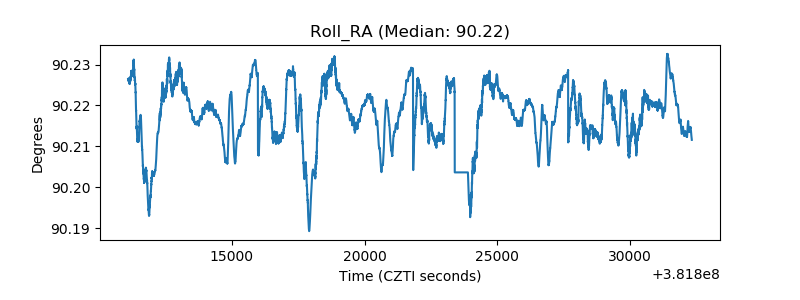 |
| Veto Counter | 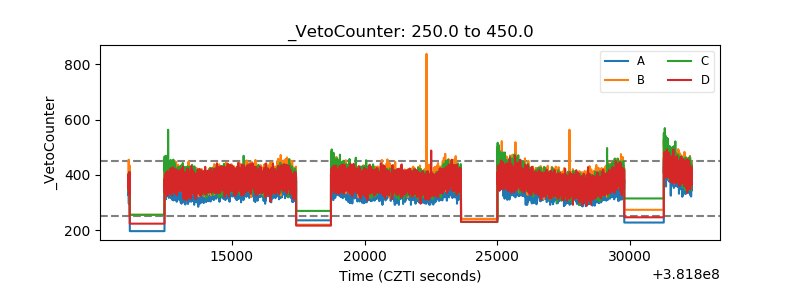 |