| Param | Original file | Final file |
|---|---|---|
| Filename | modeM0/AS1A05_085T01_9000004910_34384cztM0_level2.evt | modeM0/AS1A05_085T01_9000004910_34384cztM0_level2_quad_clean.evt |
| Size (bytes) | 774,216,000 | 69,200,640 |
| Size | 738.3 MB | 66.0 MB |
| Events in quadrant A | 2,864,505 | 456,138 |
| Events in quadrant B | 3,748,418 | 445,431 |
| Events in quadrant C | 6,152,563 | 442,645 |
| Events in quadrant D | 10,260,113 | 313,778 |
| Mode SS | |||
|---|---|---|---|
| Quadrant | BADHDUFLAG | Total packets | Discarded packets |
| A | 0 | 130 | 0 |
| B | 0 | 130 | 0 |
| C | 0 | 130 | 0 |
| D | 0 | 130 | 0 |
| Mode M9 | |||
|---|---|---|---|
| Quadrant | BADHDUFLAG | Total packets | Discarded packets |
| A | 0 | 27 | 0 |
| B | 0 | 27 | 0 |
| C | 0 | 27 | 0 |
| D | 0 | 27 | 0 |
| Mode M0 | |||
|---|---|---|---|
| Quadrant | BADHDUFLAG | Total packets | Discarded packets |
| A | 0 | 12632 | 3 |
| B | 0 | 15198 | 2 |
| C | 0 | 22786 | 2 |
| D | 0 | 34844 | 2 |
| Quadrant | Total seconds | Saturated seconds | Saturation percentage |
|---|---|---|---|
| A | 6251 | 8 | 0.127980% |
| B | 6251 | 268 | 4.287314% |
| C | 6251 | 653 | 10.446329% |
| D | 6251 | 2078 | 33.242681% |
Noise dominated data is calculated using 1-second bins in cleaned event files. If a bin has >2000 counts, and if more than 50% of those come from <1% of pixels, then it is considered to be noise-dominated and hence unusable.
| Quadrant | # 1 sec bins | Bins with >0 counts | Bins with >2000 counts | High rate bins dominated by noise | Noise dominated (total time) | Noise dominated (detector-on time) | Marked lightcurve |
|---|---|---|---|---|---|---|---|
| A | 8997 | 6253 | 0 | 0 | 0.00% | 0.00% | 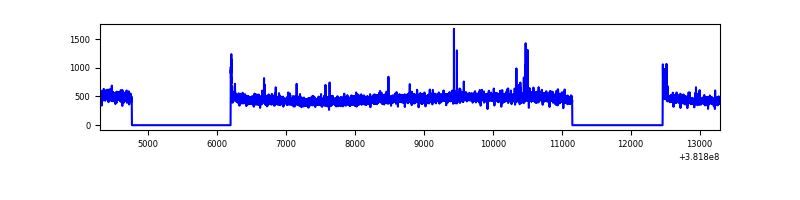 |
| B | 8997 | 6253 | 191 | 191 | 2.12% | 3.05% | 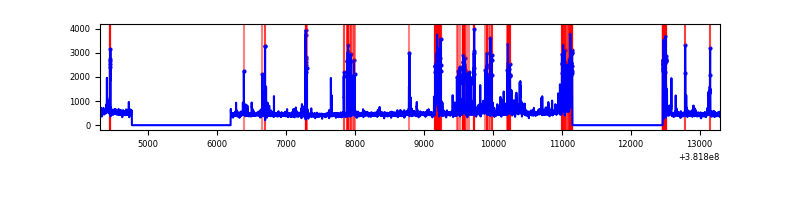 |
| C | 8997 | 6253 | 583 | 583 | 6.48% | 9.32% | 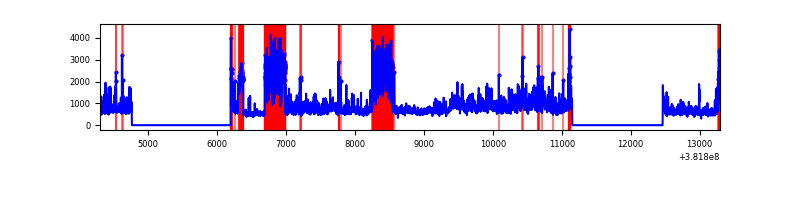 |
| D | 8997 | 6253 | 2058 | 2058 | 22.87% | 32.91% | 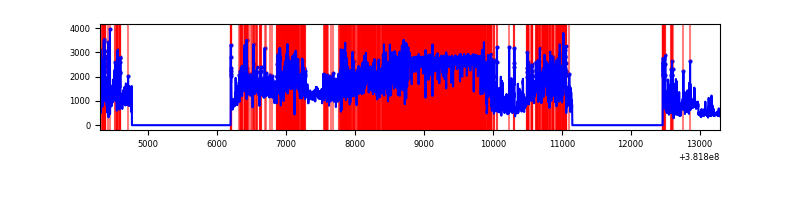 |
Top three noisy pixels from each quadrant. If the there are fewer than three noisy pixels in the level2.evt file, extra rows are filled as -1
| Pixel properties | Quadrant properties | ||||||
|---|---|---|---|---|---|---|---|
| Quadrant | DetID | PixID | Counts | Sigma | Mean | Median | Sigma |
| A | 10 | 83 | 33743 | 225.55 | 723 | 707 | 146.5 |
| A | 9 | 143 | 21161 | 139.65 | 723 | 707 | 146.5 |
| A | 13 | 6 | 13274 | 85.8 | 723 | 707 | 146.5 |
| B | 5 | 172 | 841450 | 6117.29 | 709 | 690 | 137.4 |
| B | 5 | 200 | 35808 | 255.52 | 709 | 690 | 137.4 |
| B | 0 | 190 | 24815 | 175.53 | 709 | 690 | 137.4 |
| C | 4 | 254 | 2820520 | 18017.52 | 670 | 675 | 156.5 |
| C | 15 | 214 | 250725 | 1597.71 | 670 | 675 | 156.5 |
| C | 14 | 67 | 227577 | 1449.8 | 670 | 675 | 156.5 |
| D | 7 | 223 | 3495573 | 24619.88 | 578 | 562 | 142.0 |
| D | 2 | 249 | 2744173 | 19326.8 | 578 | 562 | 142.0 |
| D | 8 | 195 | 1294642 | 9115.88 | 578 | 562 | 142.0 |
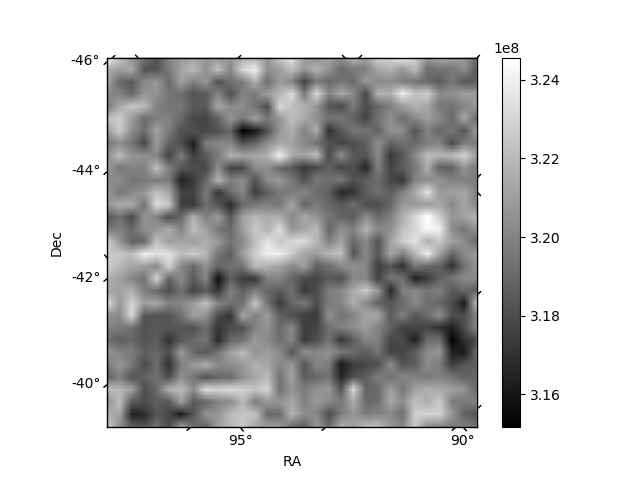
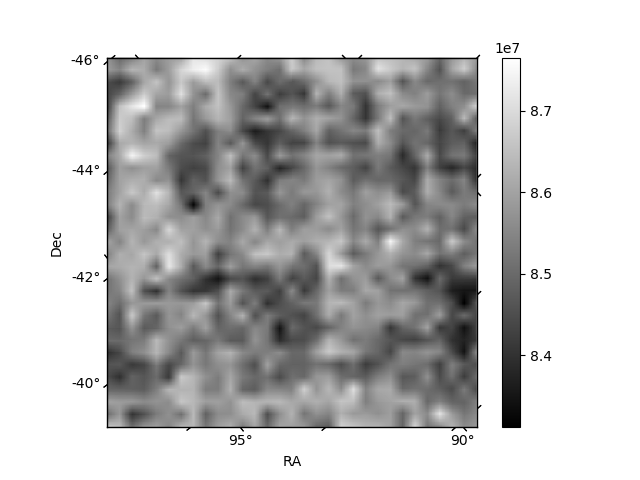
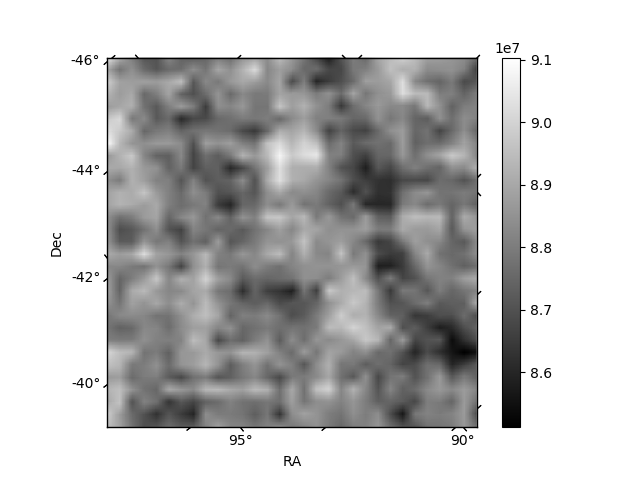
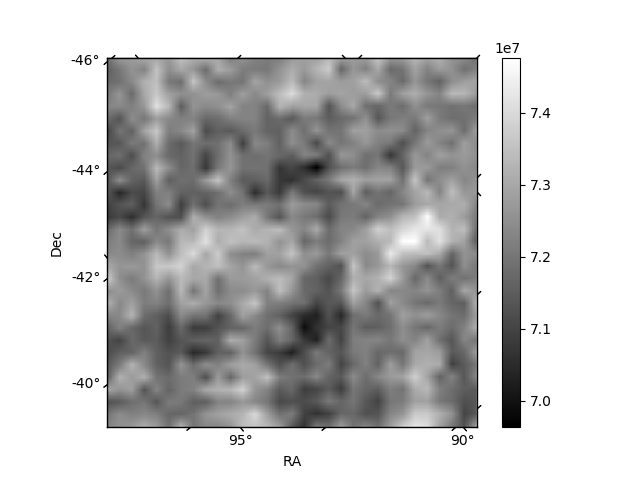
Histogram calculated using DETX and DETY for each event in the final _common_clean file
| Quadrant A | 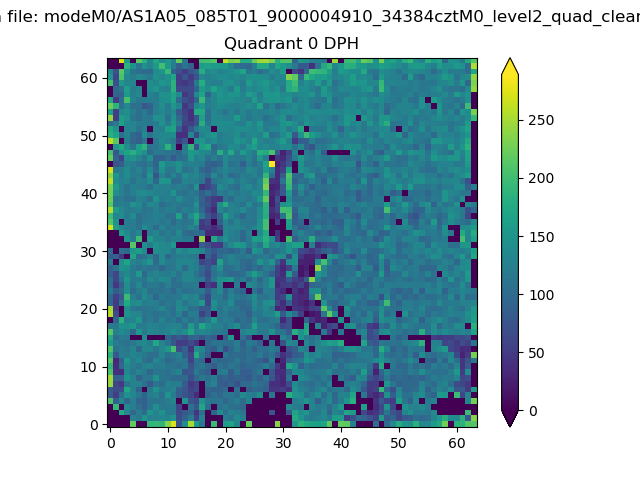 |
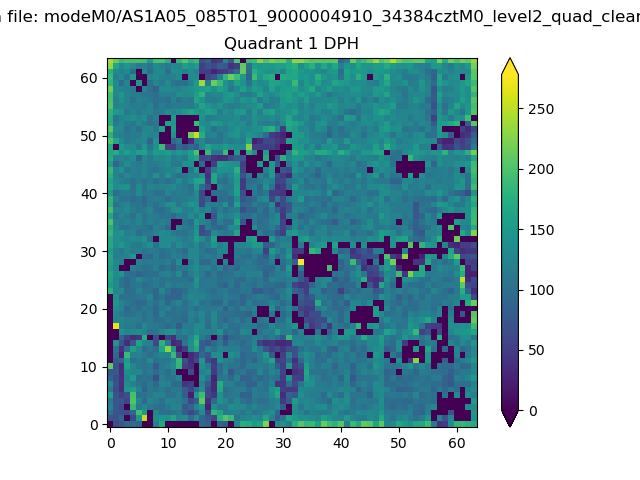 |
Quadrant B |
|---|---|---|---|
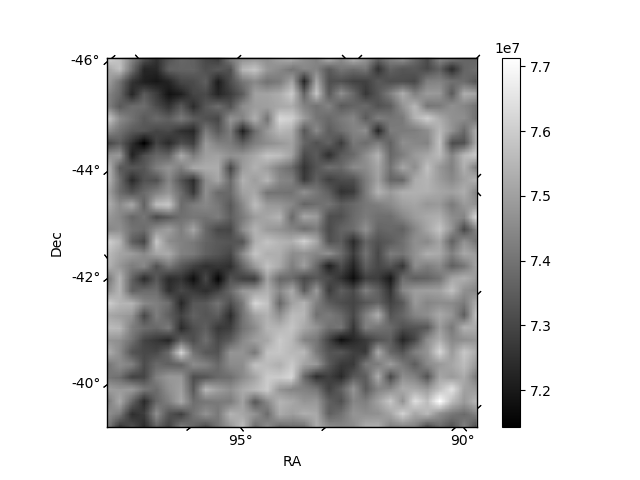
| Quadrant D | 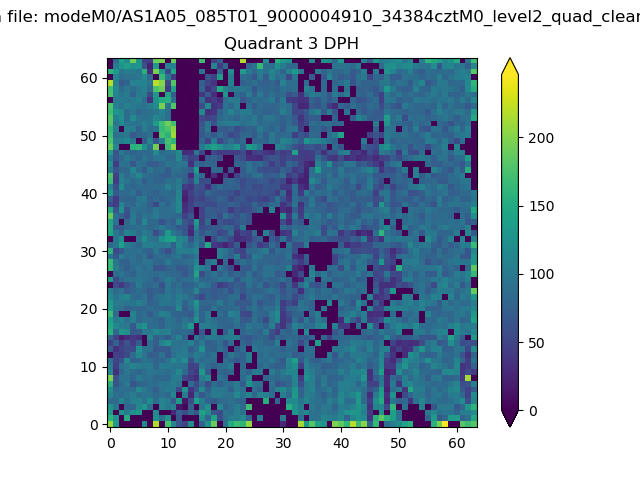 |
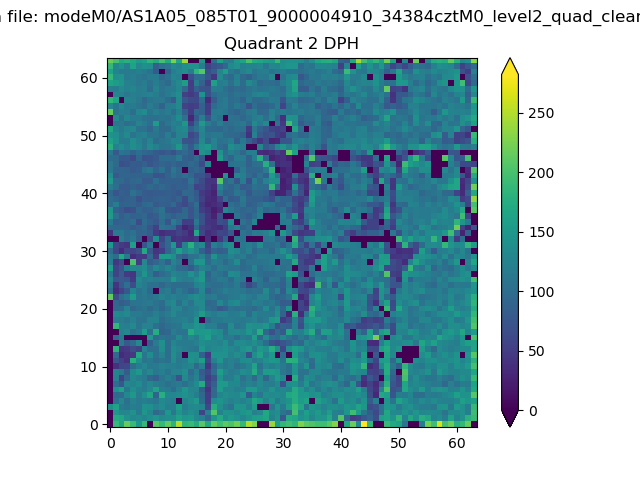 |
Quadrant C |
| Plot type | Count rate plots | Images |
|---|---|---|
| Comparison with Poisson distribution Blue bars denote a histogram of data divided into 1 sec bins. Red curve is a Poisson curve with rate = median count rate of data. |
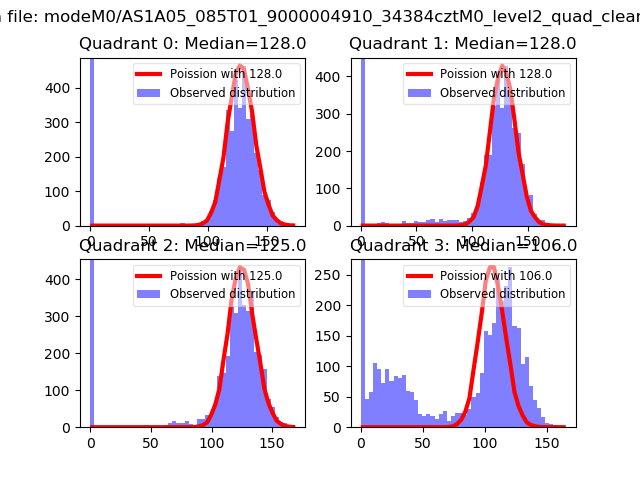 |
 |
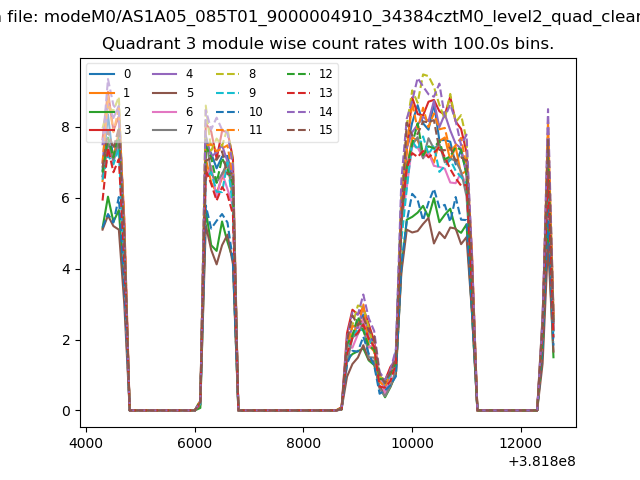
| Quadrant-wise count rates Data is divided into 100 sec bins |
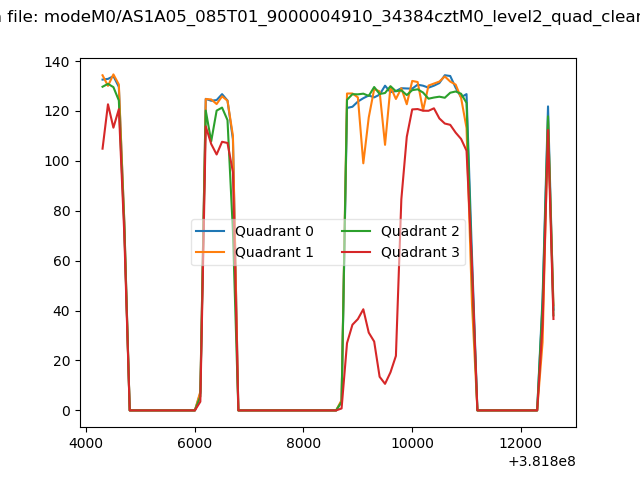 |
|
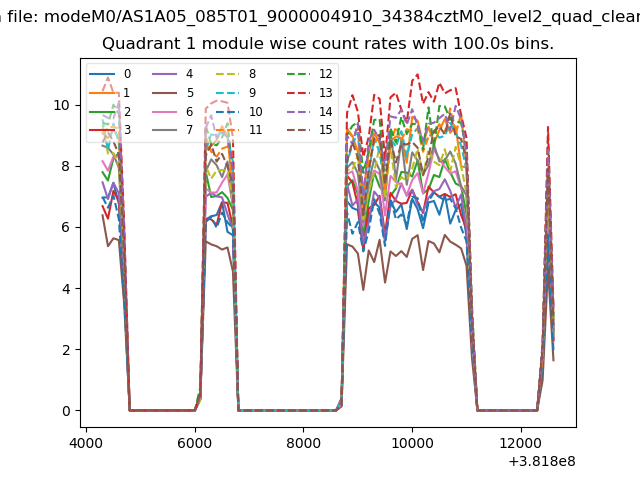
| Module-wise count rates for Quadrant A Data is divided into 100 sec bins |
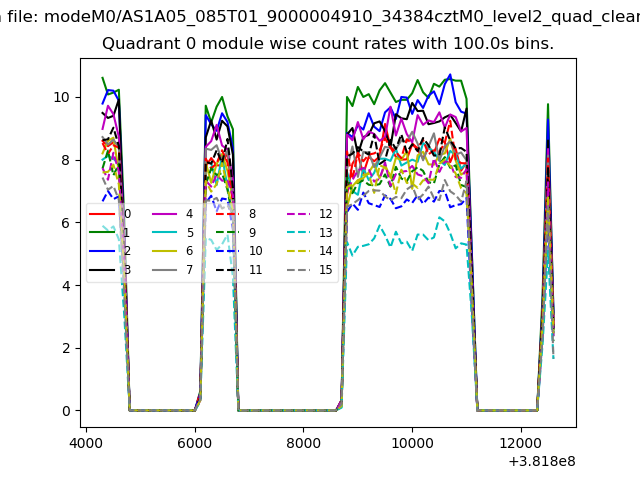 |
 |
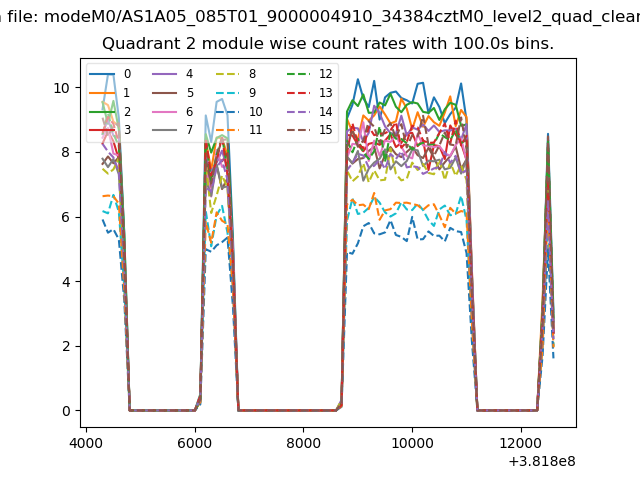
| Module-wise count rates for Quadrant B Data is divided into 100 sec bins |
 |
 |
| Module-wise count rates for Quadrant C Data is divided into 100 sec bins |
 |
 |
| Module-wise count rates for Quadrant D Data is divided into 100 sec bins |
 |
 |
| Parameter | Plot |
|---|---|
| CZT HV Monitor | 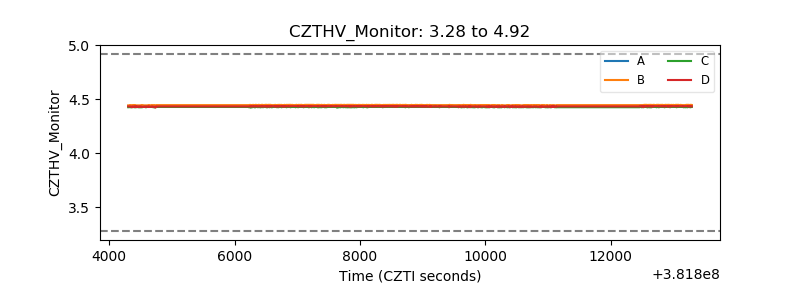 |
| D_VDD | 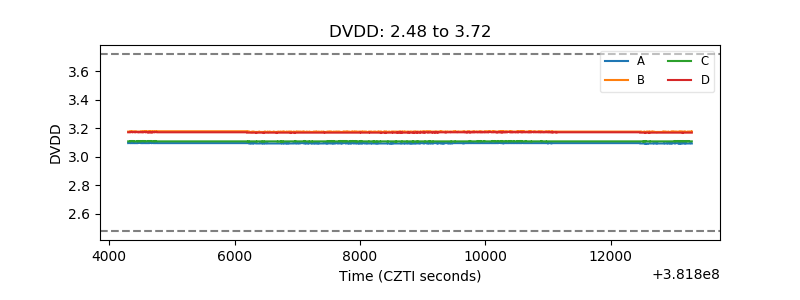 |
| Temperature 1 | 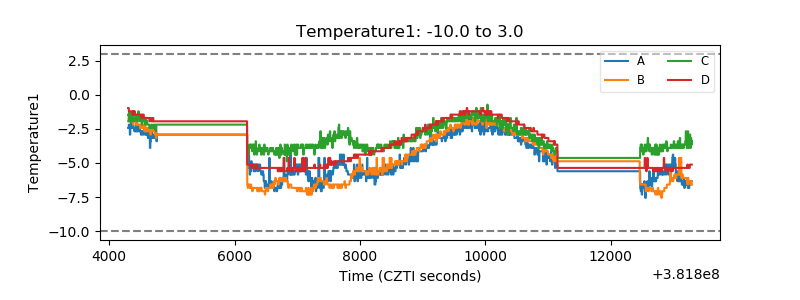 |
| Veto HV Monitor | 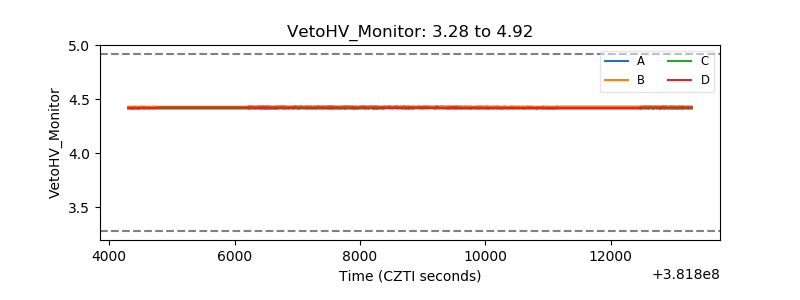 |
| Veto LLD | 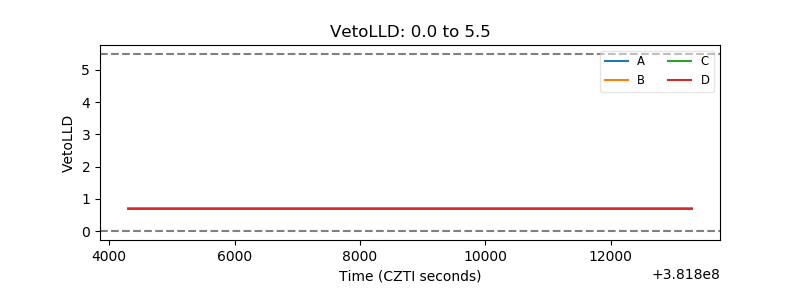 |
| Alpha Counter | 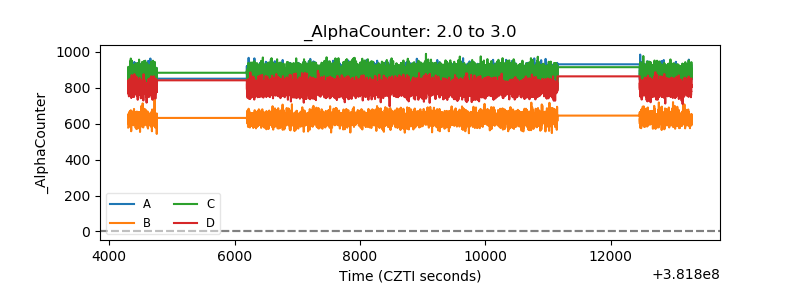 |
| _CPM_Rate | 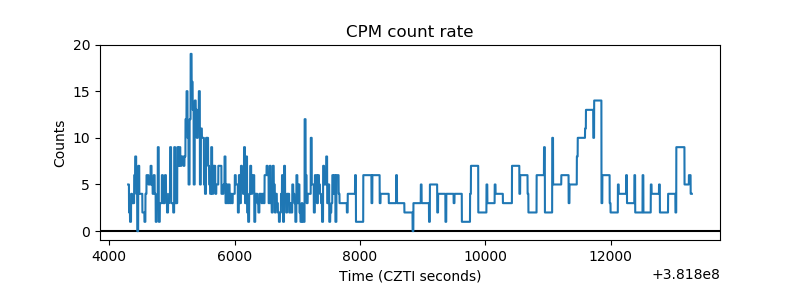 |
| CZT Counter | 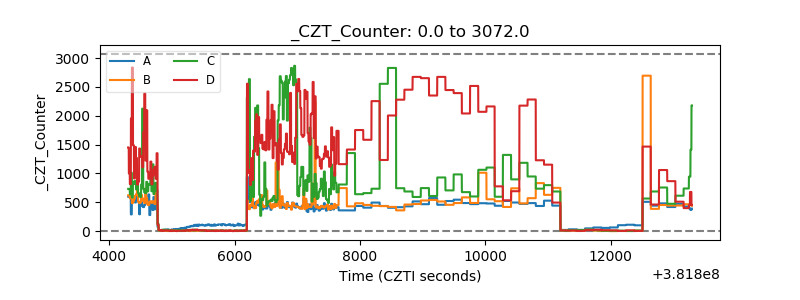 |
| +2.5 Volts monitor | 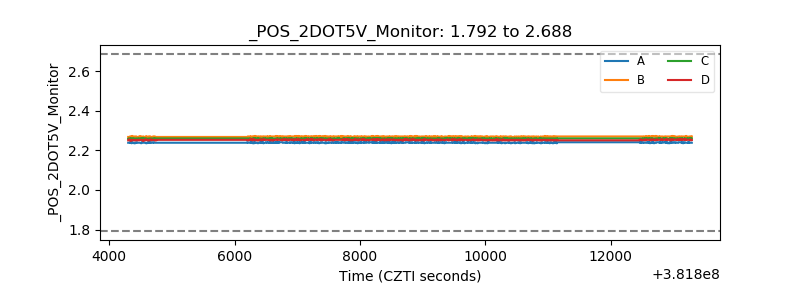 |
| +5 Volts monitor | 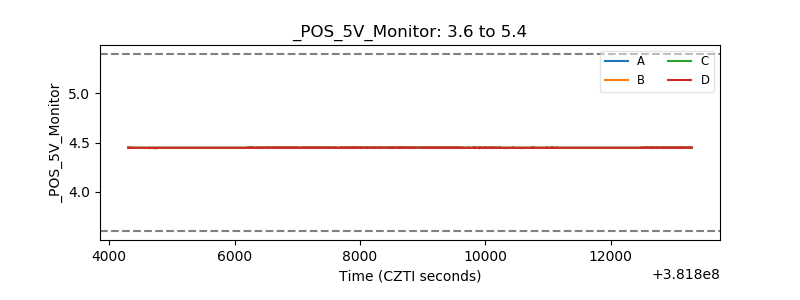 |
| _ROLL_ROT | 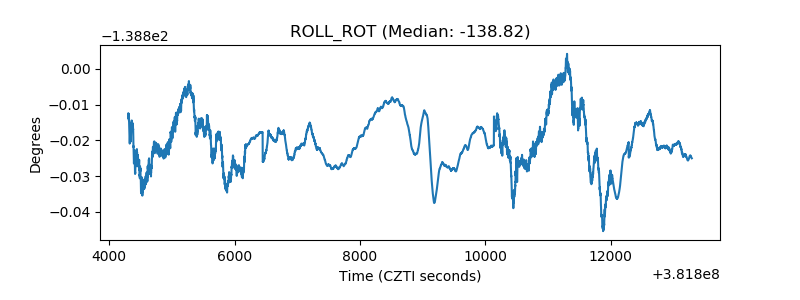 |
| _Roll_DEC | 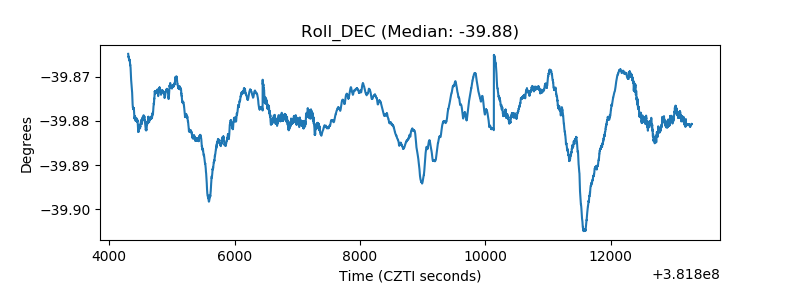 |
| _Roll_RA | 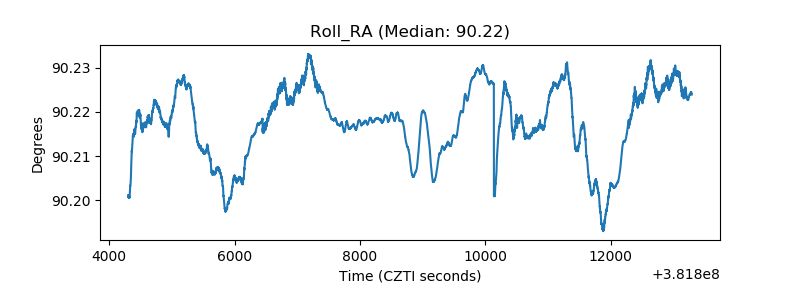 |
| Veto Counter | 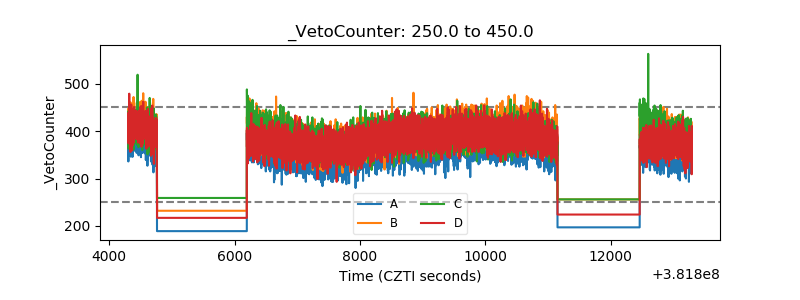 |