| Param | Original file | Final file |
|---|---|---|
| Filename | modeM0/AS1A05_085T01_9000004910_34380cztM0_level2.evt | modeM0/AS1A05_085T01_9000004910_34380cztM0_level2_quad_clean.evt |
| Size (bytes) | 517,080,960 | 60,891,840 |
| Size | 493.1 MB | 58.1 MB |
| Events in quadrant A | 2,328,659 | 423,374 |
| Events in quadrant B | 3,946,709 | 388,476 |
| Events in quadrant C | 3,012,176 | 412,278 |
| Events in quadrant D | 6,044,309 | 279,181 |
| Mode SS | |||
|---|---|---|---|
| Quadrant | BADHDUFLAG | Total packets | Discarded packets |
| A | 0 | 100 | 0 |
| B | 0 | 100 | 0 |
| C | 0 | 100 | 0 |
| D | 0 | 100 | 0 |
| Mode M9 | |||
|---|---|---|---|
| Quadrant | BADHDUFLAG | Total packets | Discarded packets |
| A | 0 | 31 | 0 |
| B | 0 | 31 | 0 |
| C | 0 | 31 | 0 |
| D | 0 | 32 | 0 |
| Mode M0 | |||
|---|---|---|---|
| Quadrant | BADHDUFLAG | Total packets | Discarded packets |
| A | 0 | 10011 | 3 |
| B | 0 | 14876 | 2 |
| C | 0 | 12095 | 2 |
| D | 0 | 21286 | 2 |
| Quadrant | Total seconds | Saturated seconds | Saturation percentage |
|---|---|---|---|
| A | 4833 | 11 | 0.227602% |
| B | 4833 | 574 | 11.876681% |
| C | 4833 | 43 | 0.889717% |
| D | 4833 | 1332 | 27.560521% |
Noise dominated data is calculated using 1-second bins in cleaned event files. If a bin has >2000 counts, and if more than 50% of those come from <1% of pixels, then it is considered to be noise-dominated and hence unusable.
| Quadrant | # 1 sec bins | Bins with >0 counts | Bins with >2000 counts | High rate bins dominated by noise | Noise dominated (total time) | Noise dominated (detector-on time) | Marked lightcurve |
|---|---|---|---|---|---|---|---|
| A | 6956 | 4834 | 6 | 6 | 0.09% | 0.12% | 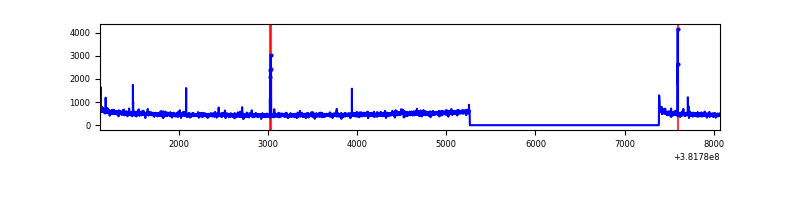 |
| B | 6956 | 4834 | 445 | 445 | 6.40% | 9.21% | 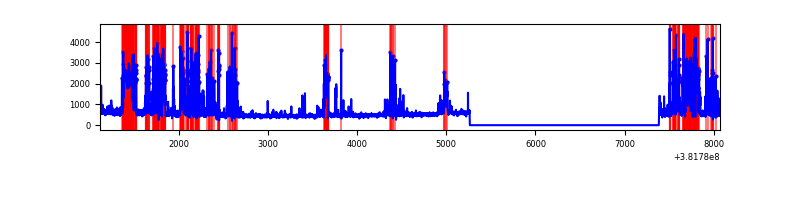 |
| C | 6956 | 4834 | 28 | 28 | 0.40% | 0.58% | 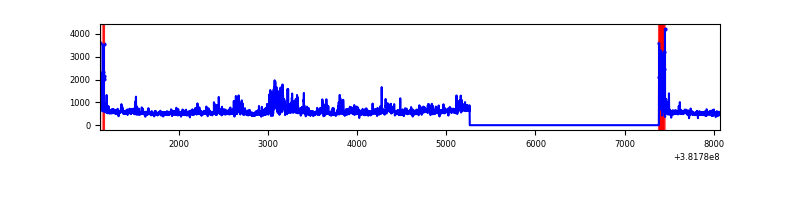 |
| D | 6955 | 4833 | 1289 | 1289 | 18.53% | 26.67% | 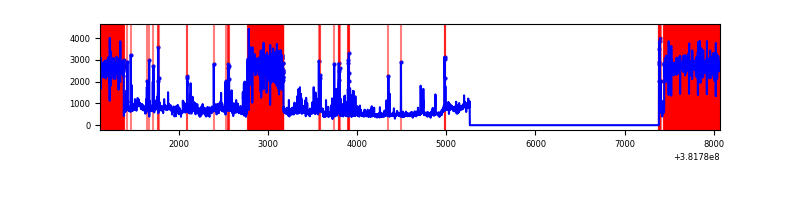 |
Top three noisy pixels from each quadrant. If the there are fewer than three noisy pixels in the level2.evt file, extra rows are filled as -1
| Pixel properties | Quadrant properties | ||||||
|---|---|---|---|---|---|---|---|
| Quadrant | DetID | PixID | Counts | Sigma | Mean | Median | Sigma |
| A | 9 | 143 | 37134 | 313.78 | 580 | 570 | 116.5 |
| A | 10 | 83 | 33646 | 283.85 | 580 | 570 | 116.5 |
| A | 13 | 254 | 9416 | 75.91 | 580 | 570 | 116.5 |
| B | 5 | 172 | 1489268 | 14251.55 | 550 | 537 | 104.5 |
| B | 5 | 255 | 194777 | 1859.45 | 550 | 537 | 104.5 |
| B | 4 | 251 | 76068 | 723.05 | 550 | 537 | 104.5 |
| C | 4 | 254 | 406125 | 3135.33 | 561 | 566 | 129.4 |
| C | 15 | 214 | 205041 | 1580.77 | 561 | 566 | 129.4 |
| C | 0 | 10 | 119023 | 915.78 | 561 | 566 | 129.4 |
| D | 7 | 223 | 3018853 | 25755.0 | 476 | 463 | 117.2 |
| D | 8 | 195 | 560558 | 4779.12 | 476 | 463 | 117.2 |
| D | 2 | 249 | 198766 | 1692.06 | 476 | 463 | 117.2 |
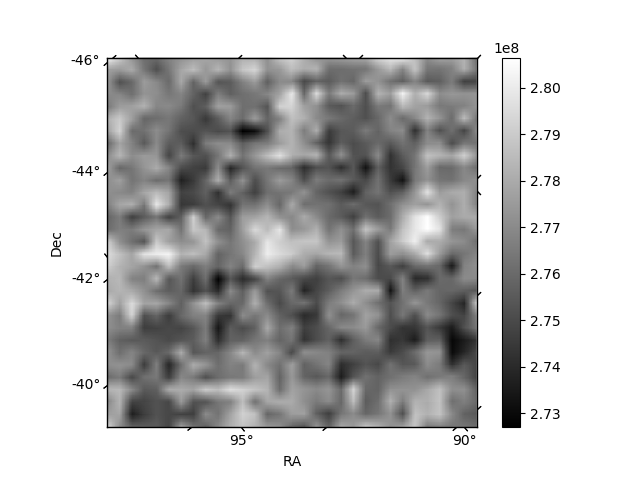
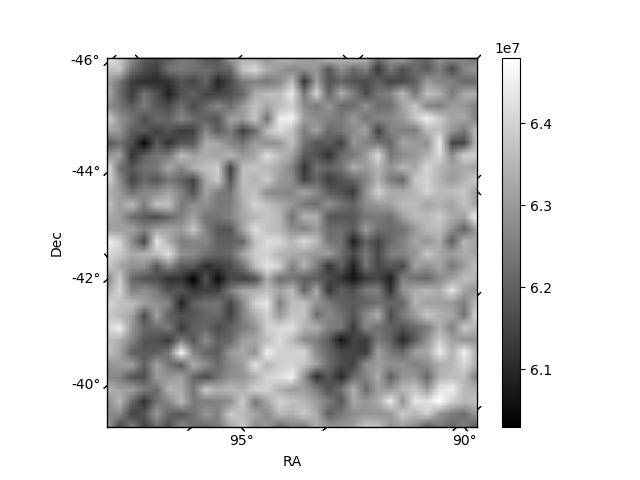
Histogram calculated using DETX and DETY for each event in the final _common_clean file
| Quadrant A | 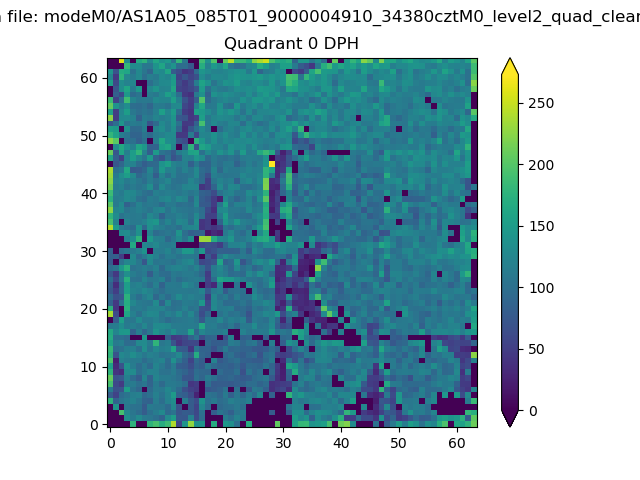 |
 |
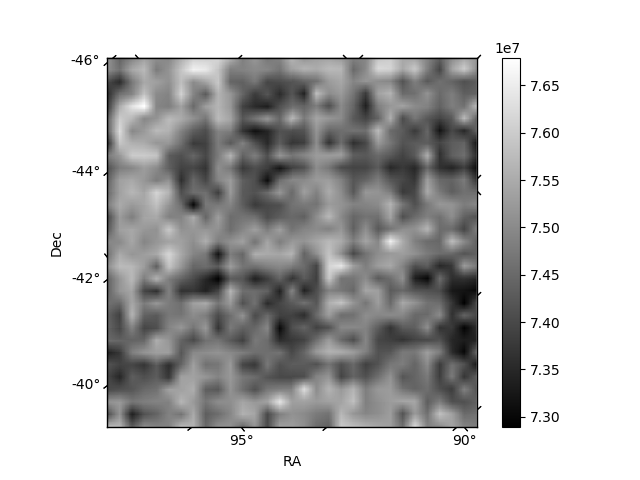
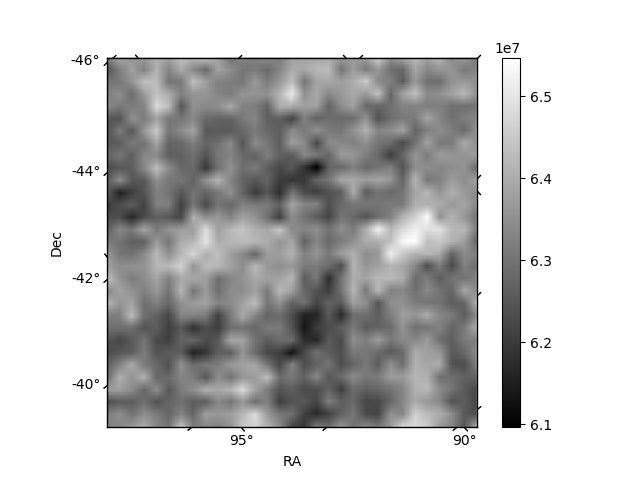
Quadrant B |
|---|---|---|---|
| Quadrant D | 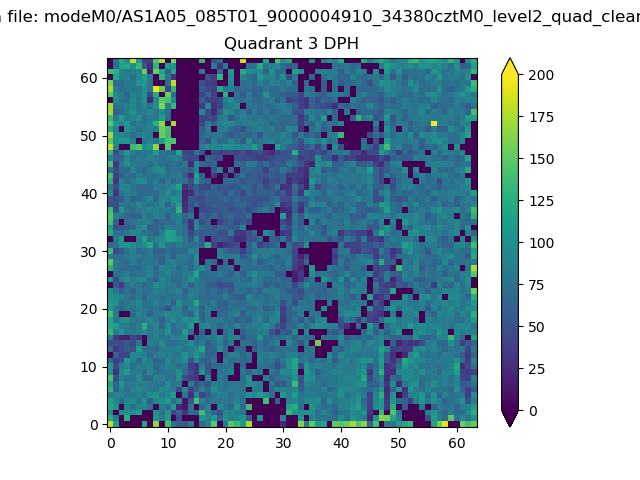 |
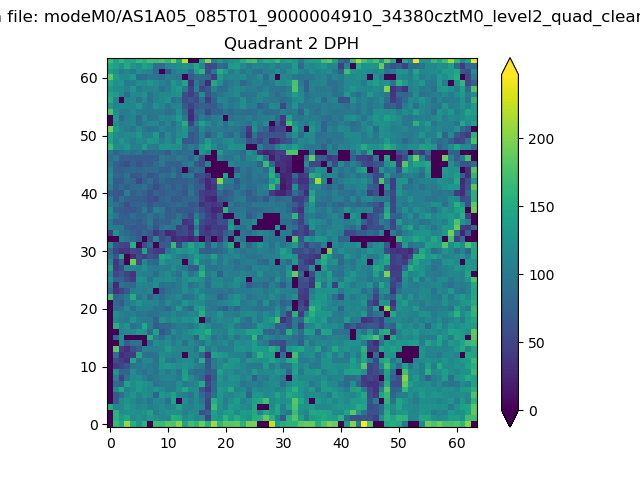 |
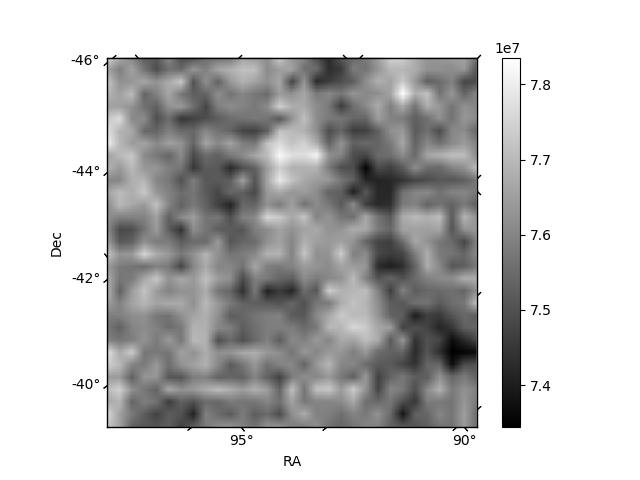
Quadrant C |
| Plot type | Count rate plots | Images |
|---|---|---|
| Comparison with Poisson distribution Blue bars denote a histogram of data divided into 1 sec bins. Red curve is a Poisson curve with rate = median count rate of data. |
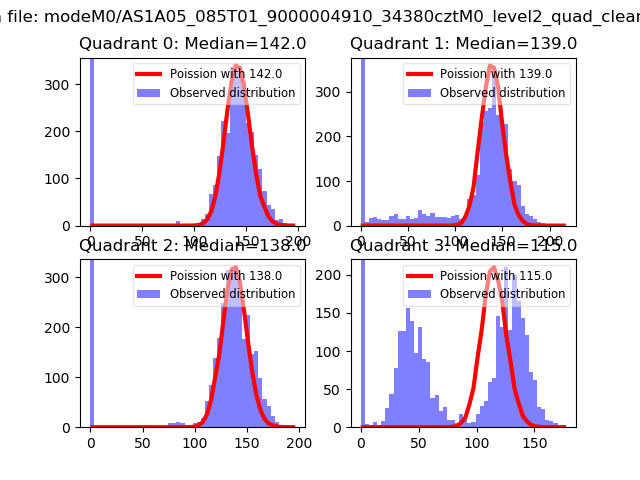 |
 |
| Quadrant-wise count rates Data is divided into 100 sec bins |
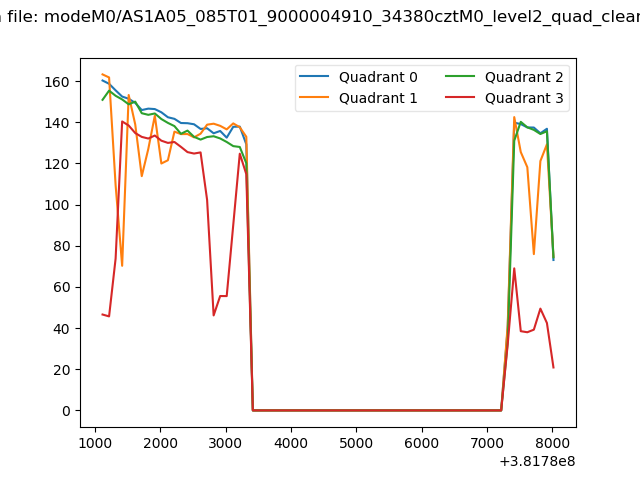 |
|
| Module-wise count rates for Quadrant A Data is divided into 100 sec bins |
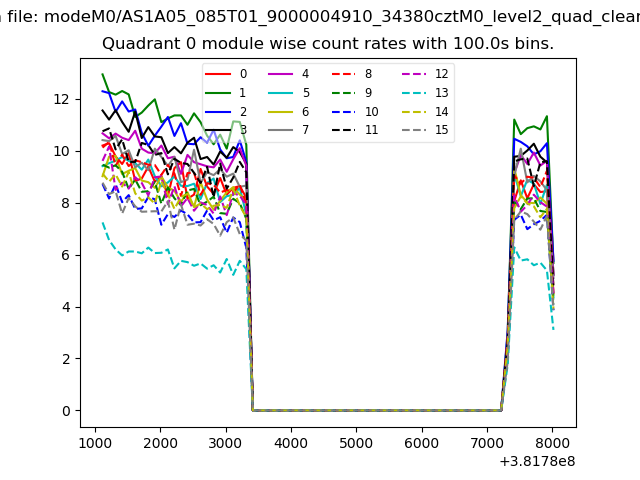 |
 |
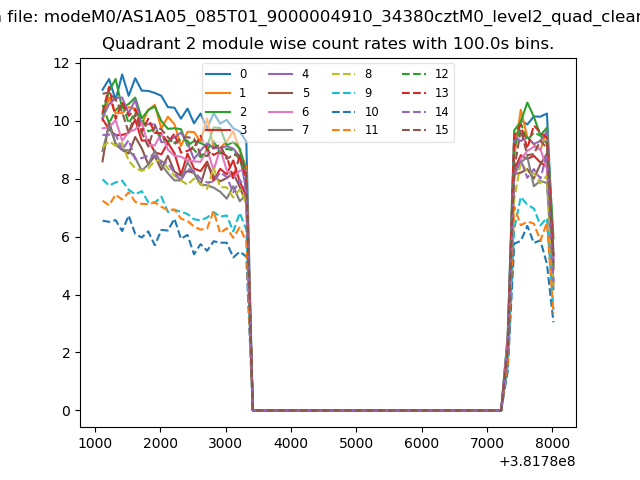
| Module-wise count rates for Quadrant B Data is divided into 100 sec bins |
 |
 |
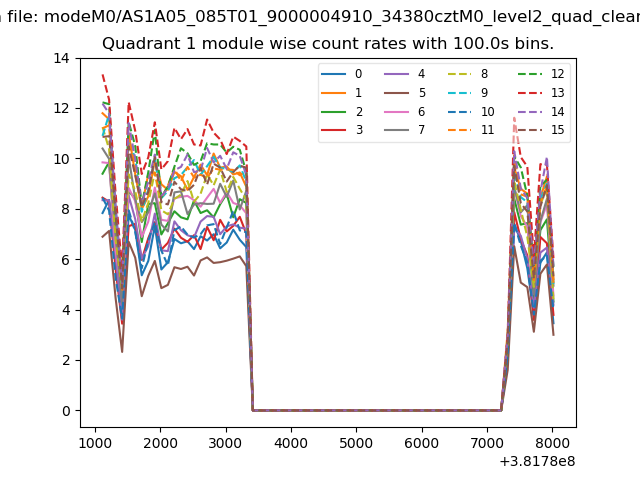
| Module-wise count rates for Quadrant C Data is divided into 100 sec bins |
 |
 |
| Module-wise count rates for Quadrant D Data is divided into 100 sec bins |
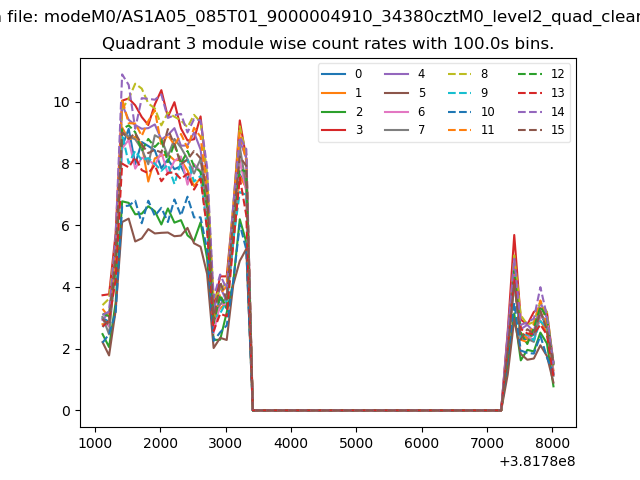 |
 |
| Parameter | Plot |
|---|---|
| CZT HV Monitor | 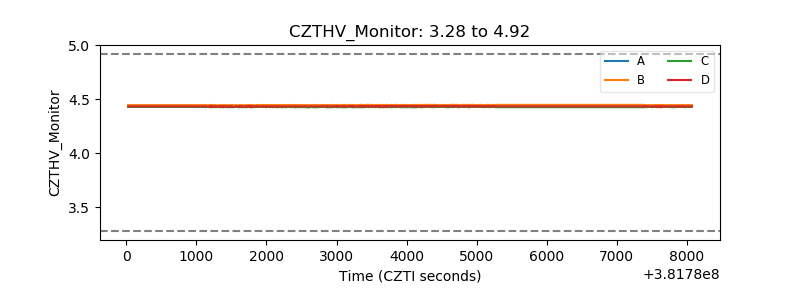 |
| D_VDD | 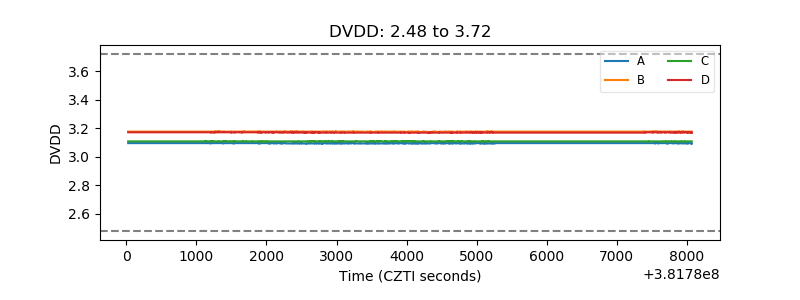 |
| Temperature 1 | 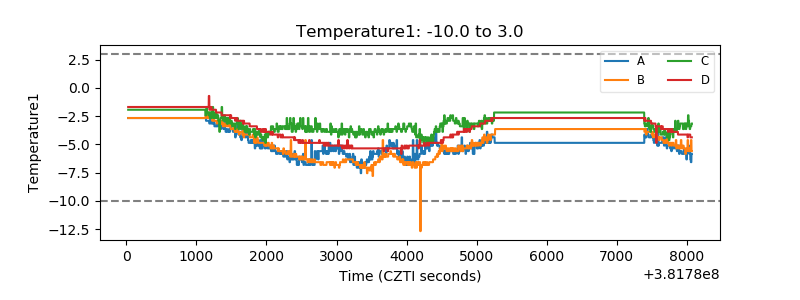 |
| Veto HV Monitor | 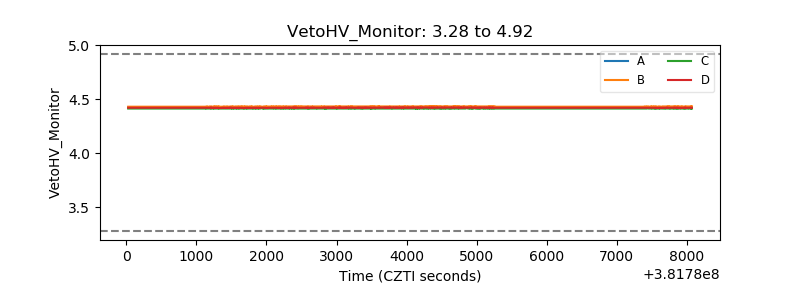 |
| Veto LLD | 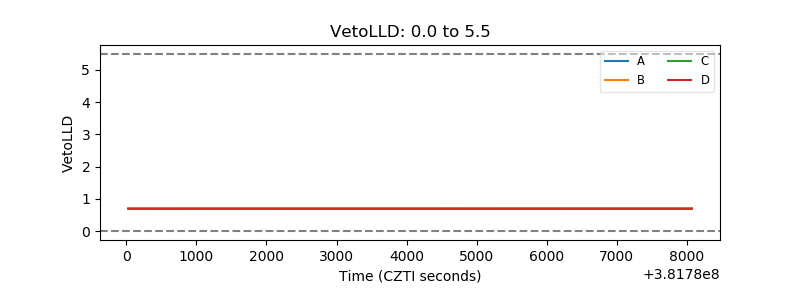 |
| Alpha Counter | 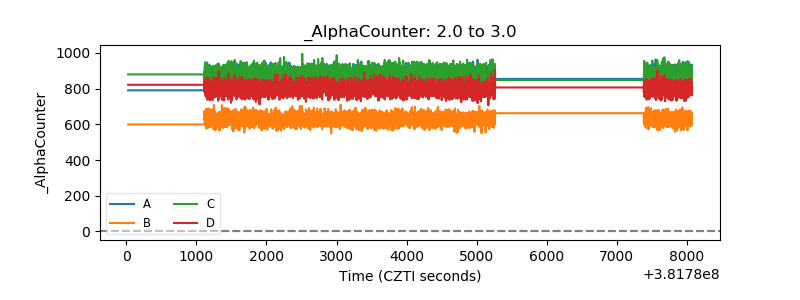 |
| _CPM_Rate | 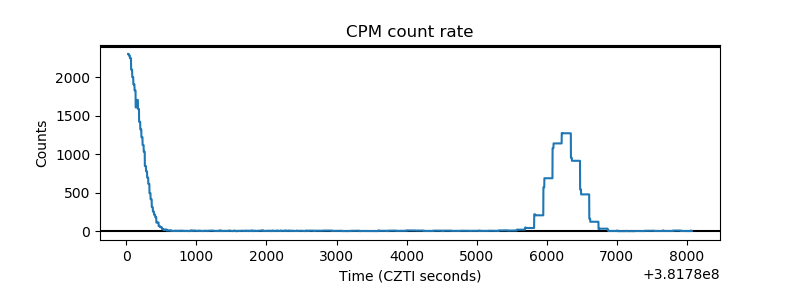 |
| CZT Counter | 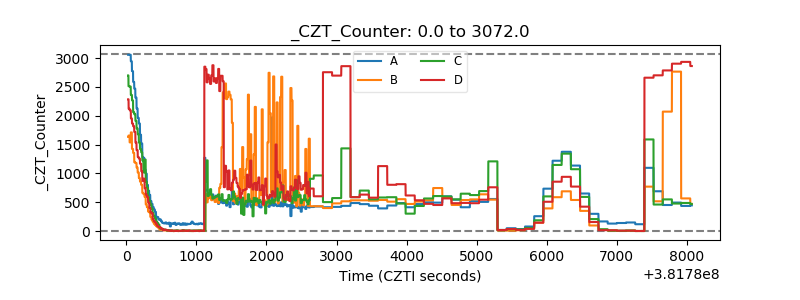 |
| +2.5 Volts monitor | 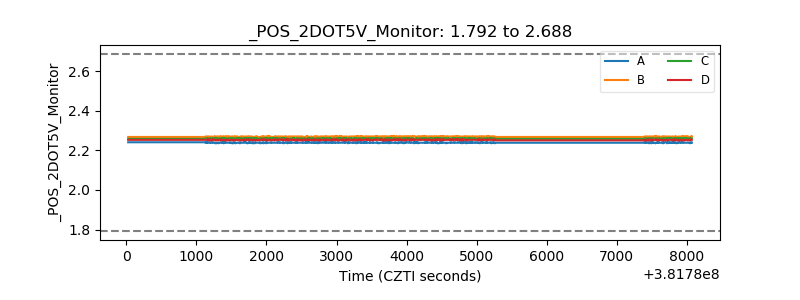 |
| +5 Volts monitor | 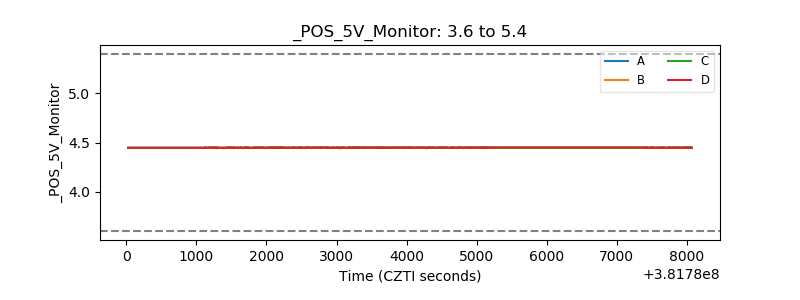 |
| _ROLL_ROT | 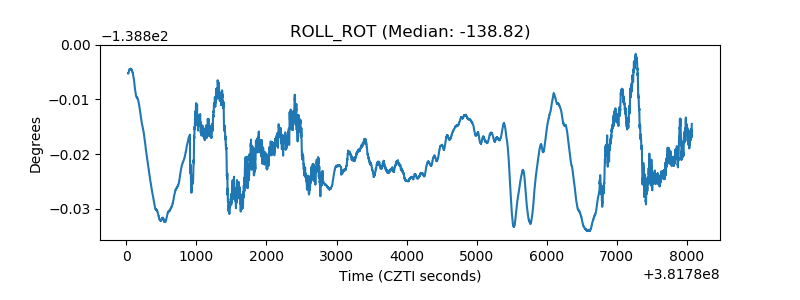 |
| _Roll_DEC | 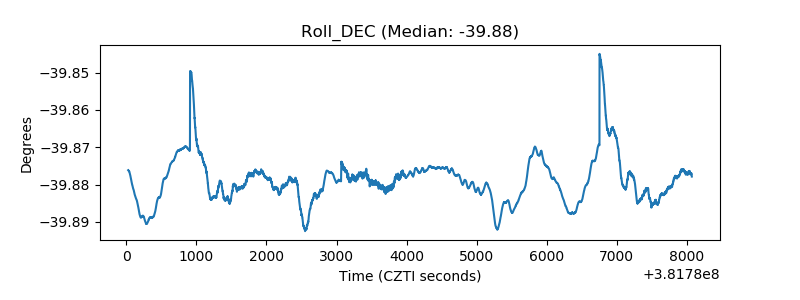 |
| _Roll_RA | 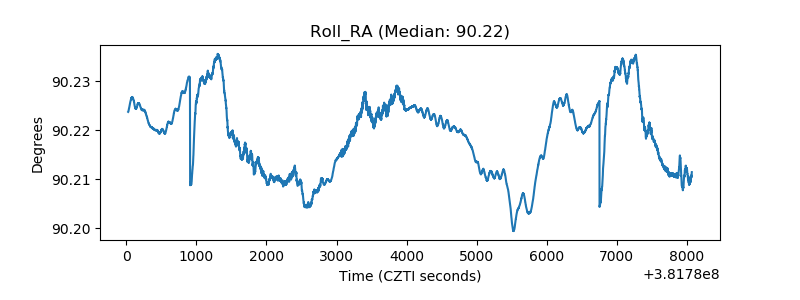 |
| Veto Counter | 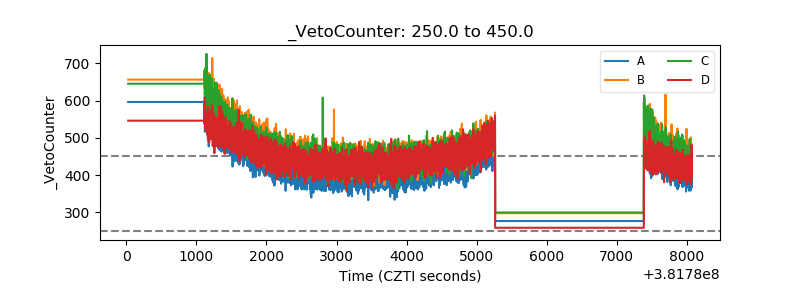 |