| Param | Original file | Final file |
|---|---|---|
| Filename | modeM0/AS1A05_085T01_9000004910_34379cztM0_level2.evt | modeM0/AS1A05_085T01_9000004910_34379cztM0_level2_quad_clean.evt |
| Size (bytes) | 572,235,840 | 78,428,160 |
| Size | 545.7 MB | 74.8 MB |
| Events in quadrant A | 2,525,872 | 551,351 |
| Events in quadrant B | 4,339,782 | 499,338 |
| Events in quadrant C | 4,654,034 | 520,667 |
| Events in quadrant D | 5,465,538 | 445,491 |
| Mode SS | |||
|---|---|---|---|
| Quadrant | BADHDUFLAG | Total packets | Discarded packets |
| A | 0 | 106 | 0 |
| B | 0 | 106 | 0 |
| C | 0 | 106 | 0 |
| D | 0 | 106 | 0 |
| Mode M9 | |||
|---|---|---|---|
| Quadrant | BADHDUFLAG | Total packets | Discarded packets |
| A | 0 | 21 | 0 |
| B | 0 | 21 | 0 |
| C | 0 | 21 | 0 |
| D | 0 | 21 | 0 |
| Mode M0 | |||
|---|---|---|---|
| Quadrant | BADHDUFLAG | Total packets | Discarded packets |
| A | 0 | 10608 | 3 |
| B | 0 | 16192 | 2 |
| C | 0 | 17438 | 2 |
| D | 0 | 19904 | 2 |
| Quadrant | Total seconds | Saturated seconds | Saturation percentage |
|---|---|---|---|
| A | 5095 | 10 | 0.196271% |
| B | 5095 | 680 | 13.346418% |
| C | 5095 | 169 | 3.316977% |
| D | 5095 | 758 | 14.877331% |
Noise dominated data is calculated using 1-second bins in cleaned event files. If a bin has >2000 counts, and if more than 50% of those come from <1% of pixels, then it is considered to be noise-dominated and hence unusable.
| Quadrant | # 1 sec bins | Bins with >0 counts | Bins with >2000 counts | High rate bins dominated by noise | Noise dominated (total time) | Noise dominated (detector-on time) | Marked lightcurve |
|---|---|---|---|---|---|---|---|
| A | 7217 | 5096 | 7 | 7 | 0.10% | 0.14% | 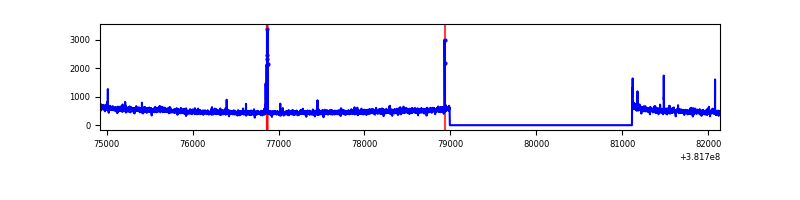 |
| B | 7217 | 5096 | 530 | 530 | 7.34% | 10.40% | 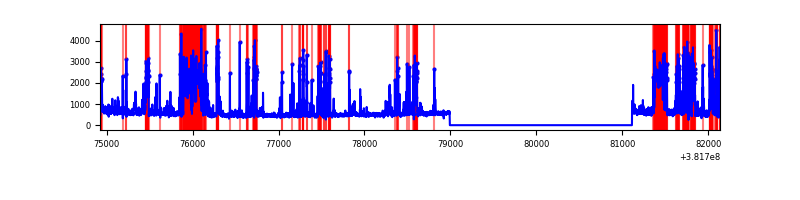 |
| C | 7217 | 5096 | 169 | 169 | 2.34% | 3.32% | 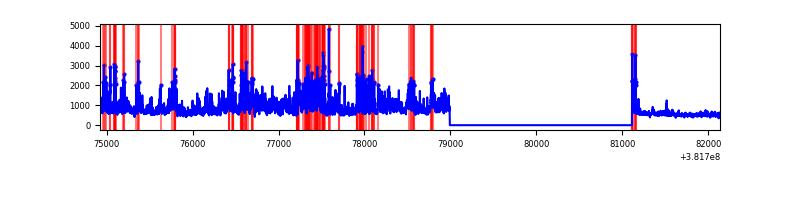 |
| D | 7217 | 5096 | 702 | 702 | 9.73% | 13.78% | 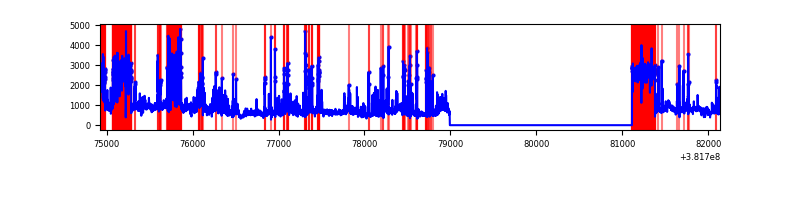 |
Top three noisy pixels from each quadrant. If the there are fewer than three noisy pixels in the level2.evt file, extra rows are filled as -1
| Pixel properties | Quadrant properties | ||||||
|---|---|---|---|---|---|---|---|
| Quadrant | DetID | PixID | Counts | Sigma | Mean | Median | Sigma |
| A | 9 | 143 | 40140 | 313.31 | 631 | 622 | 126.1 |
| A | 10 | 83 | 25095 | 194.03 | 631 | 622 | 126.1 |
| A | 13 | 6 | 21748 | 167.49 | 631 | 622 | 126.1 |
| B | 5 | 172 | 1679967 | 15283.25 | 589 | 577 | 109.9 |
| B | 5 | 255 | 173835 | 1576.73 | 589 | 577 | 109.9 |
| B | 4 | 251 | 102021 | 923.19 | 589 | 577 | 109.9 |
| C | 4 | 254 | 2010535 | 14541.81 | 597 | 602 | 138.2 |
| C | 15 | 214 | 213430 | 1539.8 | 597 | 602 | 138.2 |
| C | 14 | 67 | 52872 | 378.17 | 597 | 602 | 138.2 |
| D | 7 | 223 | 1178581 | 8729.87 | 555 | 541 | 134.9 |
| D | 8 | 195 | 942087 | 6977.33 | 555 | 541 | 134.9 |
| D | 3 | 13 | 322188 | 2383.57 | 555 | 541 | 134.9 |
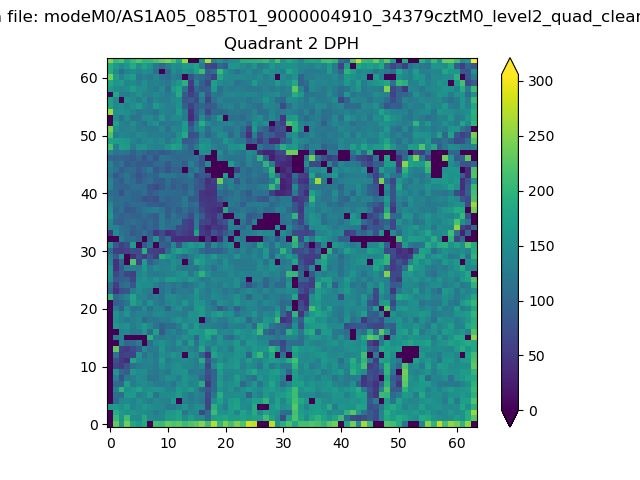
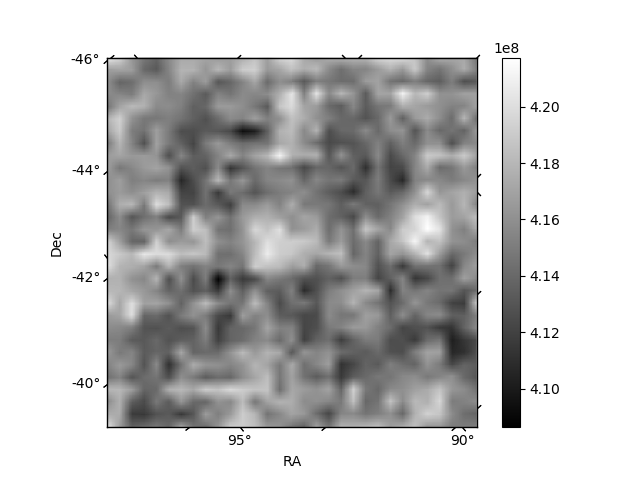
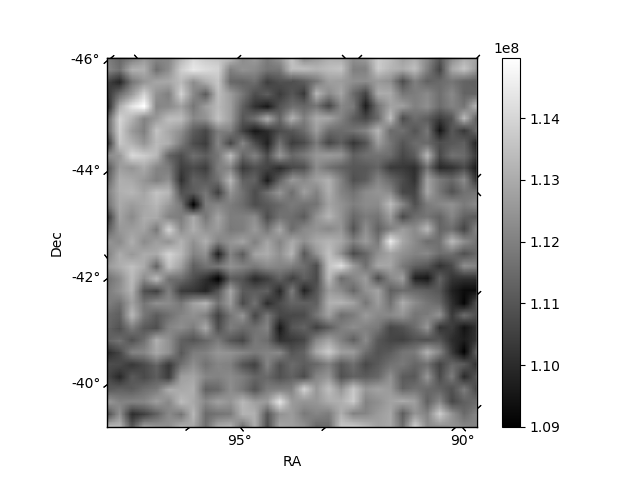
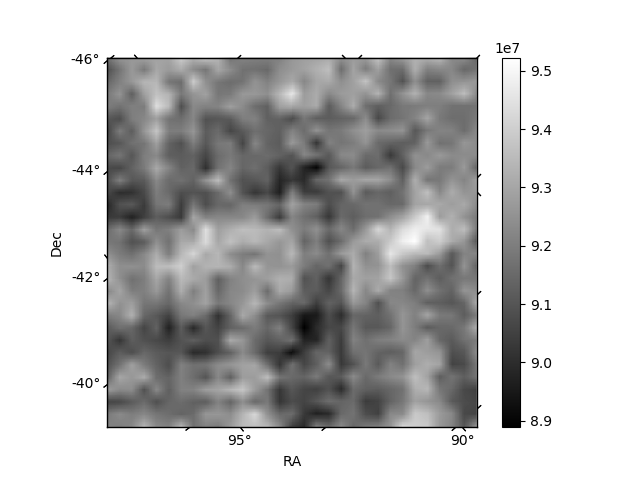
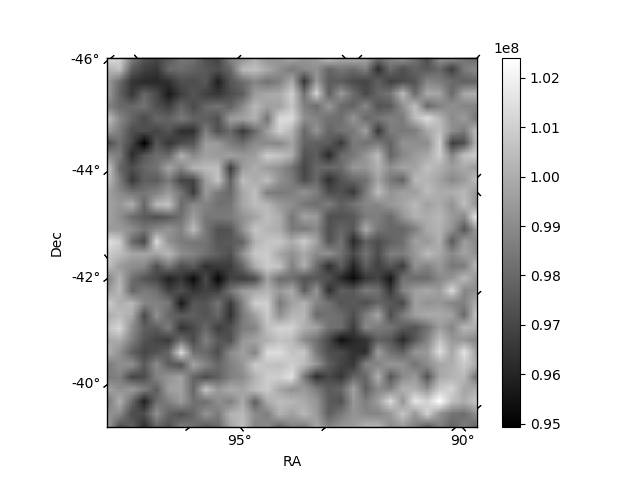
Histogram calculated using DETX and DETY for each event in the final _common_clean file
| Quadrant A | 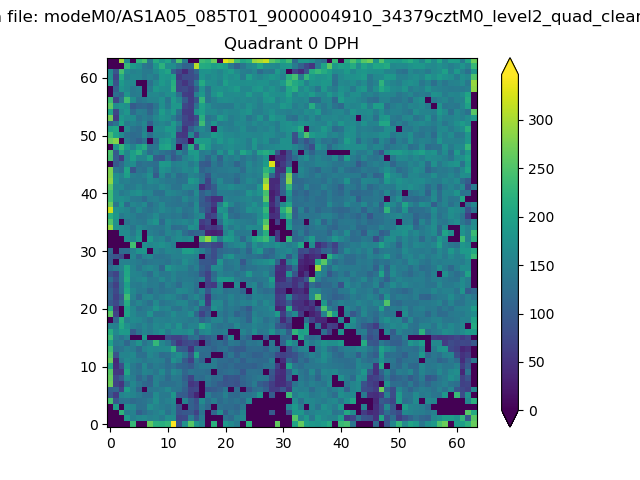 |
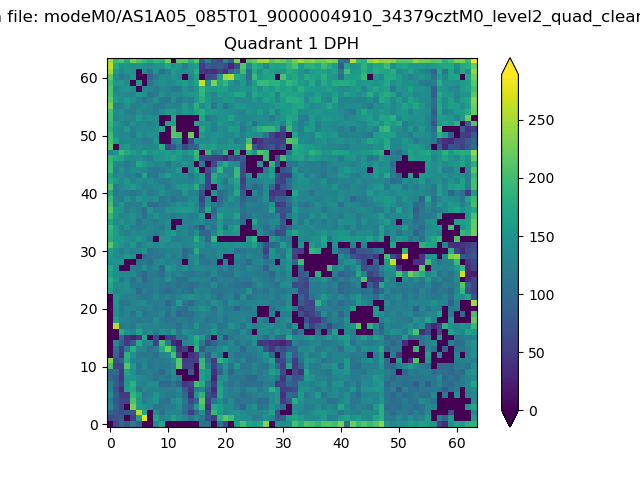 |
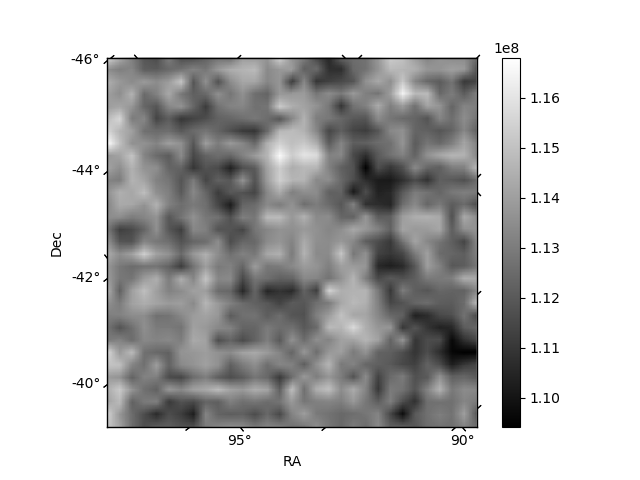
Quadrant B |
|---|---|---|---|
| Quadrant D | 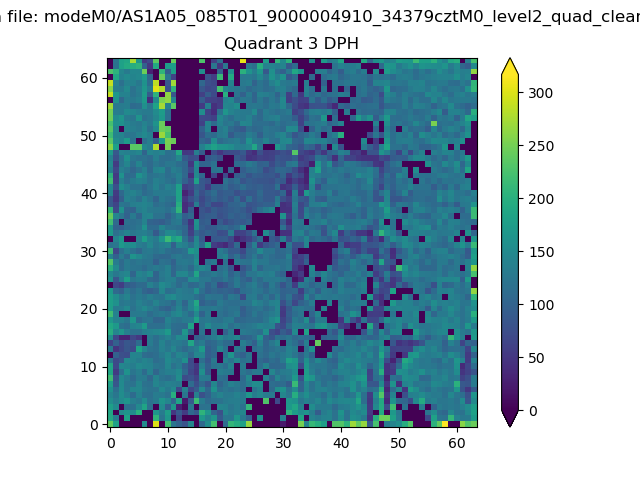 |
 |
Quadrant C |
| Plot type | Count rate plots | Images |
|---|---|---|
| Comparison with Poisson distribution Blue bars denote a histogram of data divided into 1 sec bins. Red curve is a Poisson curve with rate = median count rate of data. |
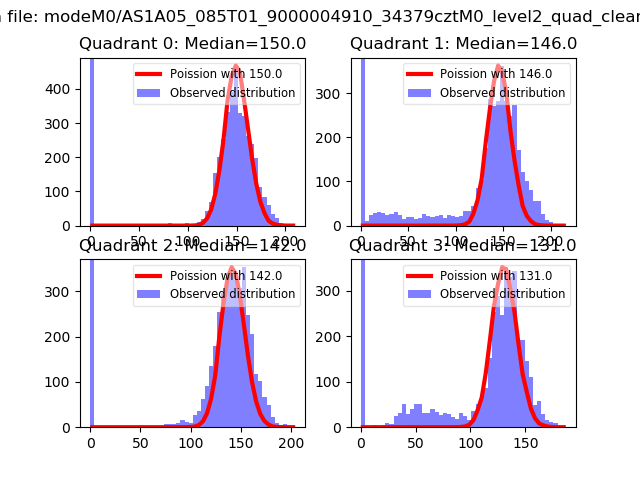 |
 |
| Quadrant-wise count rates Data is divided into 100 sec bins |
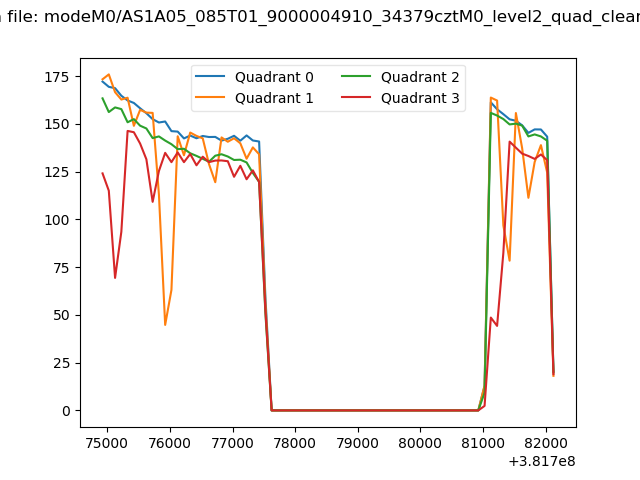 |
|
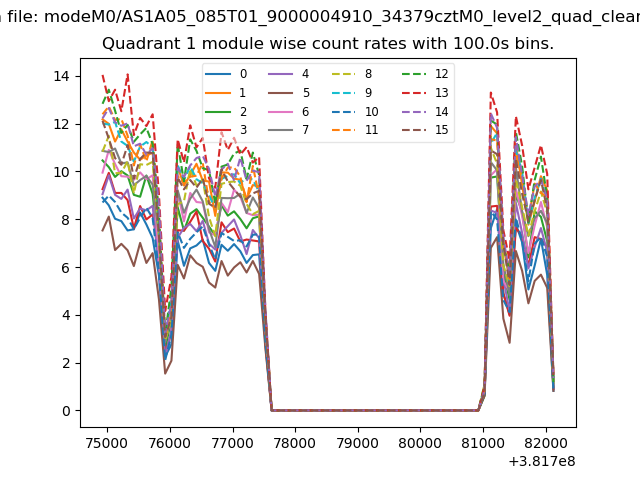
| Module-wise count rates for Quadrant A Data is divided into 100 sec bins |
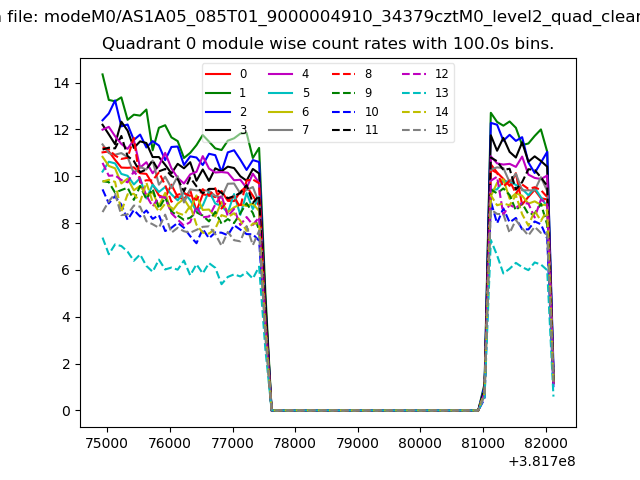 |
 |
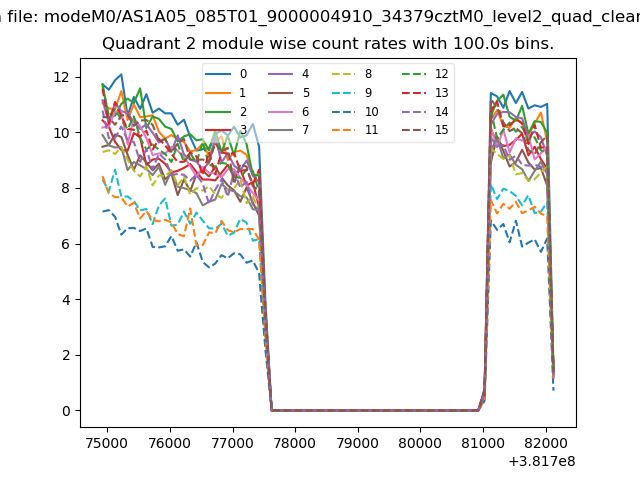
| Module-wise count rates for Quadrant B Data is divided into 100 sec bins |
 |
 |
| Module-wise count rates for Quadrant C Data is divided into 100 sec bins |
 |
 |
| Module-wise count rates for Quadrant D Data is divided into 100 sec bins |
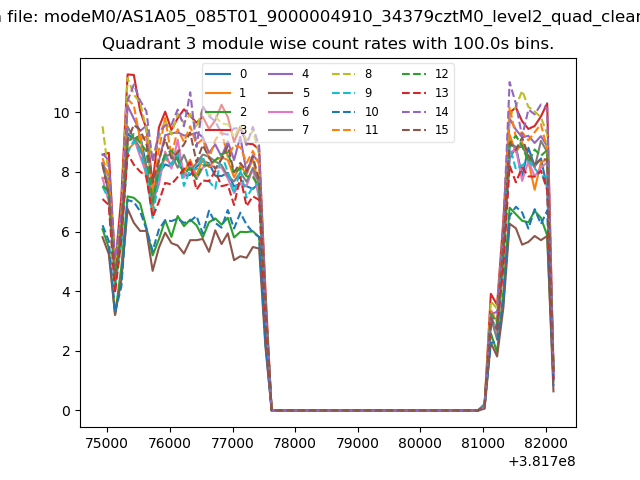 |
 |
| Parameter | Plot |
|---|---|
| CZT HV Monitor | 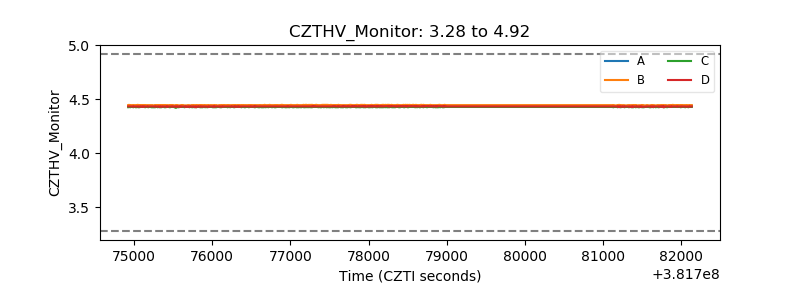 |
| D_VDD | 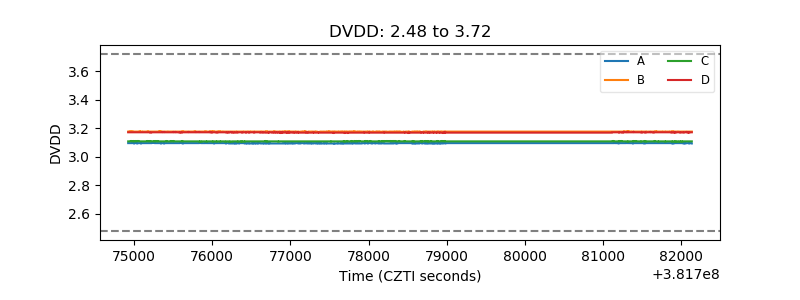 |
| Temperature 1 | 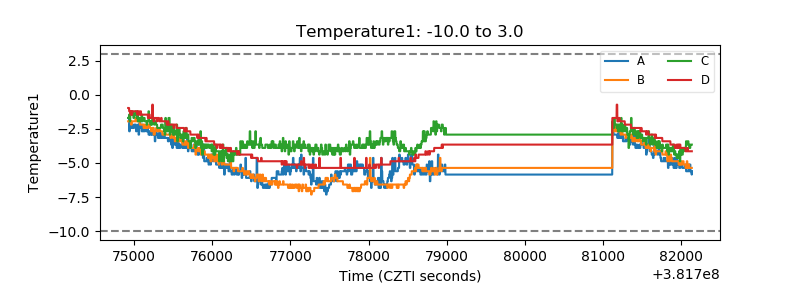 |
| Veto HV Monitor |  |
| Veto LLD | 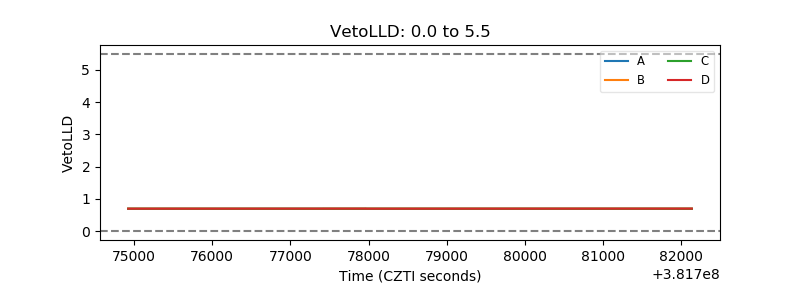 |
| Alpha Counter | 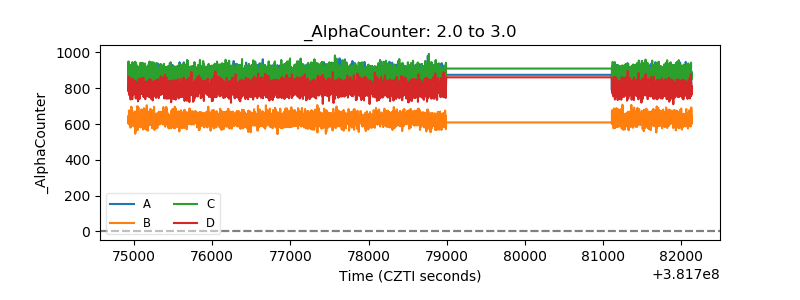 |
| _CPM_Rate | 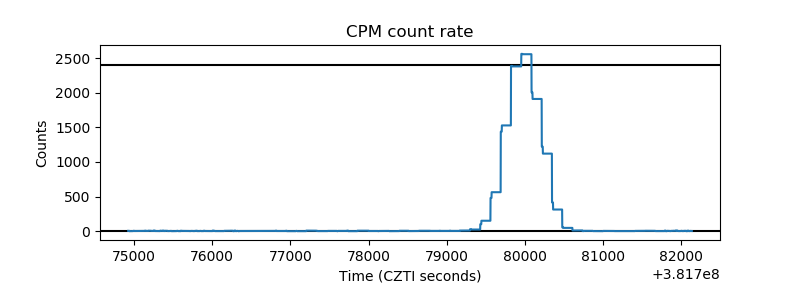 |
| CZT Counter | 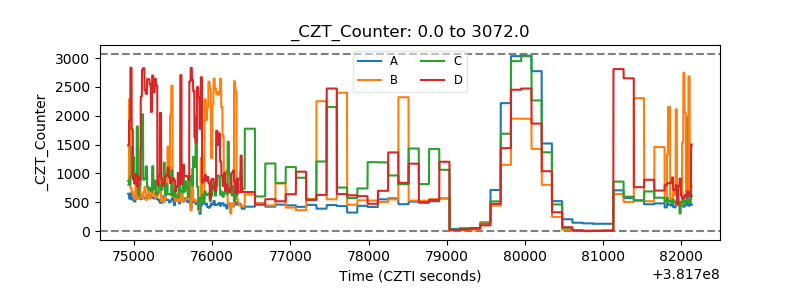 |
| +2.5 Volts monitor | 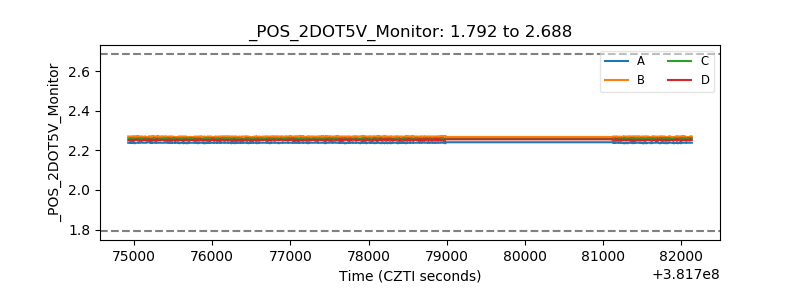 |
| +5 Volts monitor | 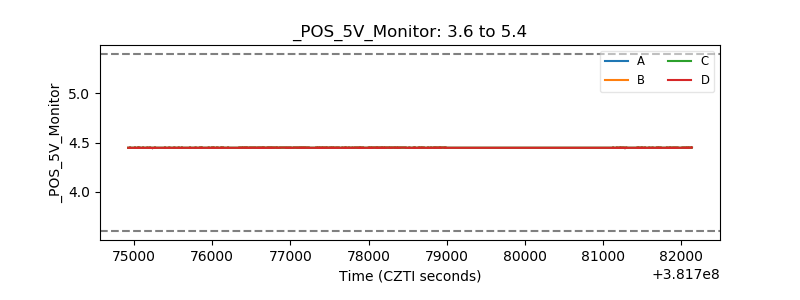 |
| _ROLL_ROT | 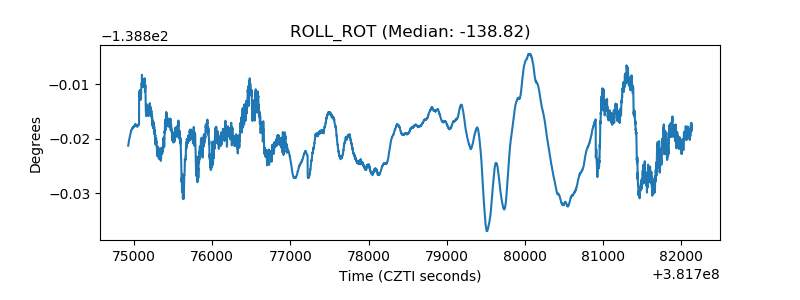 |
| _Roll_DEC | 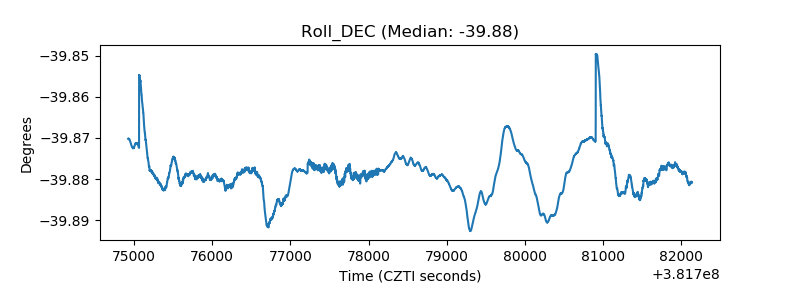 |
| _Roll_RA | 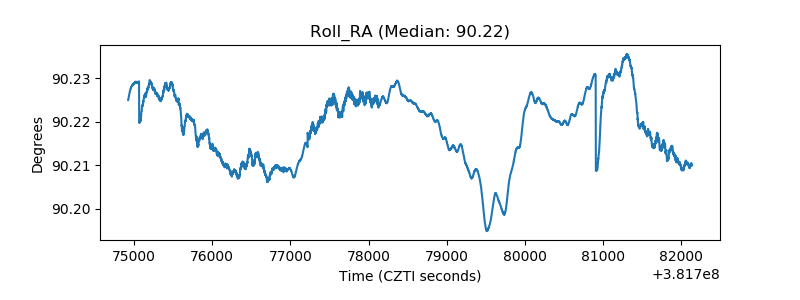 |
| Veto Counter | 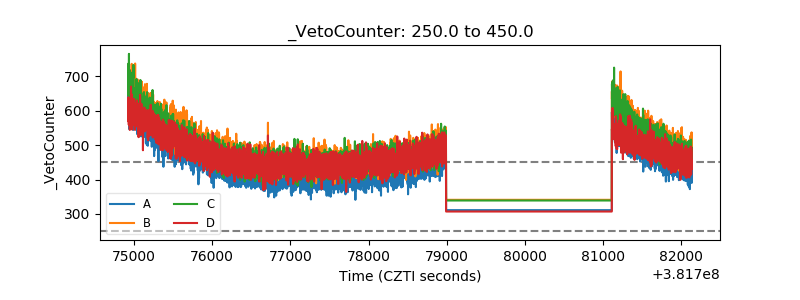 |