| Param | Original file | Final file |
|---|---|---|
| Filename | modeM0/AS1A05_085T01_9000004910_34376cztM0_level2.evt | modeM0/AS1A05_085T01_9000004910_34376cztM0_level2_quad_clean.evt |
| Size (bytes) | 114,321,600 | 20,718,720 |
| Size | 109.0 MB | 19.8 MB |
| Events in quadrant A | 528,863 | 148,073 |
| Events in quadrant B | 699,865 | 146,696 |
| Events in quadrant C | 681,781 | 143,615 |
| Events in quadrant D | 1,486,983 | 117,471 |
| Mode SS | |||
|---|---|---|---|
| Quadrant | BADHDUFLAG | Total packets | Discarded packets |
| A | 0 | 18 | 0 |
| B | 0 | 18 | 0 |
| C | 0 | 18 | 0 |
| D | 0 | 18 | 0 |
| Mode M9 | |||
|---|---|---|---|
| Quadrant | BADHDUFLAG | Total packets | Discarded packets |
| A | 0 | 10 | 0 |
| B | 0 | 10 | 0 |
| C | 0 | 10 | 0 |
| D | 0 | 10 | 0 |
| Mode M0 | |||
|---|---|---|---|
| Quadrant | BADHDUFLAG | Total packets | Discarded packets |
| A | 0 | 2147 | 2 |
| B | 0 | 2738 | 1 |
| C | 0 | 2709 | 1 |
| D | 0 | 5060 | 1 |
| Quadrant | Total seconds | Saturated seconds | Saturation percentage |
|---|---|---|---|
| A | 913 | 3 | 0.328587% |
| B | 913 | 43 | 4.709748% |
| C | 913 | 19 | 2.081051% |
| D | 913 | 315 | 34.501643% |
Noise dominated data is calculated using 1-second bins in cleaned event files. If a bin has >2000 counts, and if more than 50% of those come from <1% of pixels, then it is considered to be noise-dominated and hence unusable.
| Quadrant | # 1 sec bins | Bins with >0 counts | Bins with >2000 counts | High rate bins dominated by noise | Noise dominated (total time) | Noise dominated (detector-on time) | Marked lightcurve |
|---|---|---|---|---|---|---|---|
| A | 913 | 913 | 0 | 0 | 0.00% | 0.00% | 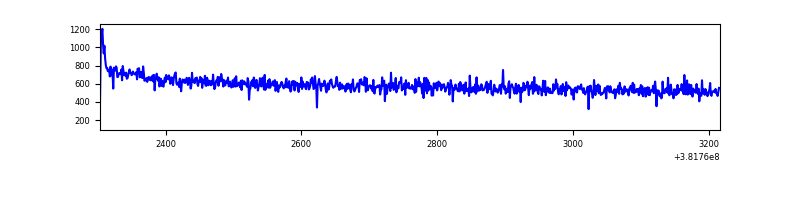 |
| B | 913 | 913 | 21 | 21 | 2.30% | 2.30% | 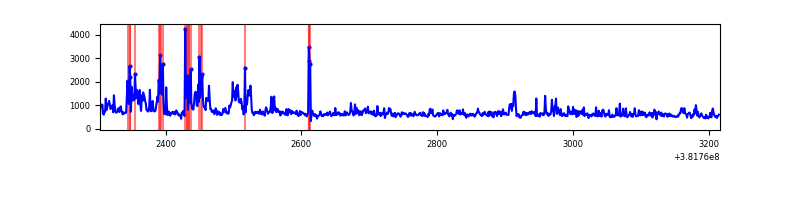 |
| C | 913 | 913 | 13 | 13 | 1.42% | 1.42% |  |
| D | 913 | 913 | 241 | 241 | 26.40% | 26.40% | 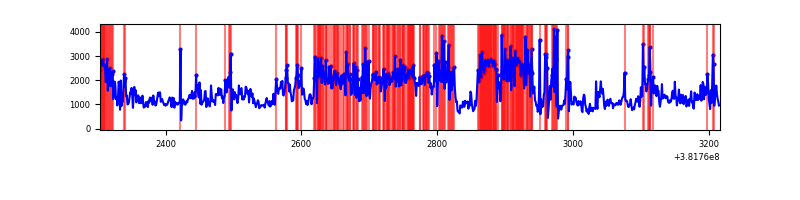 |
Top three noisy pixels from each quadrant. If the there are fewer than three noisy pixels in the level2.evt file, extra rows are filled as -1
| Pixel properties | Quadrant properties | ||||||
|---|---|---|---|---|---|---|---|
| Quadrant | DetID | PixID | Counts | Sigma | Mean | Median | Sigma |
| A | 10 | 83 | 14208 | 490.81 | 132 | 129 | 28.7 |
| A | 13 | 6 | 2137 | 70.0 | 132 | 129 | 28.7 |
| A | 13 | 254 | 1511 | 48.18 | 132 | 129 | 28.7 |
| B | 5 | 172 | 111259 | 4262.04 | 127 | 124 | 26.1 |
| B | 4 | 251 | 42236 | 1615.0 | 127 | 124 | 26.1 |
| B | 5 | 255 | 13494 | 512.74 | 127 | 124 | 26.1 |
| C | 4 | 254 | 75950 | 2538.04 | 123 | 124 | 29.9 |
| C | 15 | 214 | 42019 | 1402.31 | 123 | 124 | 29.9 |
| C | 0 | 10 | 38637 | 1289.1 | 123 | 124 | 29.9 |
| D | 12 | 235 | 268888 | 9225.88 | 112 | 109 | 29.1 |
| D | 7 | 223 | 251109 | 8615.61 | 112 | 109 | 29.1 |
| D | 8 | 195 | 178933 | 6138.16 | 112 | 109 | 29.1 |
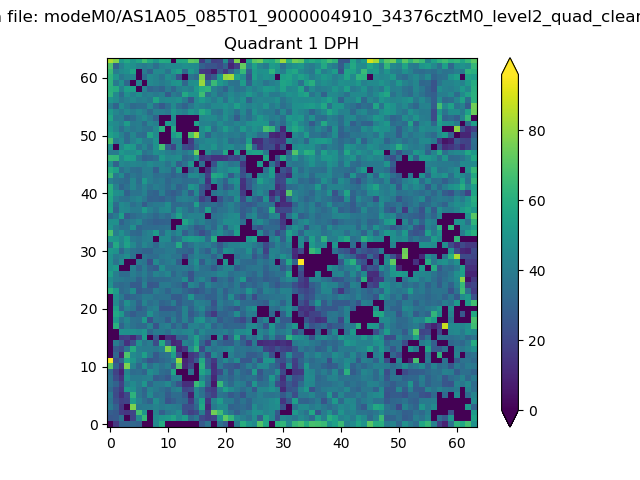
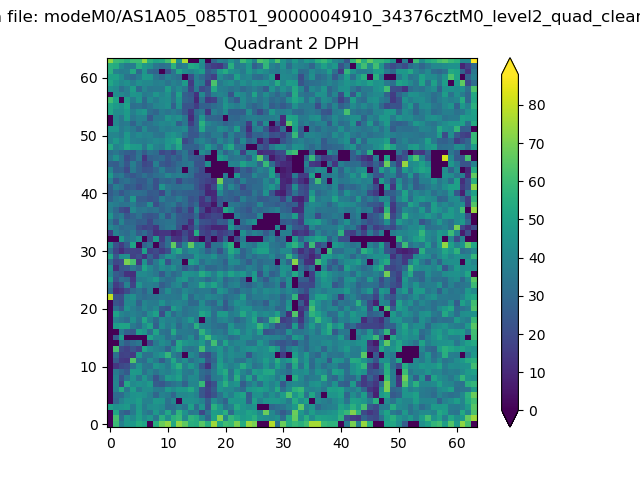
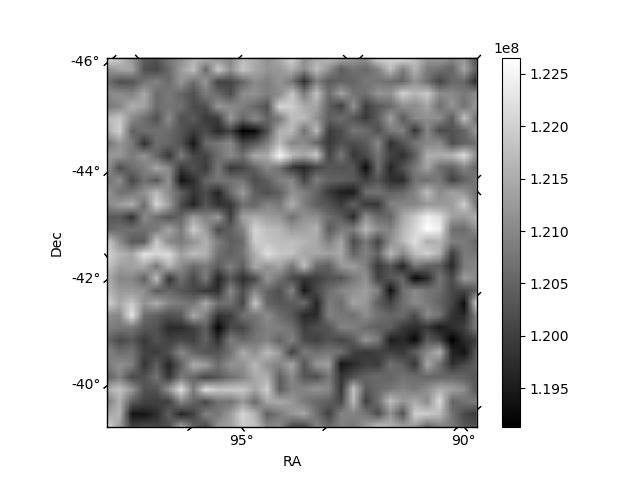
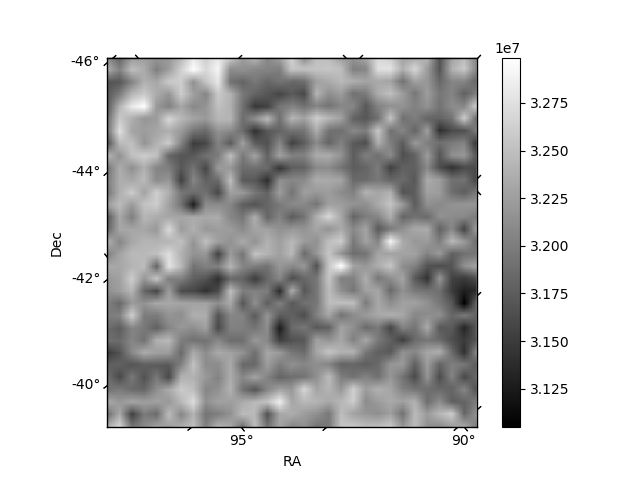
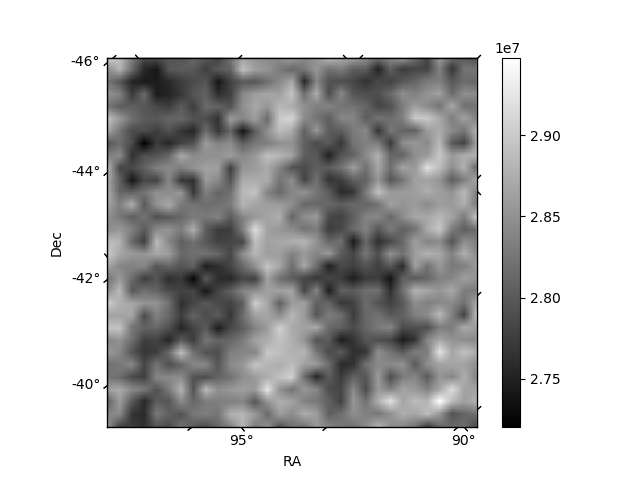
Histogram calculated using DETX and DETY for each event in the final _common_clean file
| Quadrant A | 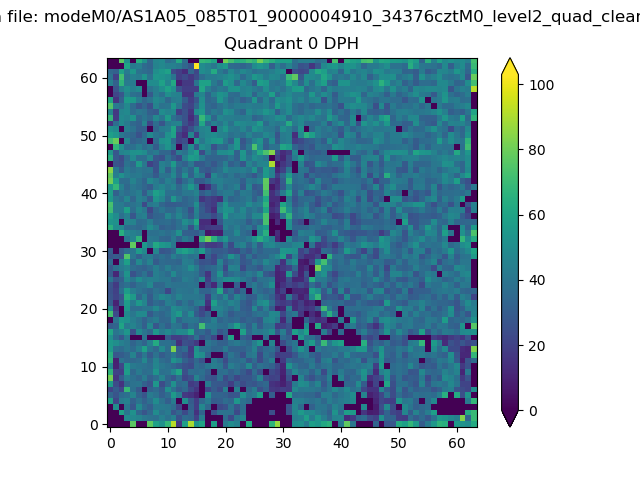 |
 |
Quadrant B |
|---|---|---|---|
| Quadrant D | 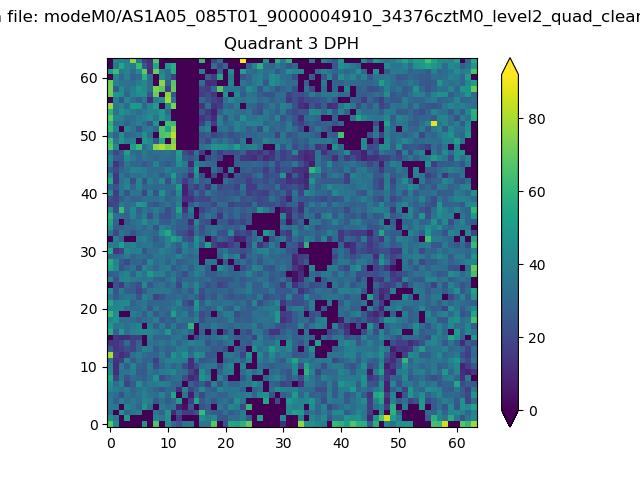 |
 |
Quadrant C |
| Plot type | Count rate plots | Images |
|---|---|---|
| Comparison with Poisson distribution Blue bars denote a histogram of data divided into 1 sec bins. Red curve is a Poisson curve with rate = median count rate of data. |
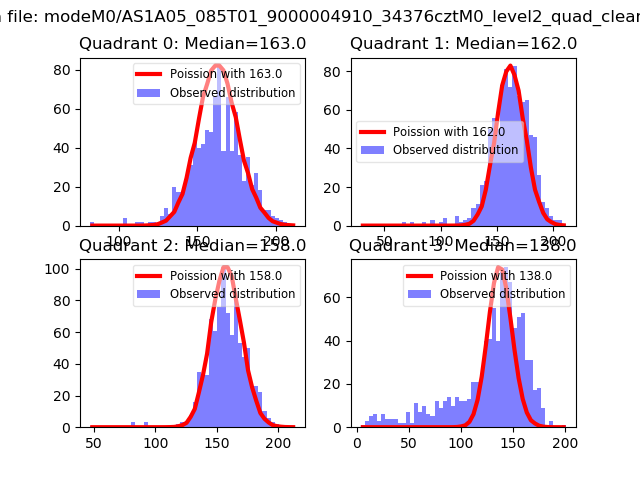 |
 |
| Quadrant-wise count rates Data is divided into 100 sec bins |
 |
|
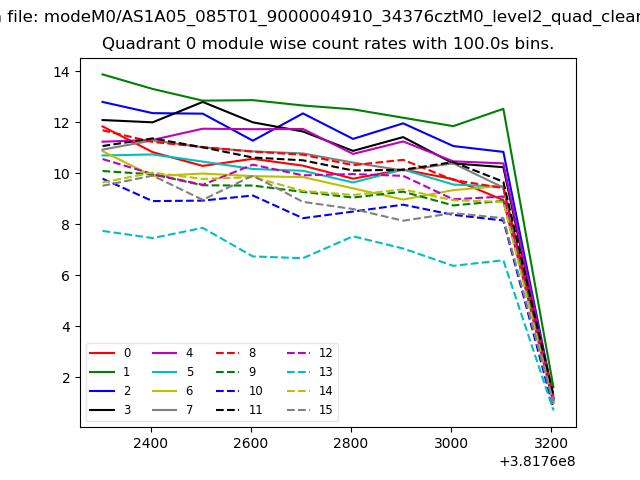
| Module-wise count rates for Quadrant A Data is divided into 100 sec bins |
 |
 |
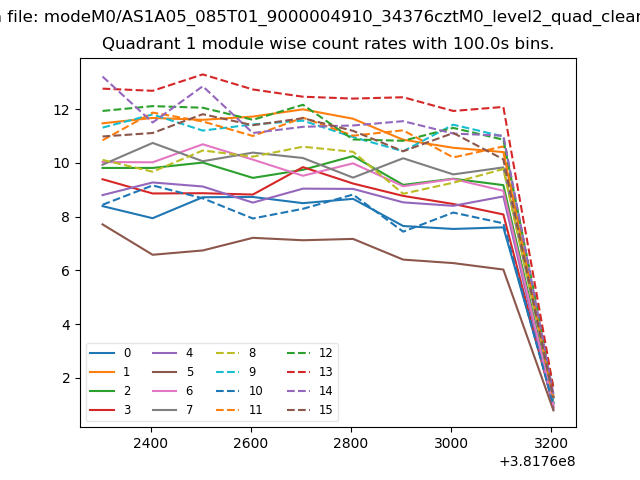
| Module-wise count rates for Quadrant B Data is divided into 100 sec bins |
 |
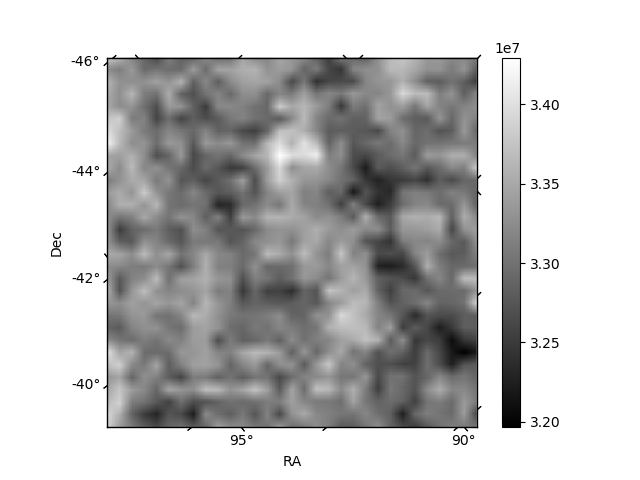 |
| Module-wise count rates for Quadrant C Data is divided into 100 sec bins |
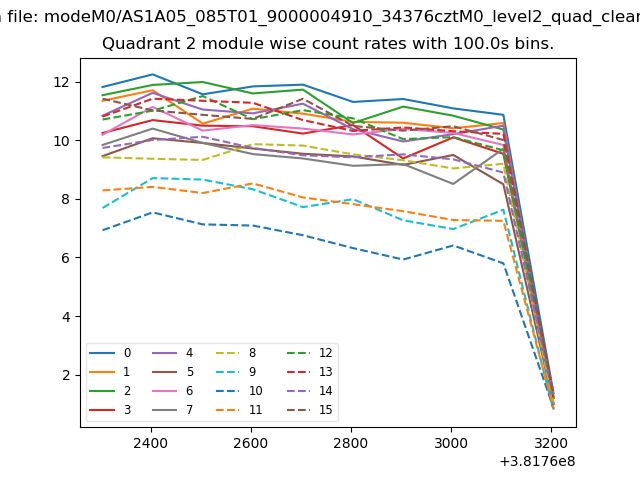 |
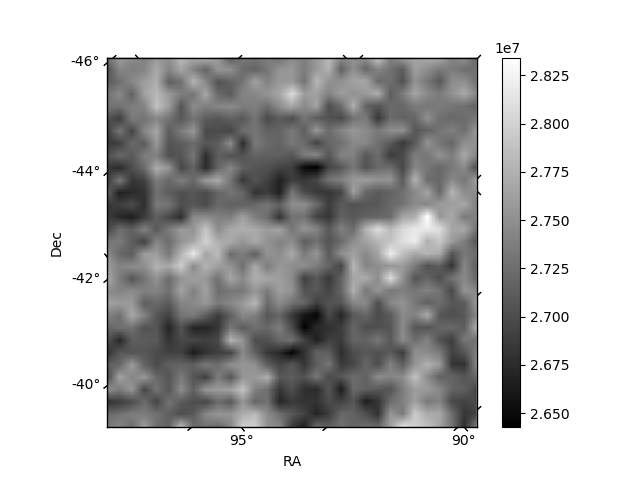 |
| Module-wise count rates for Quadrant D Data is divided into 100 sec bins |
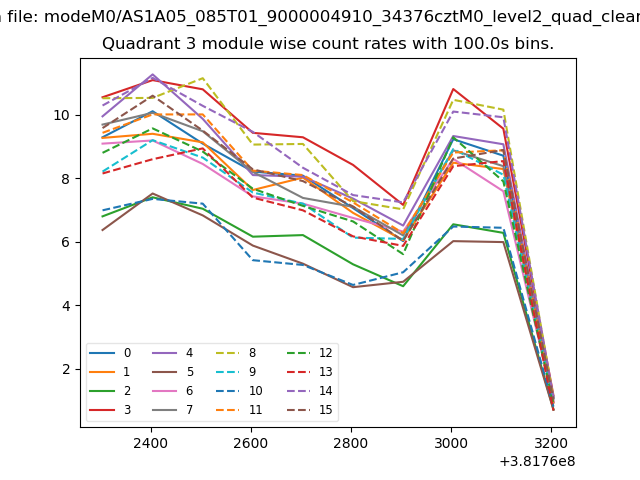 |
 |
| Parameter | Plot |
|---|---|
| CZT HV Monitor | 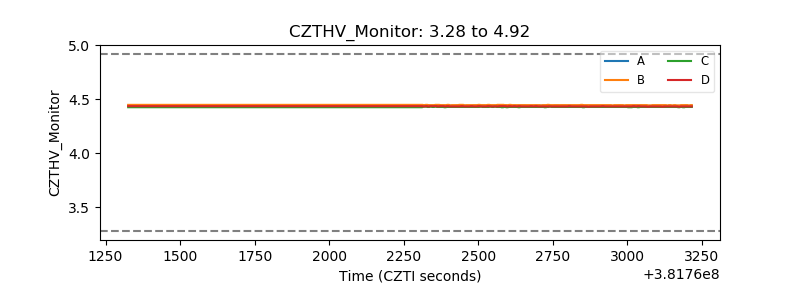 |
| D_VDD | 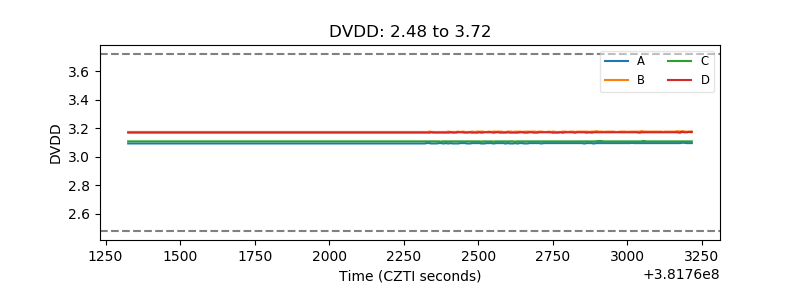 |
| Temperature 1 | 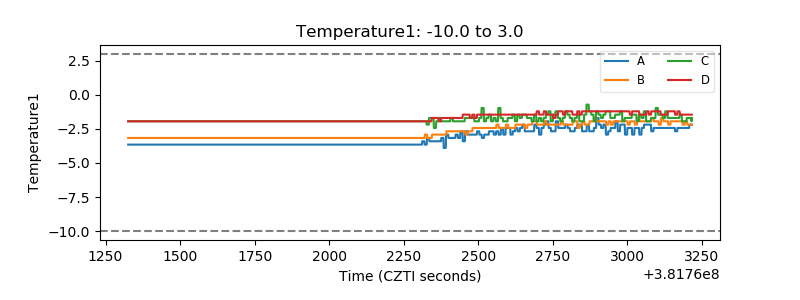 |
| Veto HV Monitor | 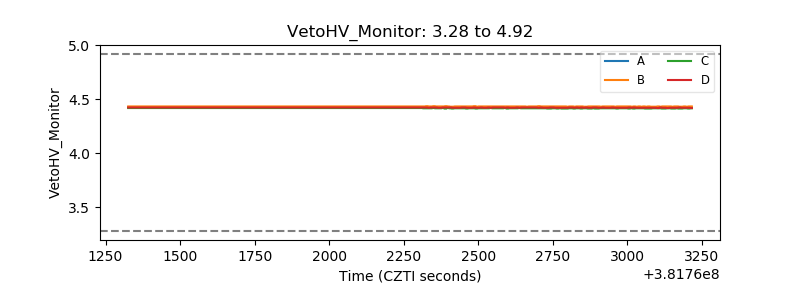 |
| Veto LLD | 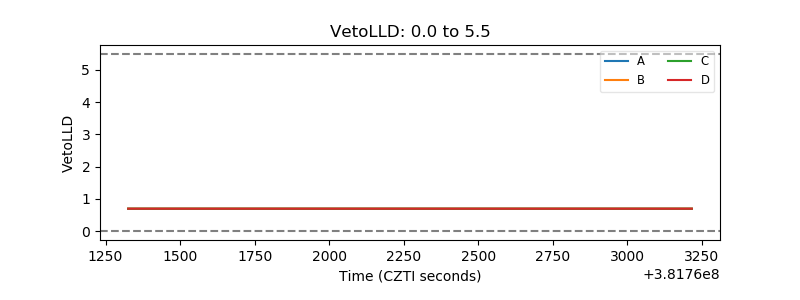 |
| Alpha Counter | 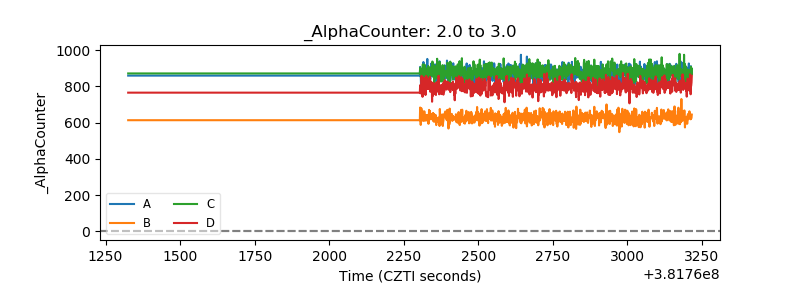 |
| _CPM_Rate |  |
| CZT Counter |  |
| +2.5 Volts monitor | 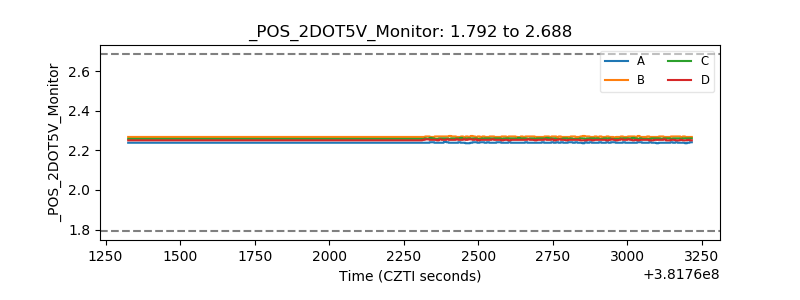 |
| +5 Volts monitor | 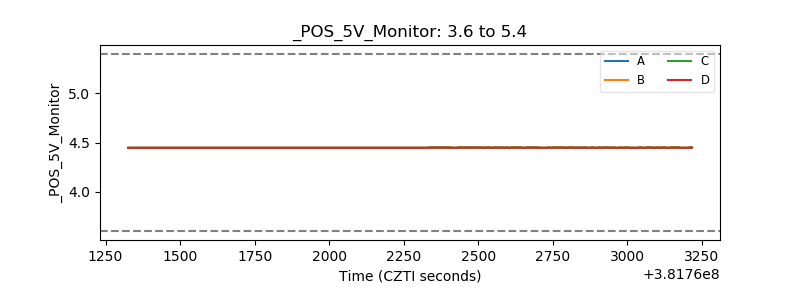 |
| _ROLL_ROT | 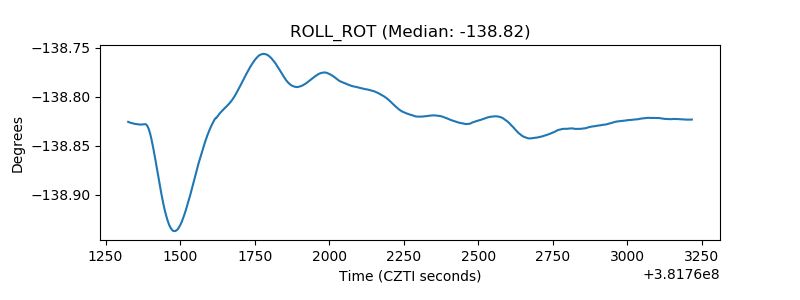 |
| _Roll_DEC | 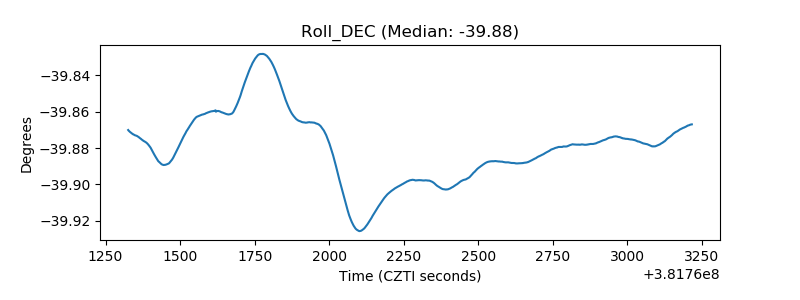 |
| _Roll_RA |  |
| Veto Counter | 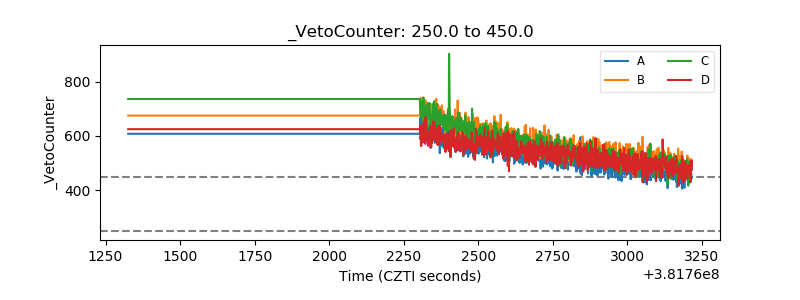 |