| Param | Original file | Final file |
|---|---|---|
| Filename | modeM0/AS1A05_085T01_9000004910cztM0_level2_bc.evt | modeM0/AS1A05_085T01_9000004910cztM0_level2_quad_clean.evt |
| Size (bytes) | 9,132,946,560 | 1,691,556,480 |
| Size | 8.5 GB | 1.6 GB |
| Events in quadrant A | 27,327,653 | 11,517,762 |
| Events in quadrant B | 40,919,355 | 11,242,339 |
| Events in quadrant C | 51,081,810 | 11,261,272 |
| Events in quadrant D | 148,705,863 | 8,549,242 |
| Mode SS | |||
|---|---|---|---|
| Quadrant | BADHDUFLAG | Total packets | Discarded packets |
| A | 0 | 2580 | 0 |
| B | 0 | 2580 | 0 |
| C | 0 | 2580 | 0 |
| D | 0 | 2580 | 0 |
| Mode M9 | |||
|---|---|---|---|
| Quadrant | BADHDUFLAG | Total packets | Discarded packets |
| A | 0 | 474 | 0 |
| B | 0 | 474 | 0 |
| C | 0 | 474 | 0 |
| D | 0 | 474 | 0 |
| Mode M0 | |||
|---|---|---|---|
| Quadrant | BADHDUFLAG | Total packets | Discarded packets |
| A | 0 | 259705 | 0 |
| B | 0 | 321823 | 0 |
| C | 0 | 330784 | 0 |
| D | 0 | 656970 | 0 |
| Quadrant | Total seconds | Saturated seconds | Saturation percentage |
|---|---|---|---|
| A | 126259 | 411 | 0.325521% |
| B | 126259 | 6295 | 4.985783% |
| C | 126259 | 4570 | 3.619544% |
| D | 126259 | 42903 | 33.980152% |
Noise dominated data is calculated using 1-second bins in cleaned event files. If a bin has >2000 counts, and if more than 50% of those come from <1% of pixels, then it is considered to be noise-dominated and hence unusable.
| Quadrant | # 1 sec bins | Bins with >0 counts | Bins with >2000 counts | High rate bins dominated by noise | Noise dominated (total time) | Noise dominated (detector-on time) | Marked lightcurve |
|---|---|---|---|---|---|---|---|
| A | 172717 | 126276 | 25 | 25 | 0.01% | 0.02% | 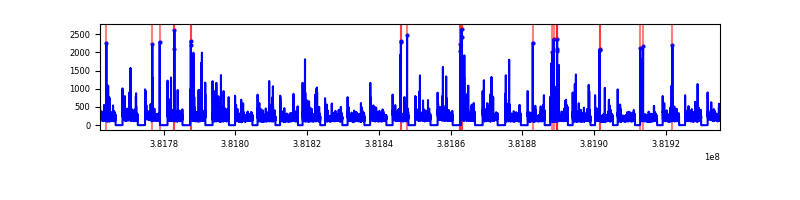 |
| B | 172716 | 126257 | 324 | 324 | 0.19% | 0.26% | 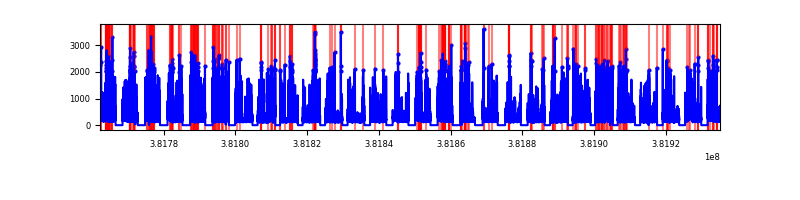 |
| C | 172716 | 126260 | 1873 | 1873 | 1.08% | 1.48% | 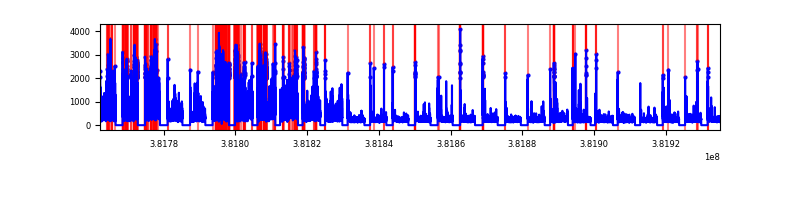 |
| D | 172716 | 126253 | 26525 | 26525 | 15.36% | 21.01% | 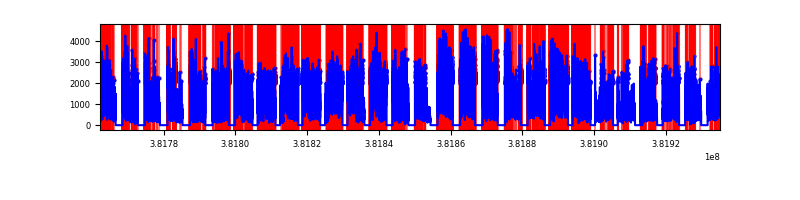 |
Top three noisy pixels from each quadrant. If the there are fewer than three noisy pixels in the level2.evt file, extra rows are filled as -1
| Pixel properties | Quadrant properties | ||||||
|---|---|---|---|---|---|---|---|
| Quadrant | DetID | PixID | Counts | Sigma | Mean | Median | Sigma |
| A | 9 | 143 | 564582 | 380.51 | 6665 | 6576 | 1466.5 |
| A | 10 | 83 | 503966 | 339.18 | 6665 | 6576 | 1466.5 |
| A | 13 | 6 | 272715 | 181.48 | 6665 | 6576 | 1466.5 |
| B | 5 | 172 | 11686043 | 8985.71 | 6578 | 6445 | 1299.8 |
| B | 0 | 190 | 906942 | 692.8 | 6578 | 6445 | 1299.8 |
| B | 5 | 255 | 824662 | 629.5 | 6578 | 6445 | 1299.8 |
| C | 4 | 254 | 17649793 | 12159.55 | 6381 | 6342 | 1451.0 |
| C | 15 | 214 | 4903980 | 3375.36 | 6381 | 6342 | 1451.0 |
| C | 14 | 67 | 1290927 | 885.31 | 6381 | 6342 | 1451.0 |
| D | 7 | 223 | 72136359 | 54446.21 | 5460 | 5294 | 1324.8 |
| D | 2 | 249 | 18483654 | 13947.9 | 5460 | 5294 | 1324.8 |
| D | 8 | 195 | 17293012 | 13049.17 | 5460 | 5294 | 1324.8 |
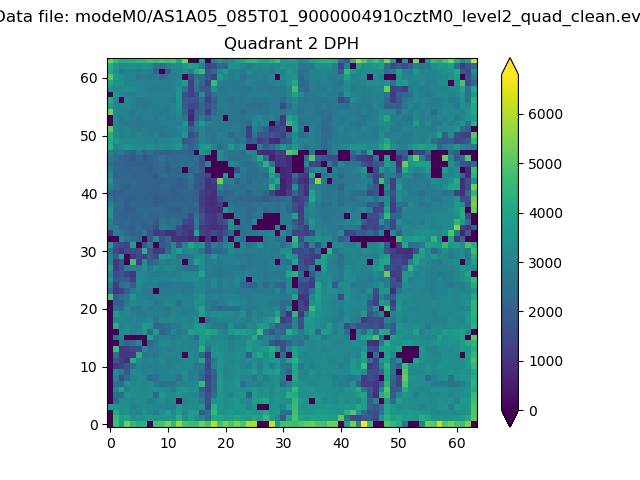
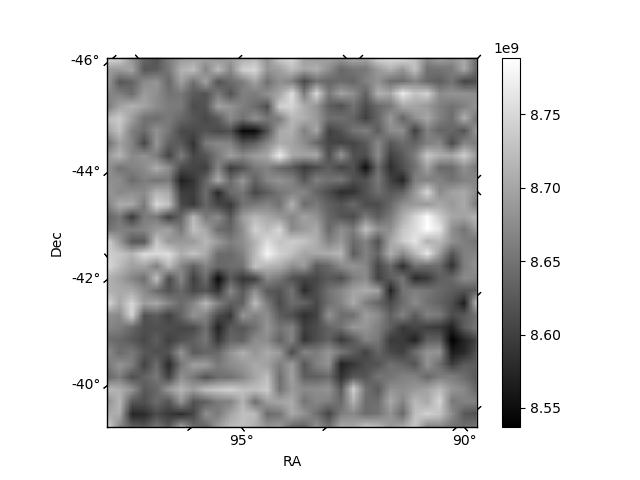
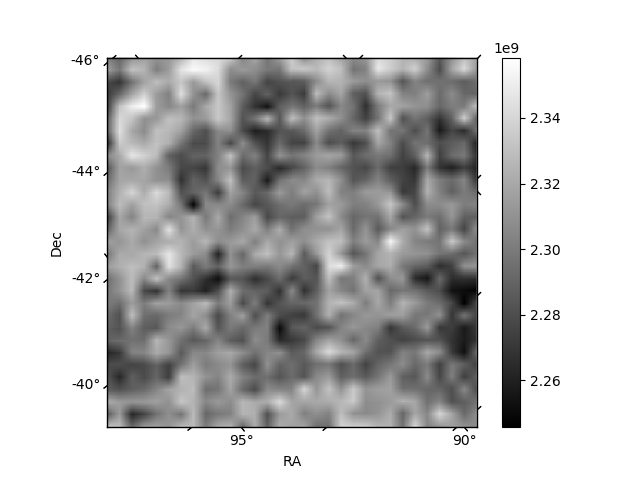
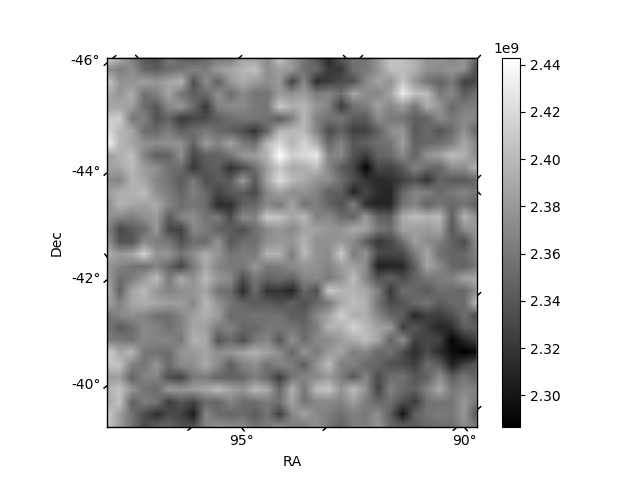
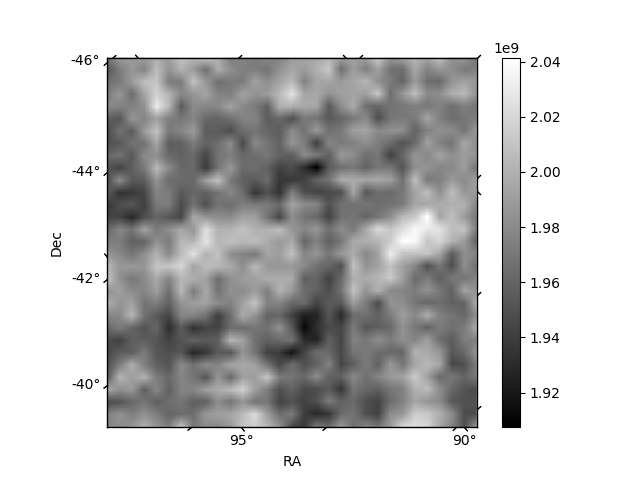
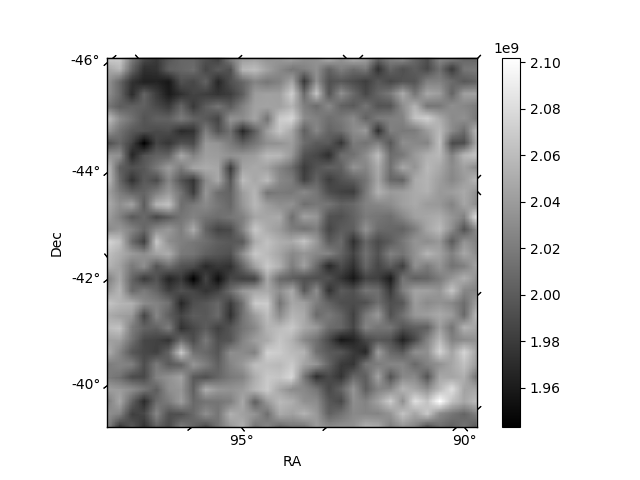
Histogram calculated using DETX and DETY for each event in the final _common_clean file
| Quadrant A | 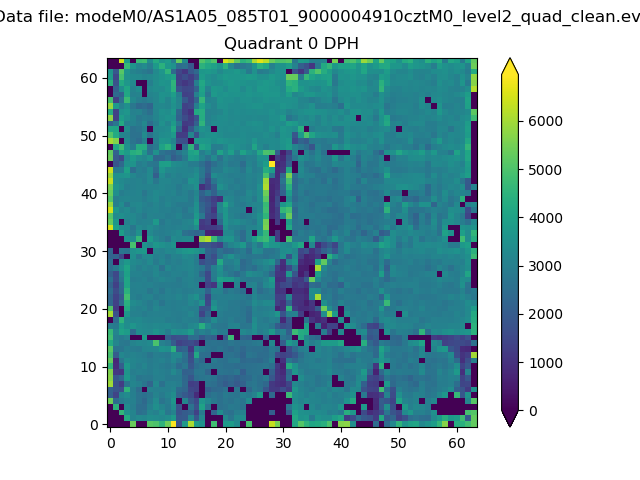 |
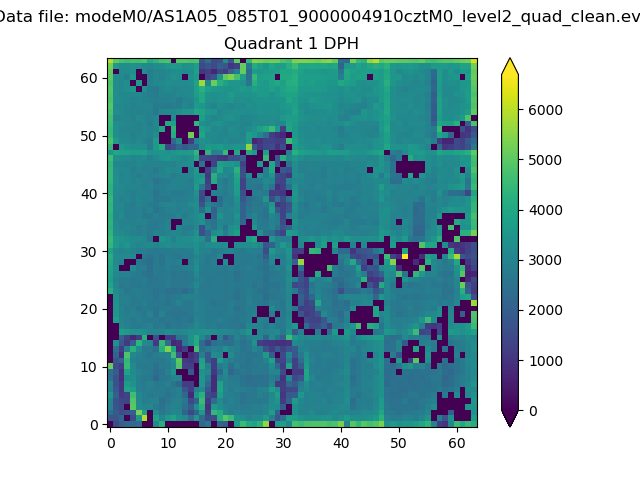 |
Quadrant B |
|---|---|---|---|
| Quadrant D | 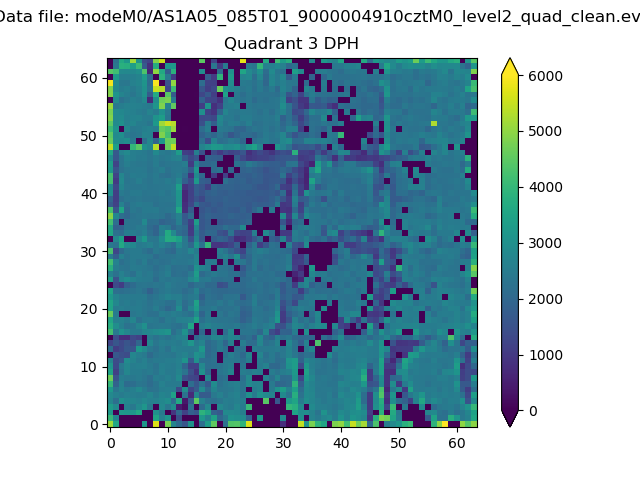 |
 |
Quadrant C |
| Plot type | Count rate plots | Images |
|---|---|---|
| Comparison with Poisson distribution Blue bars denote a histogram of data divided into 1 sec bins. Red curve is a Poisson curve with rate = median count rate of data. |
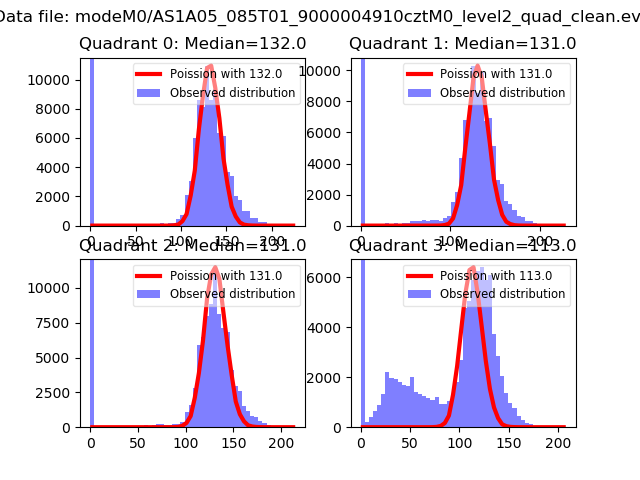 |
 |
| Quadrant-wise count rates Data is divided into 100 sec bins |
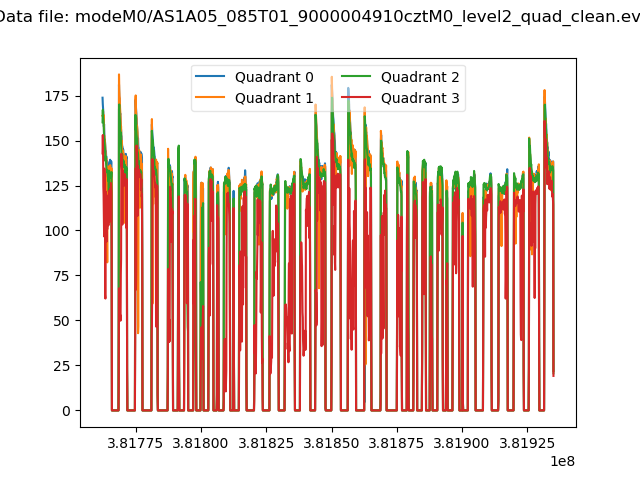 |
|
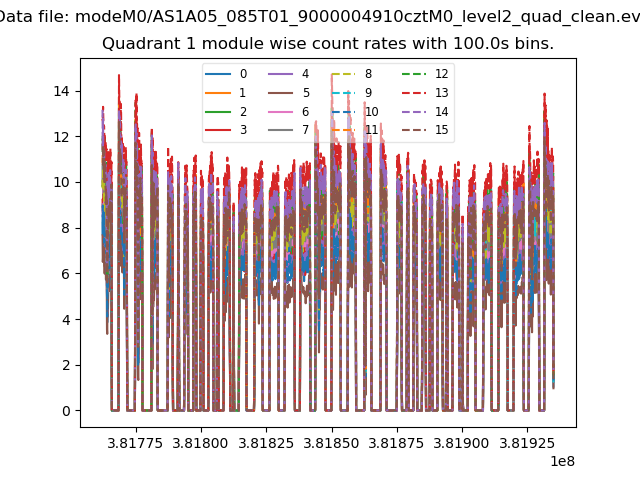
| Module-wise count rates for Quadrant A Data is divided into 100 sec bins |
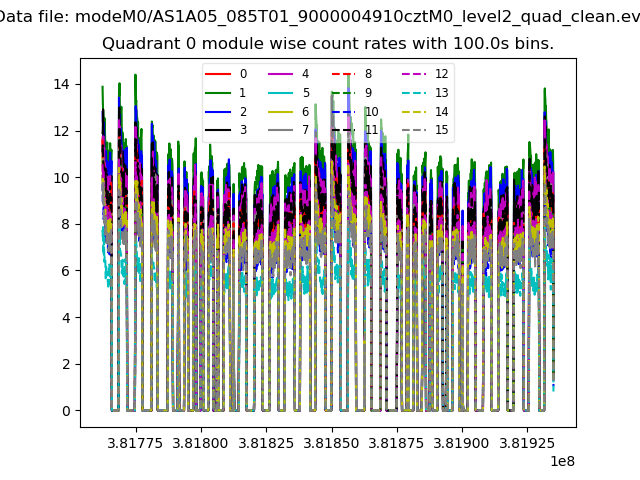 |
 |
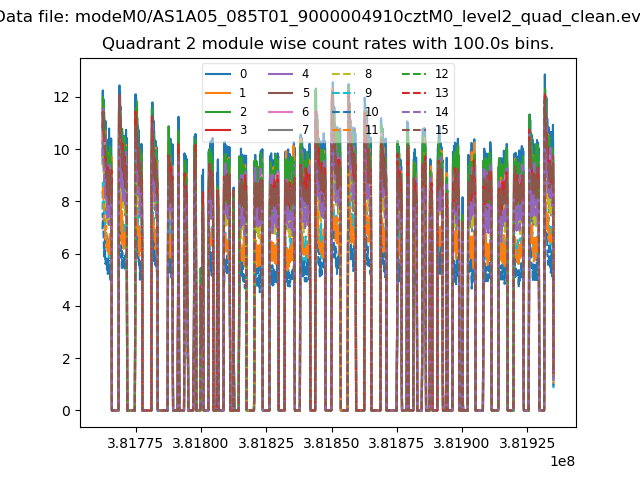
| Module-wise count rates for Quadrant B Data is divided into 100 sec bins |
 |
 |
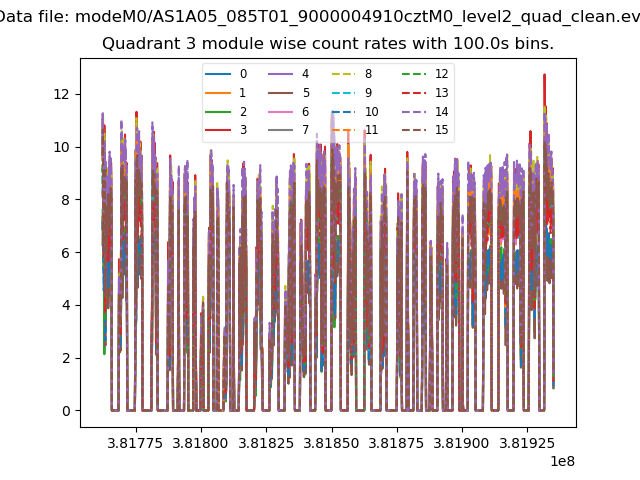
| Module-wise count rates for Quadrant C Data is divided into 100 sec bins |
 |
 |
| Module-wise count rates for Quadrant D Data is divided into 100 sec bins |
 |
 |
| Parameter | Plot |
|---|---|
| CZT HV Monitor | 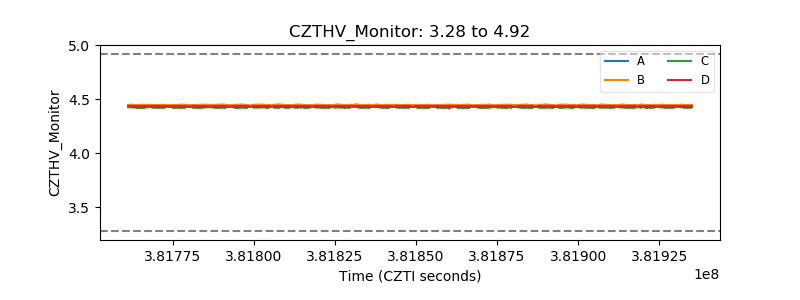 |
| D_VDD | 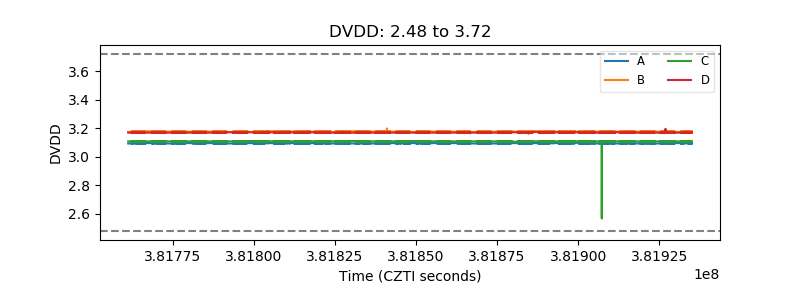 |
| Temperature 1 | 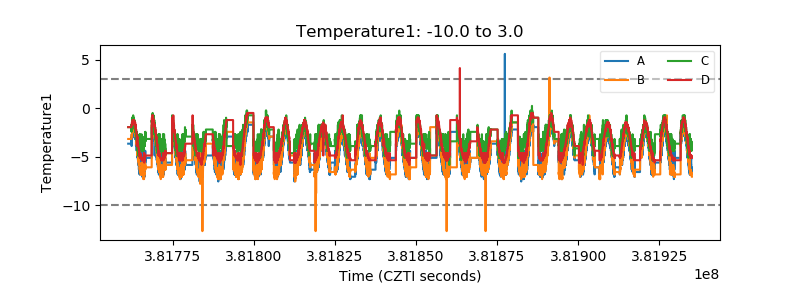 |
| Veto HV Monitor | 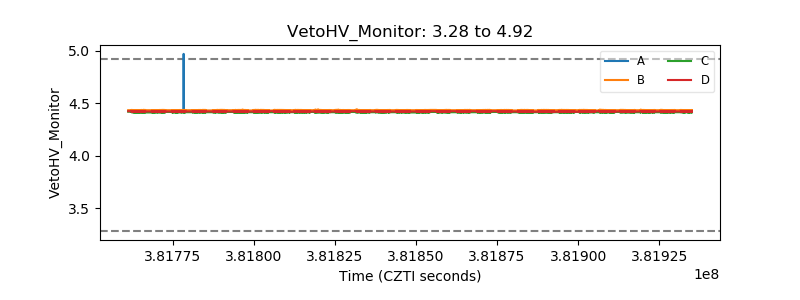 |
| Veto LLD | 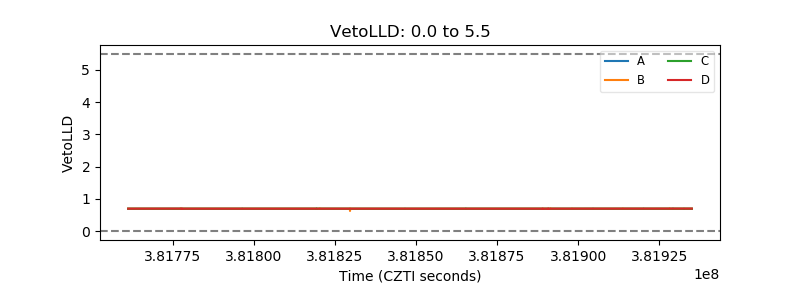 |
| Alpha Counter | 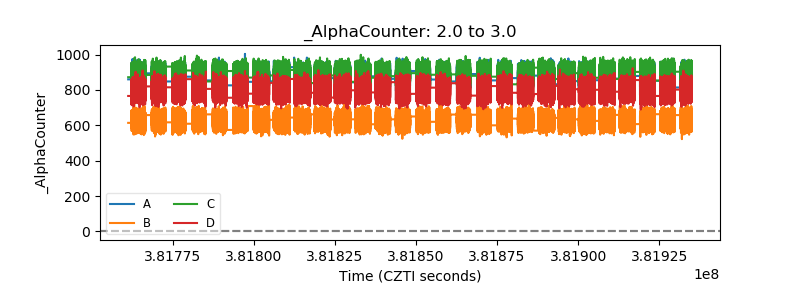 |
| _CPM_Rate | 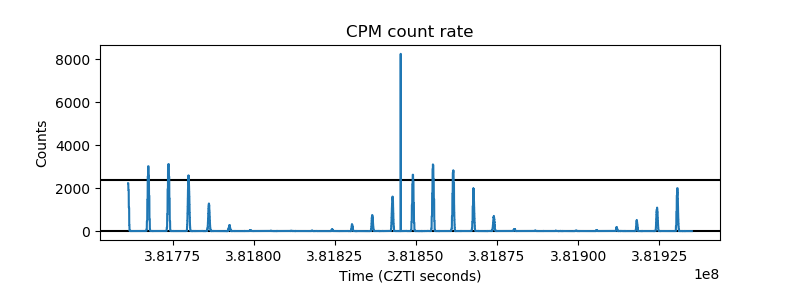 |
| CZT Counter | 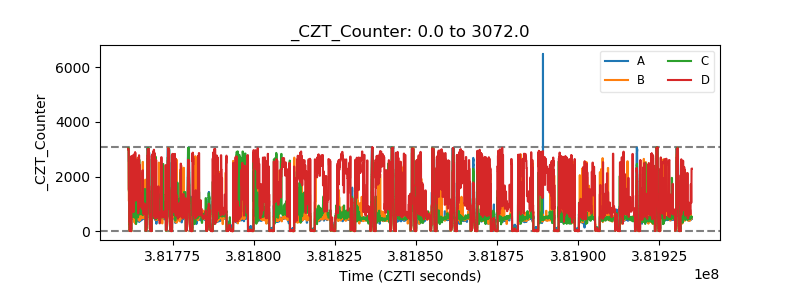 |
| +2.5 Volts monitor | 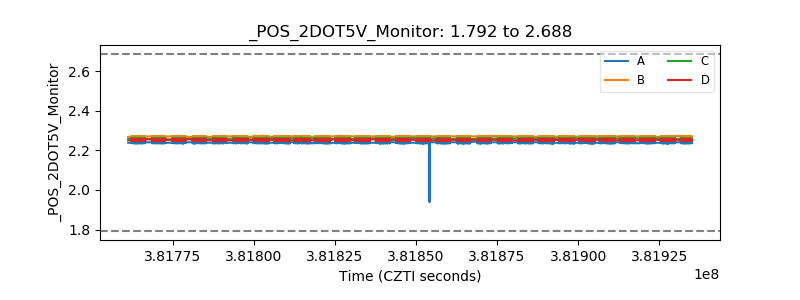 |
| +5 Volts monitor |  |
| _ROLL_ROT | 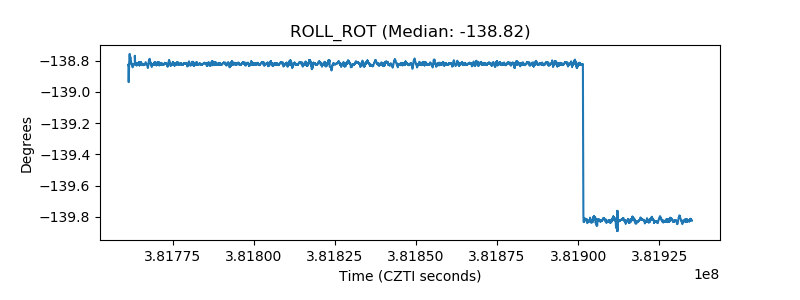 |
| _Roll_DEC | 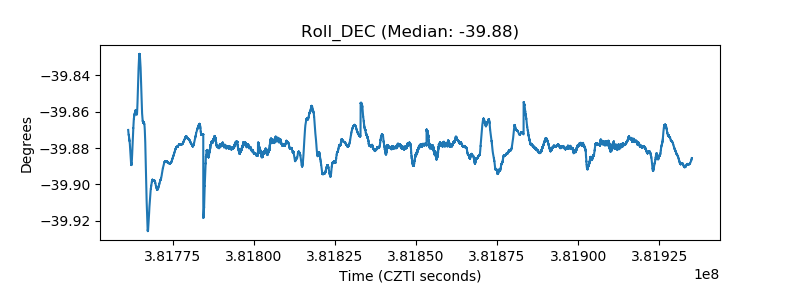 |
| _Roll_RA | 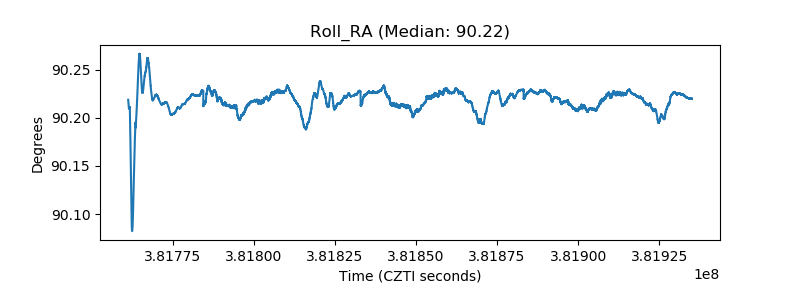 |
| Veto Counter | 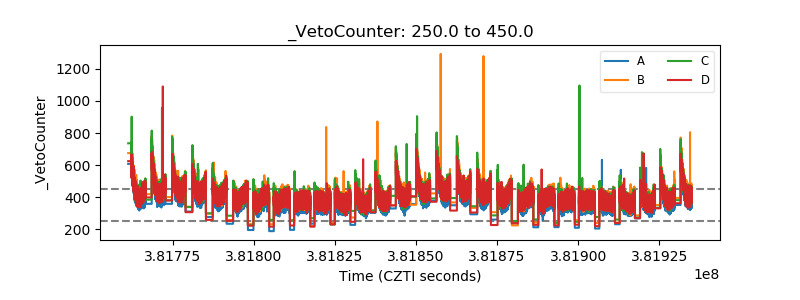 |