| Param | Original file | Final file |
|---|---|---|
| Filename | modeM0/AS1A05_082T12_9000004908_34376cztM0_level2.evt | modeM0/AS1A05_082T12_9000004908_34376cztM0_level2_quad_clean.evt |
| Size (bytes) | 434,998,080 | 37,814,400 |
| Size | 414.8 MB | 36.1 MB |
| Events in quadrant A | 1,901,171 | 224,784 |
| Events in quadrant B | 2,572,862 | 225,847 |
| Events in quadrant C | 3,043,449 | 218,920 |
| Events in quadrant D | 5,390,514 | 197,921 |
| Mode SS | |||
|---|---|---|---|
| Quadrant | BADHDUFLAG | Total packets | Discarded packets |
| A | 0 | 78 | 0 |
| B | 0 | 78 | 0 |
| C | 0 | 78 | 0 |
| D | 0 | 78 | 0 |
| Mode M0 | |||
|---|---|---|---|
| Quadrant | BADHDUFLAG | Total packets | Discarded packets |
| A | 0 | 8049 | 1 |
| B | 0 | 10210 | 1 |
| C | 0 | 11751 | 1 |
| D | 0 | 18827 | 1 |
| Mode M9 | |||
|---|---|---|---|
| Quadrant | BADHDUFLAG | Total packets | Discarded packets |
| A | 0 | 3 | 0 |
| B | 0 | 3 | 0 |
| C | 0 | 3 | 0 |
| D | 0 | 4 | 0 |
| Quadrant | Total seconds | Saturated seconds | Saturation percentage |
|---|---|---|---|
| A | 3925 | 4 | 0.101911% |
| B | 3925 | 63 | 1.605096% |
| C | 3925 | 136 | 3.464968% |
| D | 3925 | 728 | 18.547771% |
Noise dominated data is calculated using 1-second bins in cleaned event files. If a bin has >2000 counts, and if more than 50% of those come from <1% of pixels, then it is considered to be noise-dominated and hence unusable.
| Quadrant | # 1 sec bins | Bins with >0 counts | Bins with >2000 counts | High rate bins dominated by noise | Noise dominated (total time) | Noise dominated (detector-on time) | Marked lightcurve |
|---|---|---|---|---|---|---|---|
| A | 3925 | 3925 | 1 | 1 | 0.03% | 0.03% | 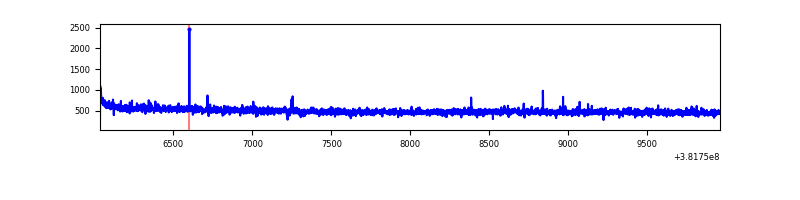 |
| B | 3925 | 3925 | 27 | 27 | 0.69% | 0.69% | 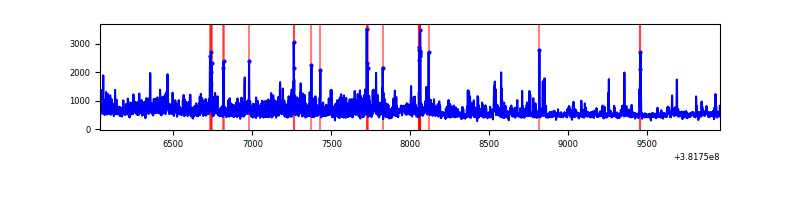 |
| C | 3925 | 3925 | 124 | 124 | 3.16% | 3.16% | 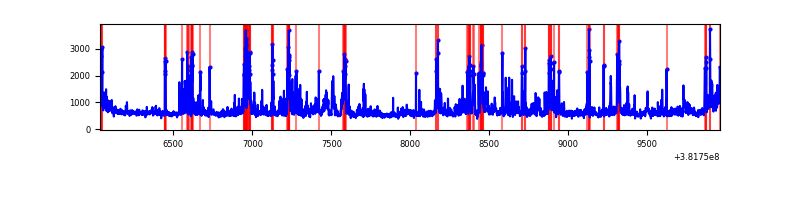 |
| D | 3925 | 3925 | 661 | 661 | 16.84% | 16.84% | 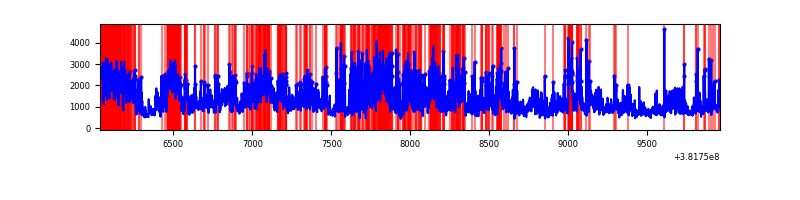 |
Top three noisy pixels from each quadrant. If the there are fewer than three noisy pixels in the level2.evt file, extra rows are filled as -1
| Pixel properties | Quadrant properties | ||||||
|---|---|---|---|---|---|---|---|
| Quadrant | DetID | PixID | Counts | Sigma | Mean | Median | Sigma |
| A | 10 | 83 | 17825 | 177.98 | 482 | 473 | 97.5 |
| A | 9 | 143 | 10232 | 100.1 | 482 | 473 | 97.5 |
| A | 13 | 6 | 7708 | 74.21 | 482 | 473 | 97.5 |
| B | 4 | 251 | 394109 | 4257.35 | 474 | 462 | 92.5 |
| B | 5 | 172 | 154345 | 1664.26 | 474 | 462 | 92.5 |
| B | 0 | 190 | 47870 | 512.72 | 474 | 462 | 92.5 |
| C | 4 | 254 | 997518 | 9298.94 | 463 | 467 | 107.2 |
| C | 15 | 214 | 162323 | 1509.54 | 463 | 467 | 107.2 |
| C | 0 | 10 | 40884 | 376.95 | 463 | 467 | 107.2 |
| D | 12 | 235 | 2103083 | 19124.05 | 445 | 433 | 109.9 |
| D | 8 | 195 | 506285 | 4600.83 | 445 | 433 | 109.9 |
| D | 7 | 223 | 324855 | 2950.69 | 445 | 433 | 109.9 |
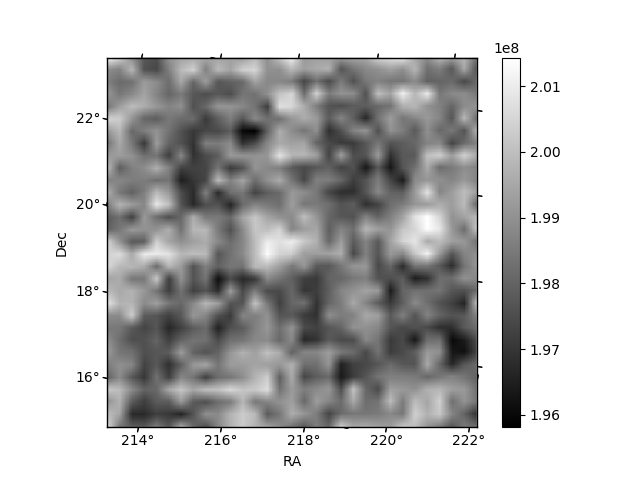
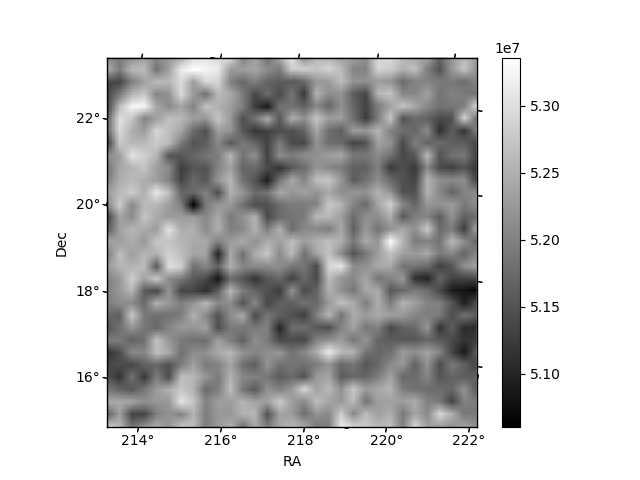
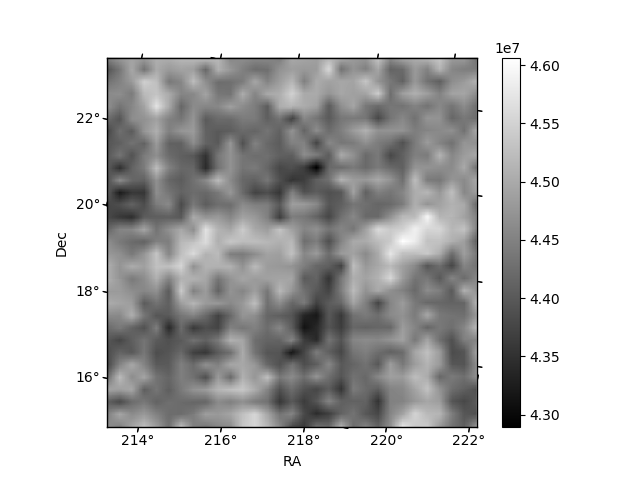
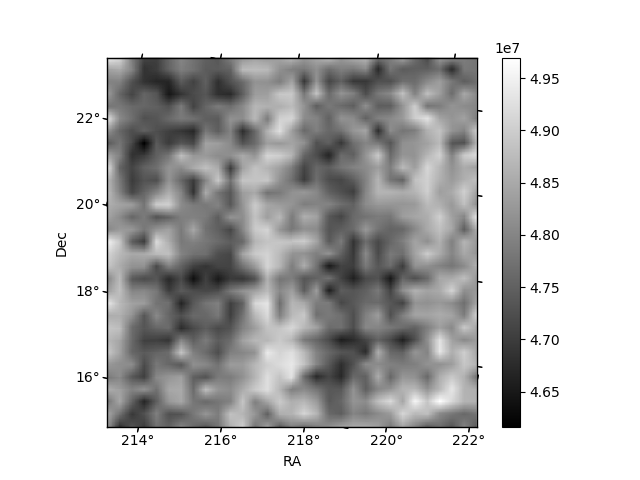
Histogram calculated using DETX and DETY for each event in the final _common_clean file
| Quadrant A | 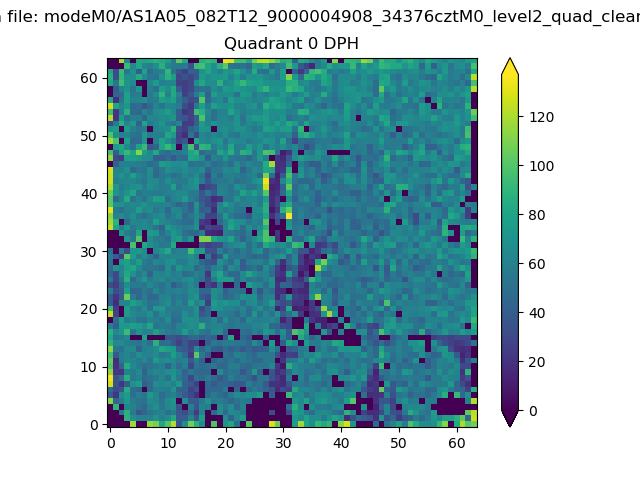 |
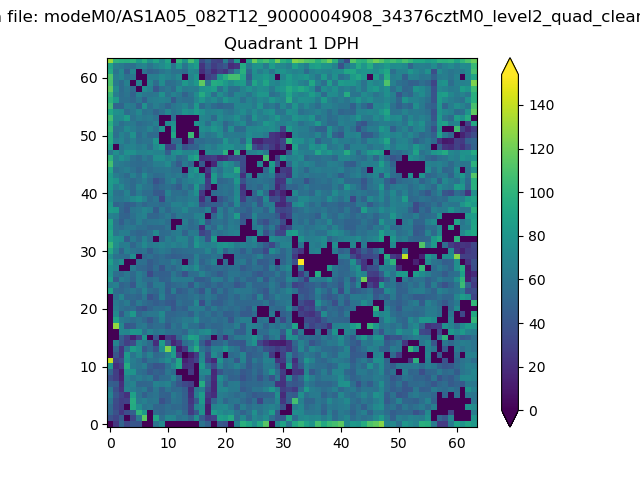 |
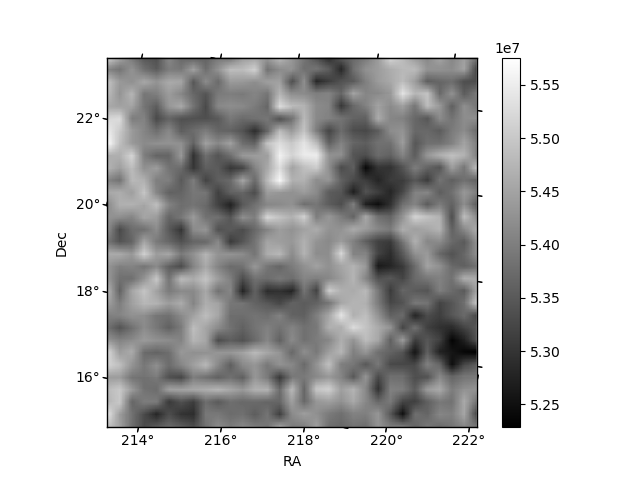
Quadrant B |
|---|---|---|---|
| Quadrant D | 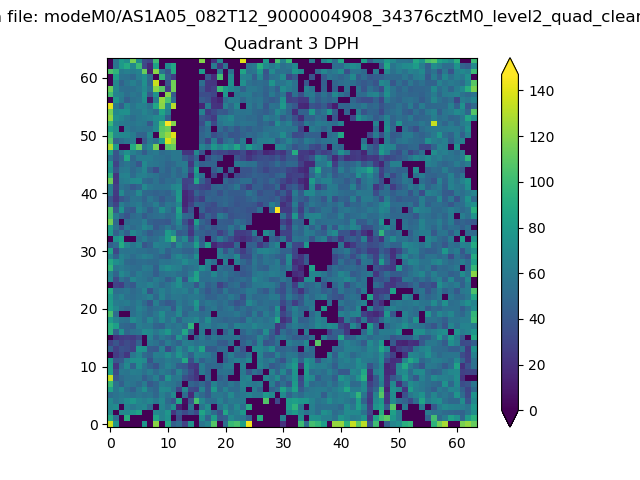 |
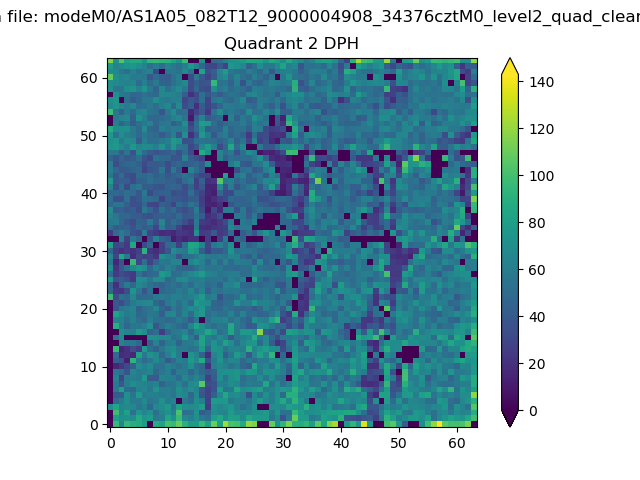 |
Quadrant C |
| Plot type | Count rate plots | Images |
|---|---|---|
| Comparison with Poisson distribution Blue bars denote a histogram of data divided into 1 sec bins. Red curve is a Poisson curve with rate = median count rate of data. |
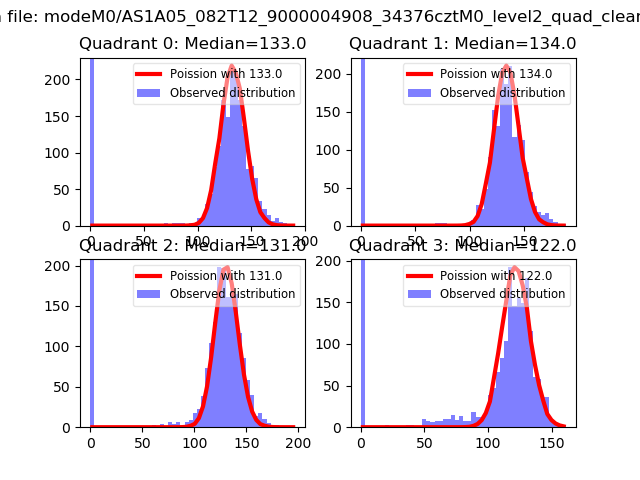 |
 |
| Quadrant-wise count rates Data is divided into 100 sec bins |
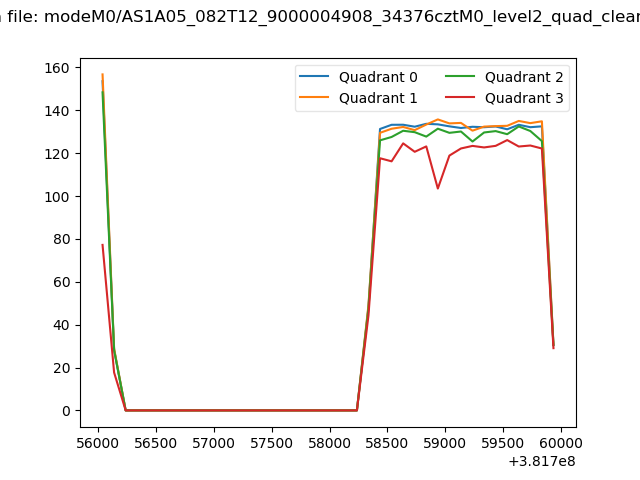 |
|
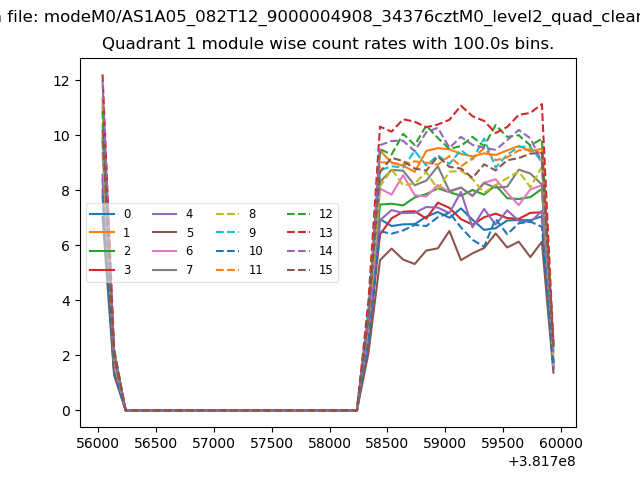
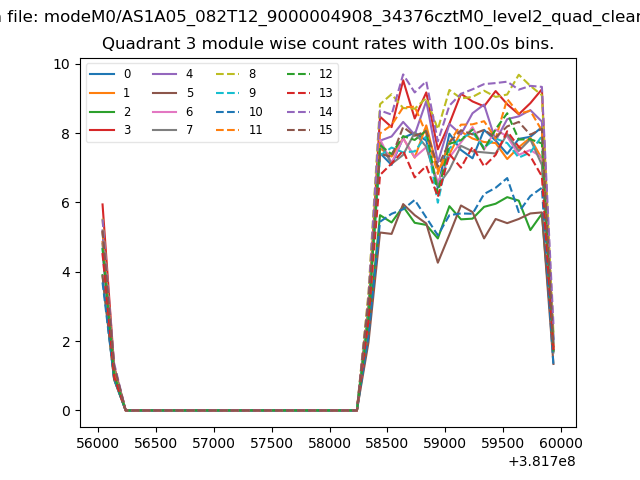
| Module-wise count rates for Quadrant A Data is divided into 100 sec bins |
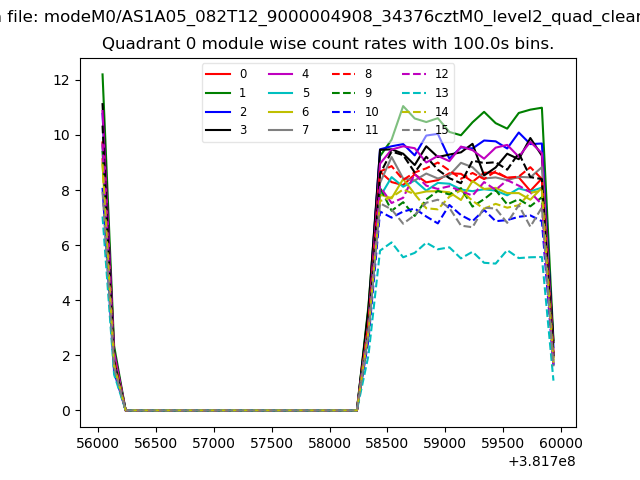 |
 |
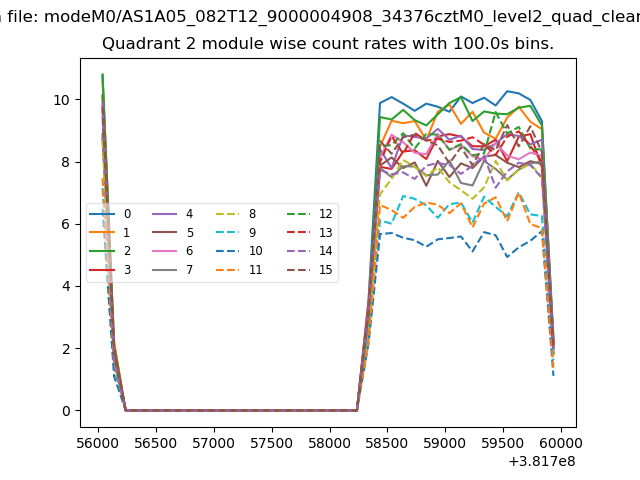
| Module-wise count rates for Quadrant B Data is divided into 100 sec bins |
 |
 |
| Module-wise count rates for Quadrant C Data is divided into 100 sec bins |
 |
 |
| Module-wise count rates for Quadrant D Data is divided into 100 sec bins |
 |
 |
| Parameter | Plot |
|---|---|
| CZT HV Monitor | 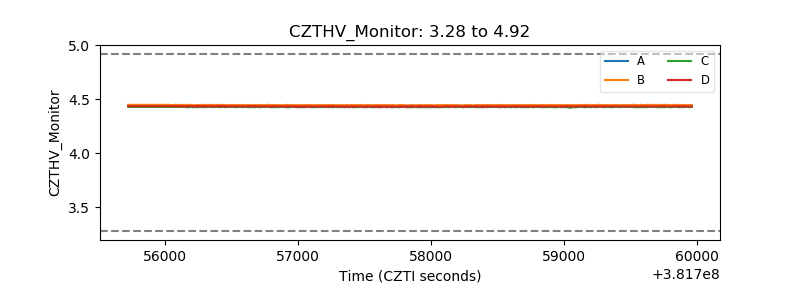 |
| D_VDD | 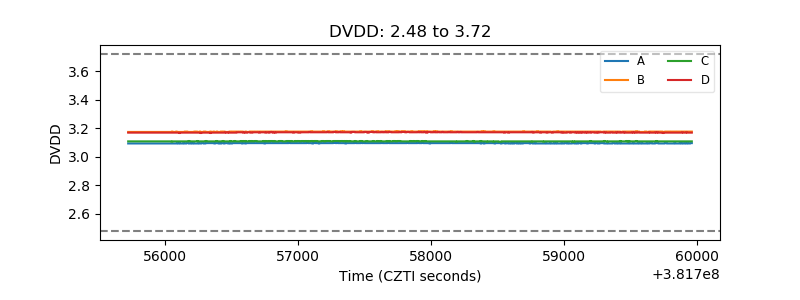 |
| Temperature 1 | 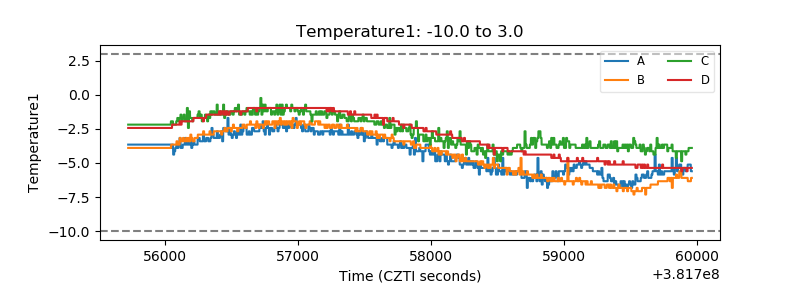 |
| Veto HV Monitor |  |
| Veto LLD | 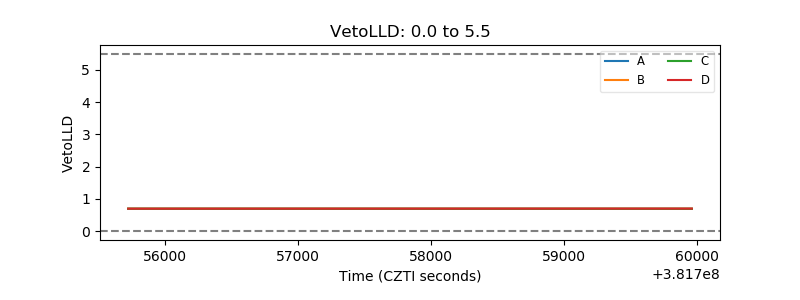 |
| Alpha Counter | 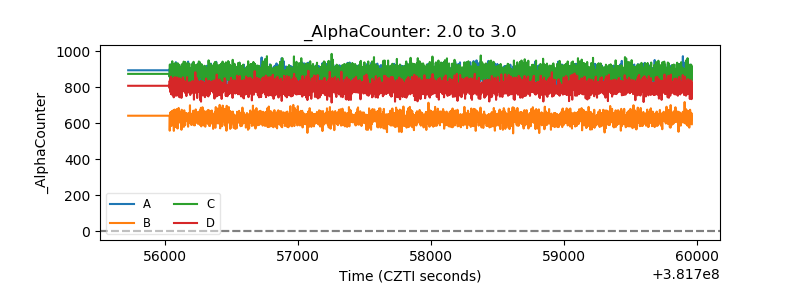 |
| _CPM_Rate | 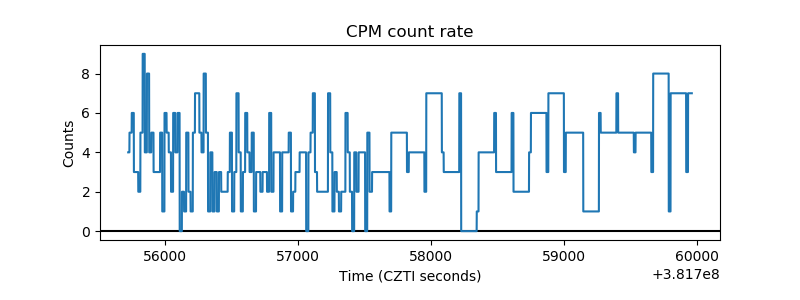 |
| CZT Counter | 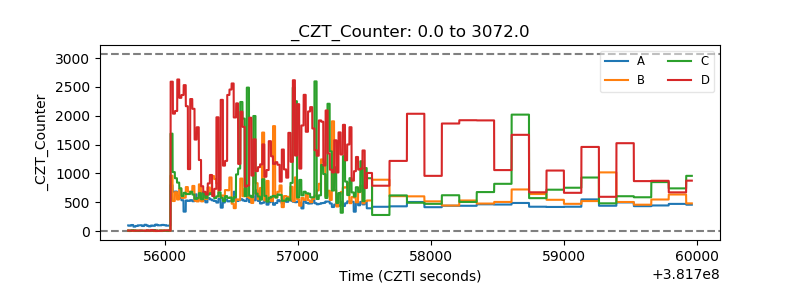 |
| +2.5 Volts monitor | 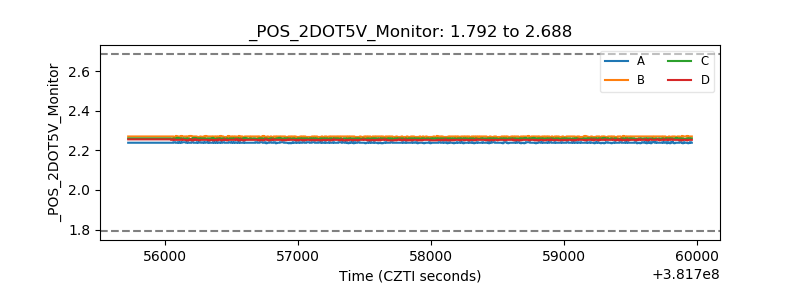 |
| +5 Volts monitor | 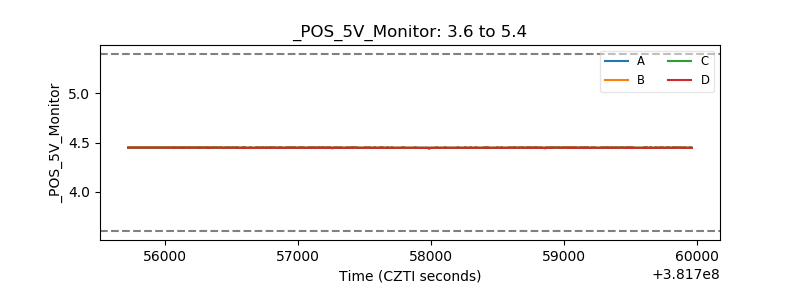 |
| _ROLL_ROT | 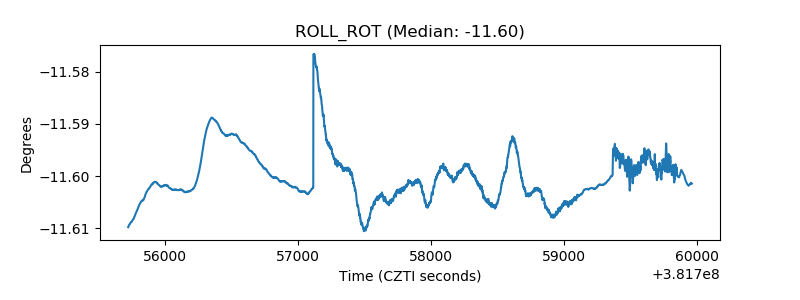 |
| _Roll_DEC | 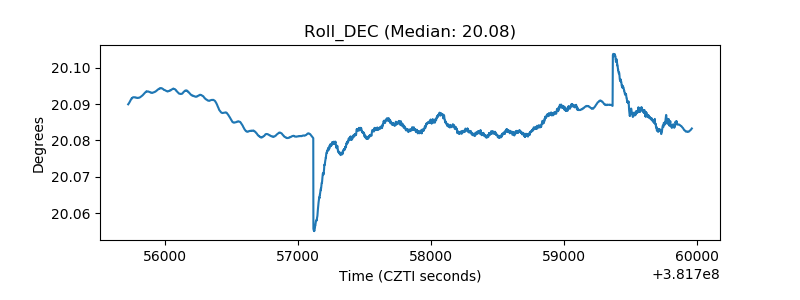 |
| _Roll_RA | 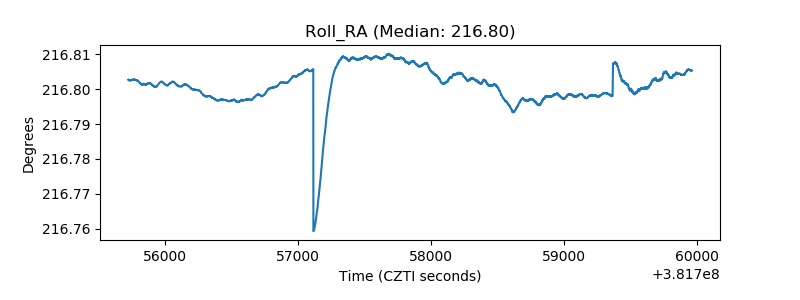 |
| Veto Counter | 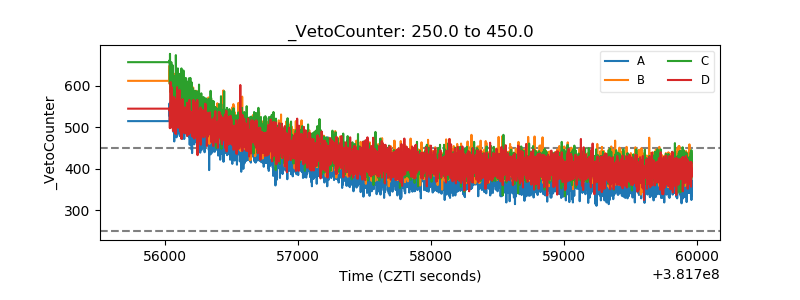 |