| Param | Original file | Final file |
|---|---|---|
| Filename | modeM0/AS1A05_082T12_9000004908_34374cztM0_level2.evt | modeM0/AS1A05_082T12_9000004908_34374cztM0_level2_quad_clean.evt |
| Size (bytes) | 566,256,960 | 53,349,120 |
| Size | 540.0 MB | 50.9 MB |
| Events in quadrant A | 2,657,035 | 323,280 |
| Events in quadrant B | 3,369,379 | 323,497 |
| Events in quadrant C | 3,434,480 | 317,978 |
| Events in quadrant D | 7,319,992 | 268,913 |
| Mode SS | |||
|---|---|---|---|
| Quadrant | BADHDUFLAG | Total packets | Discarded packets |
| A | 0 | 110 | 0 |
| B | 0 | 110 | 0 |
| C | 0 | 110 | 0 |
| D | 0 | 110 | 0 |
| Mode M0 | |||
|---|---|---|---|
| Quadrant | BADHDUFLAG | Total packets | Discarded packets |
| A | 0 | 11261 | 3 |
| B | 0 | 13440 | 2 |
| C | 0 | 13663 | 2 |
| D | 0 | 25552 | 2 |
| Mode M9 | |||
|---|---|---|---|
| Quadrant | BADHDUFLAG | Total packets | Discarded packets |
| A | 0 | 17 | 0 |
| B | 0 | 17 | 0 |
| C | 0 | 17 | 0 |
| D | 0 | 18 | 0 |
| Quadrant | Total seconds | Saturated seconds | Saturation percentage |
|---|---|---|---|
| A | 5446 | 16 | 0.293794% |
| B | 5446 | 118 | 2.166728% |
| C | 5446 | 58 | 1.065002% |
| D | 5446 | 1168 | 21.446934% |
Noise dominated data is calculated using 1-second bins in cleaned event files. If a bin has >2000 counts, and if more than 50% of those come from <1% of pixels, then it is considered to be noise-dominated and hence unusable.
| Quadrant | # 1 sec bins | Bins with >0 counts | Bins with >2000 counts | High rate bins dominated by noise | Noise dominated (total time) | Noise dominated (detector-on time) | Marked lightcurve |
|---|---|---|---|---|---|---|---|
| A | 7120 | 5447 | 6 | 6 | 0.08% | 0.11% | 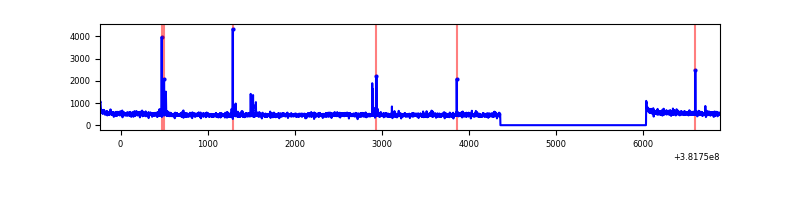 |
| B | 7120 | 5447 | 74 | 74 | 1.04% | 1.36% | 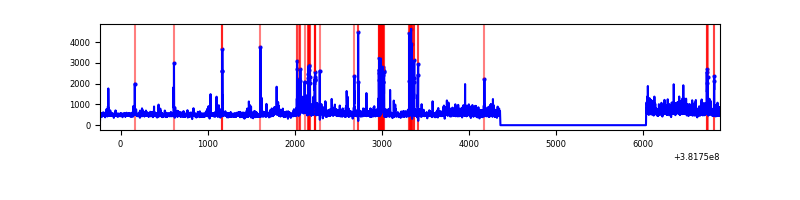 |
| C | 7120 | 5447 | 45 | 45 | 0.63% | 0.83% | 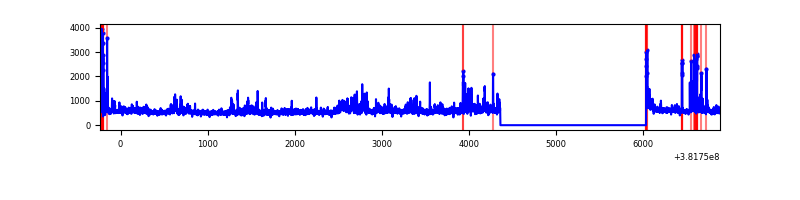 |
| D | 7120 | 5447 | 1052 | 1052 | 14.78% | 19.31% | 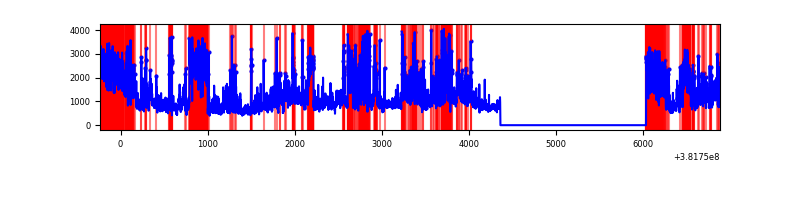 |
Top three noisy pixels from each quadrant. If the there are fewer than three noisy pixels in the level2.evt file, extra rows are filled as -1
| Pixel properties | Quadrant properties | ||||||
|---|---|---|---|---|---|---|---|
| Quadrant | DetID | PixID | Counts | Sigma | Mean | Median | Sigma |
| A | 9 | 143 | 51383 | 383.88 | 661 | 649 | 132.2 |
| A | 10 | 83 | 32607 | 241.81 | 661 | 649 | 132.2 |
| A | 13 | 6 | 16147 | 117.27 | 661 | 649 | 132.2 |
| B | 5 | 172 | 369858 | 2940.02 | 649 | 633 | 125.6 |
| B | 4 | 251 | 302235 | 2401.56 | 649 | 633 | 125.6 |
| B | 0 | 190 | 64991 | 512.46 | 649 | 633 | 125.6 |
| C | 4 | 254 | 532037 | 3575.69 | 638 | 642 | 148.6 |
| C | 15 | 214 | 229426 | 1539.46 | 638 | 642 | 148.6 |
| C | 0 | 10 | 106528 | 712.49 | 638 | 642 | 148.6 |
| D | 7 | 223 | 1454012 | 9878.79 | 595 | 577 | 147.1 |
| D | 12 | 235 | 1299574 | 8829.09 | 595 | 577 | 147.1 |
| D | 8 | 195 | 1085798 | 7376.09 | 595 | 577 | 147.1 |
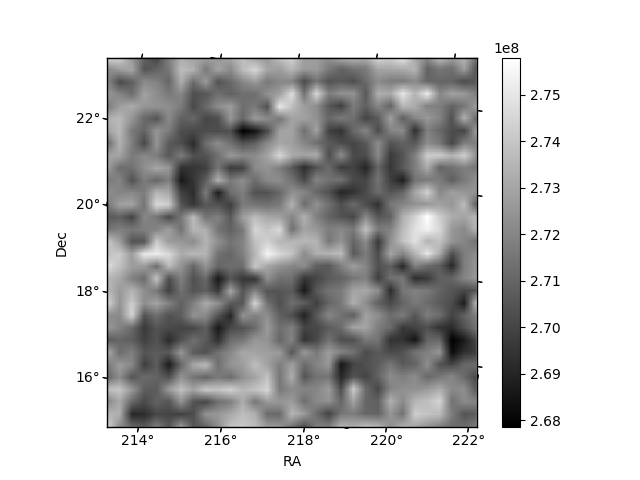
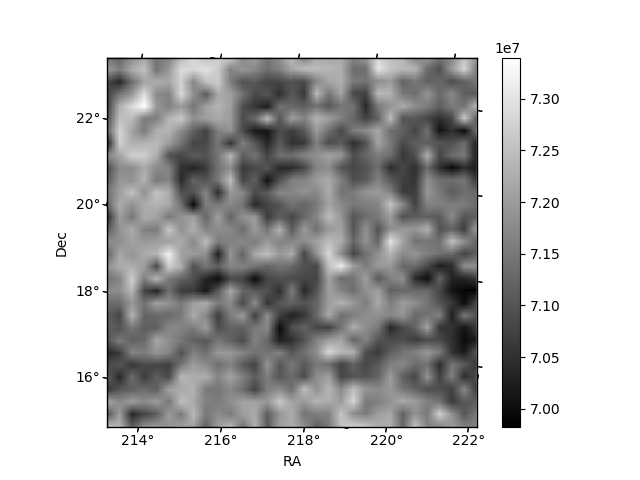
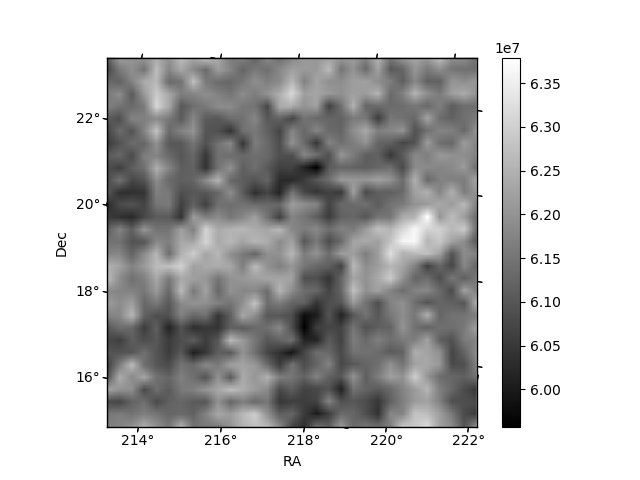
Histogram calculated using DETX and DETY for each event in the final _common_clean file
| Quadrant A | 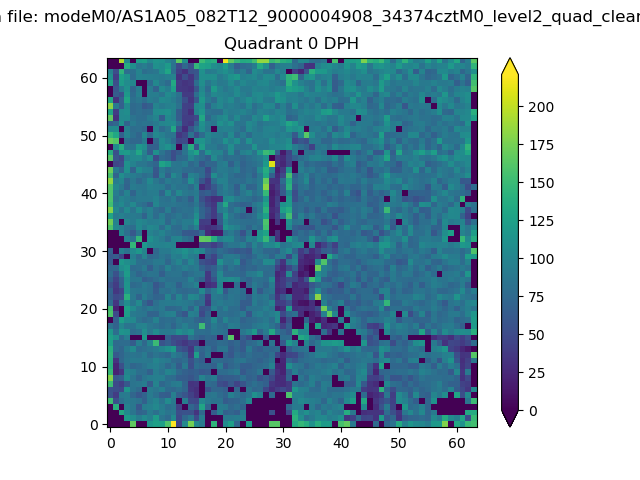 |
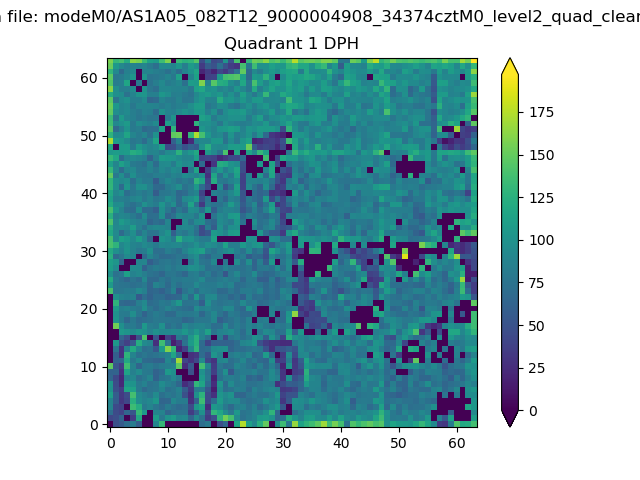 |
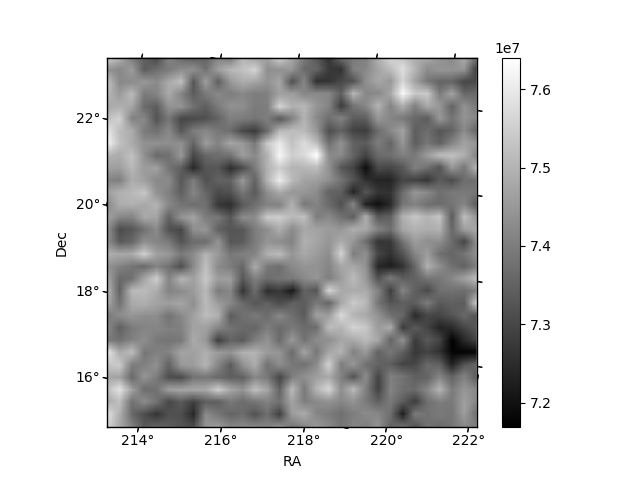
Quadrant B |
|---|---|---|---|
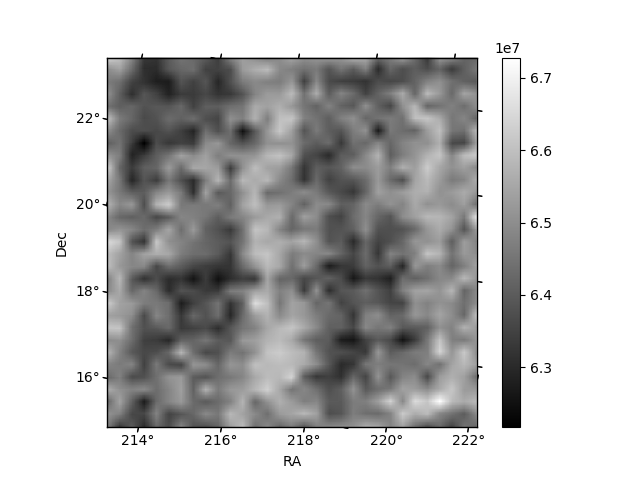
| Quadrant D | 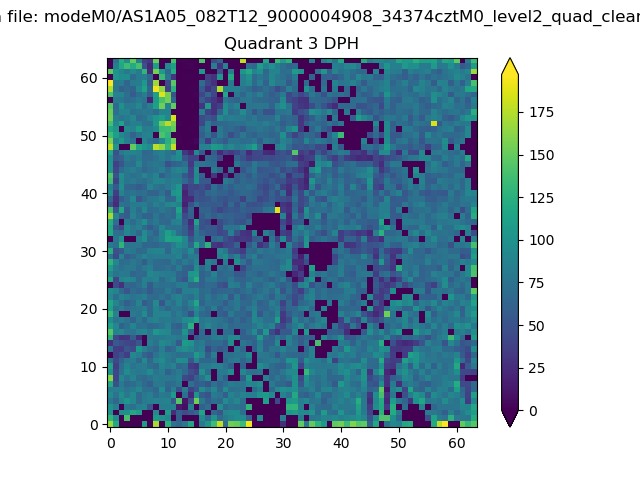 |
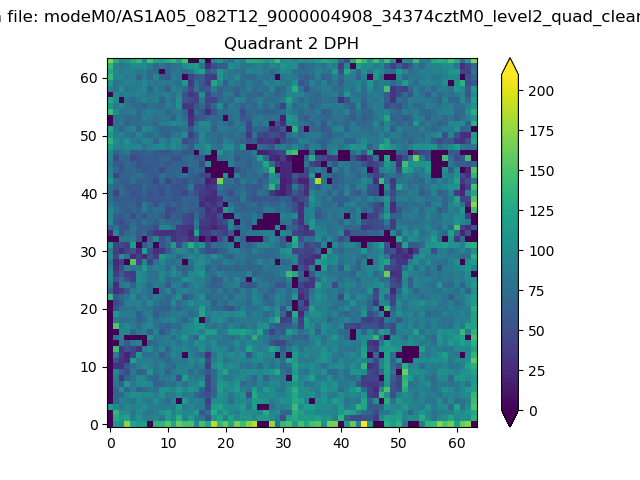 |
Quadrant C |
| Plot type | Count rate plots | Images |
|---|---|---|
| Comparison with Poisson distribution Blue bars denote a histogram of data divided into 1 sec bins. Red curve is a Poisson curve with rate = median count rate of data. |
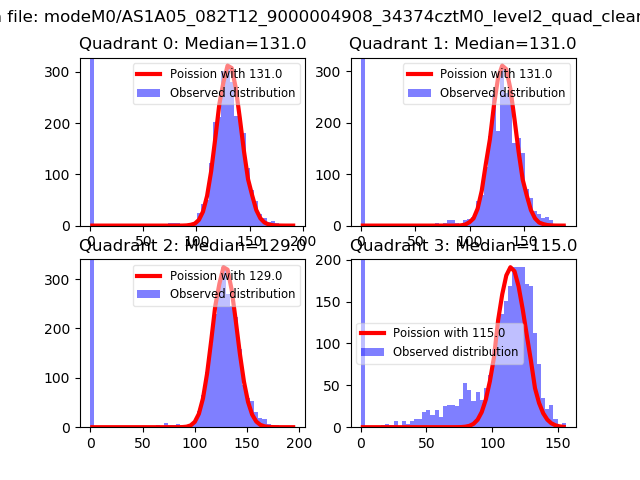 |
 |
| Quadrant-wise count rates Data is divided into 100 sec bins |
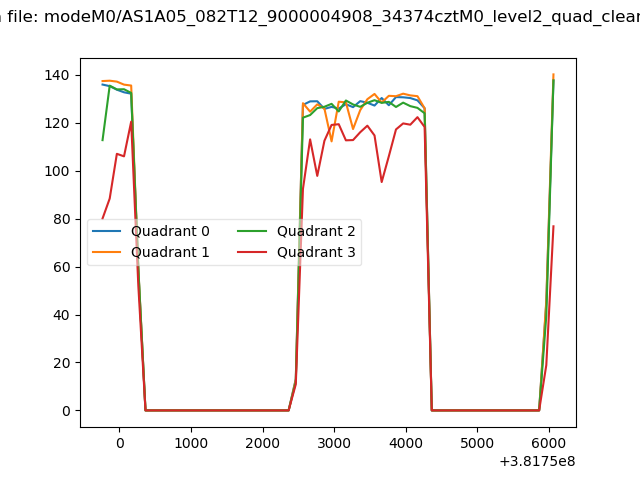 |
|
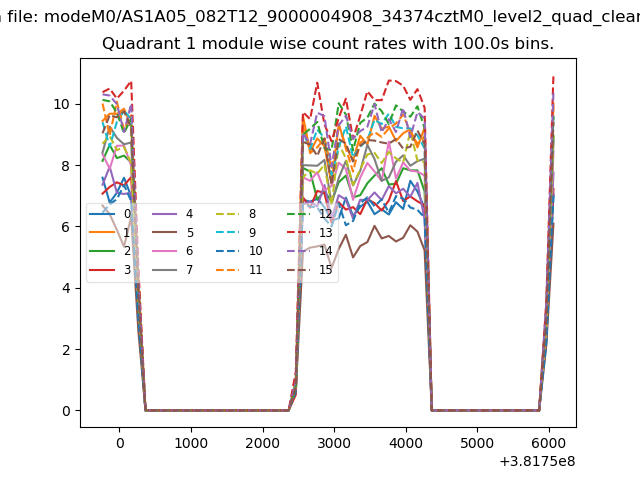
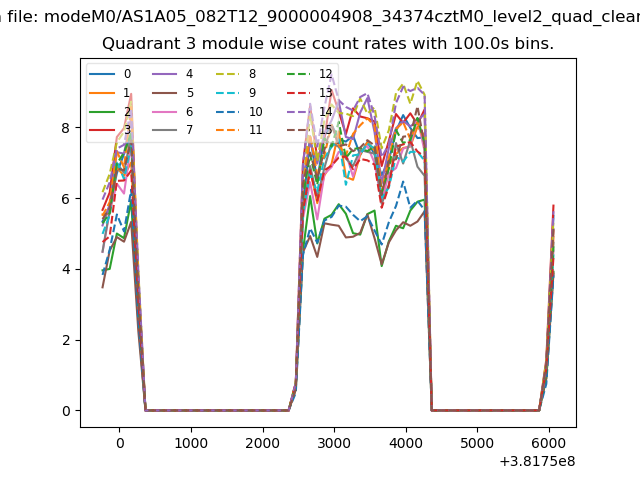
| Module-wise count rates for Quadrant A Data is divided into 100 sec bins |
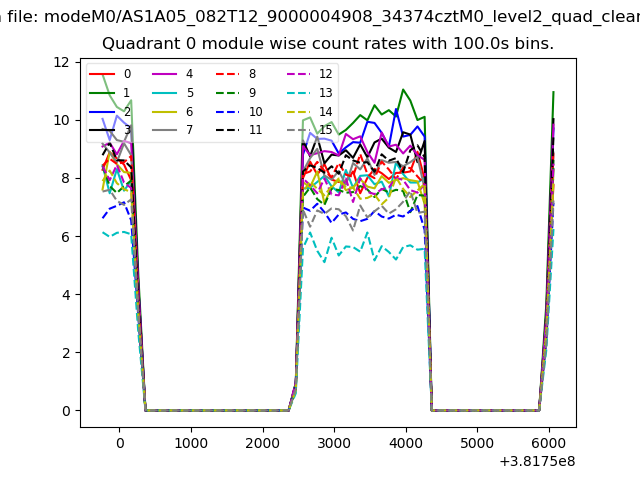 |
 |
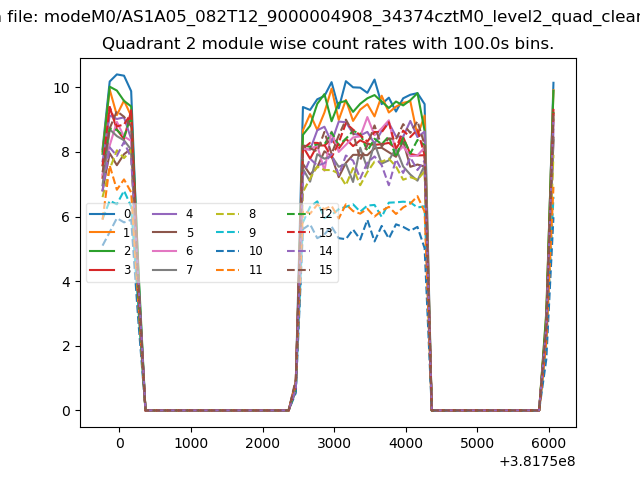
| Module-wise count rates for Quadrant B Data is divided into 100 sec bins |
 |
 |
| Module-wise count rates for Quadrant C Data is divided into 100 sec bins |
 |
 |
| Module-wise count rates for Quadrant D Data is divided into 100 sec bins |
 |
 |
| Parameter | Plot |
|---|---|
| CZT HV Monitor | 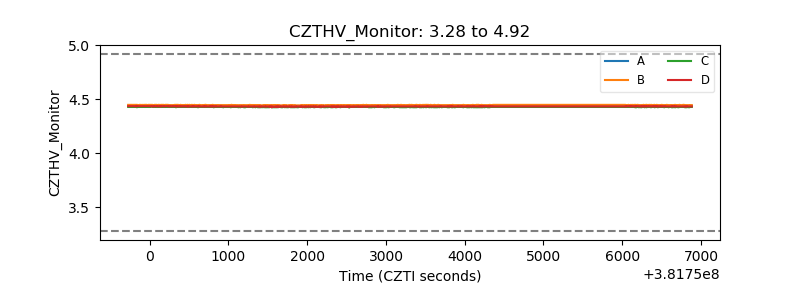 |
| D_VDD | 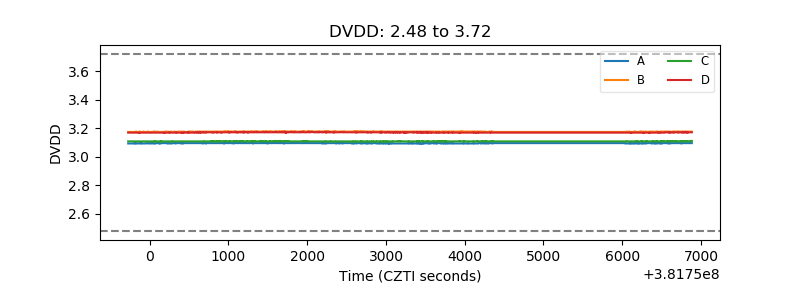 |
| Temperature 1 | 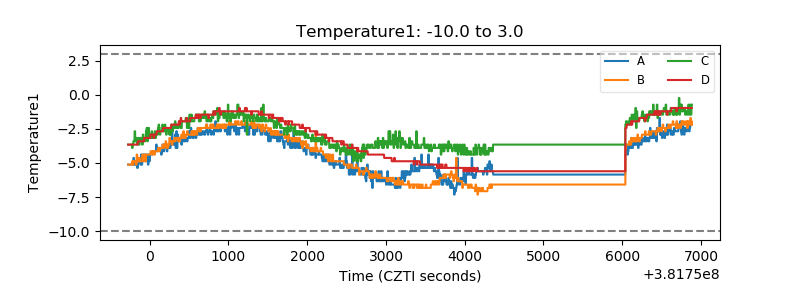 |
| Veto HV Monitor | 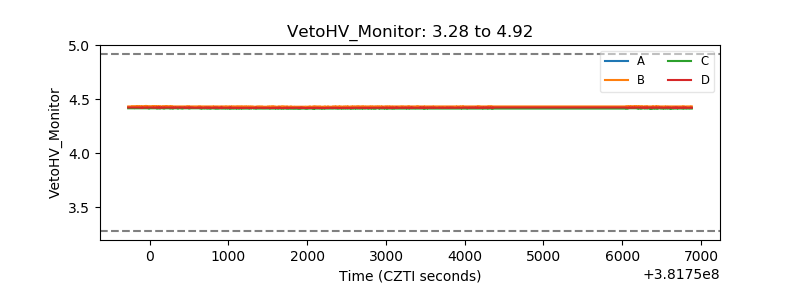 |
| Veto LLD | 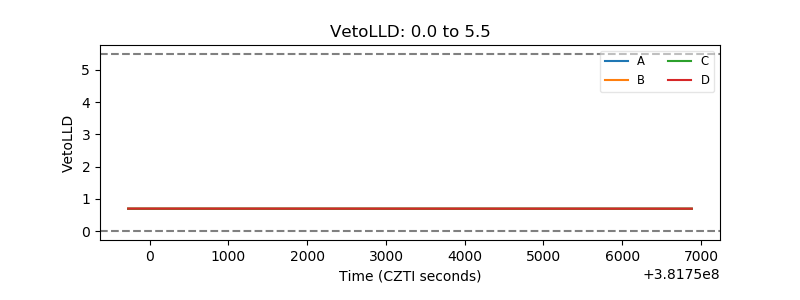 |
| Alpha Counter | 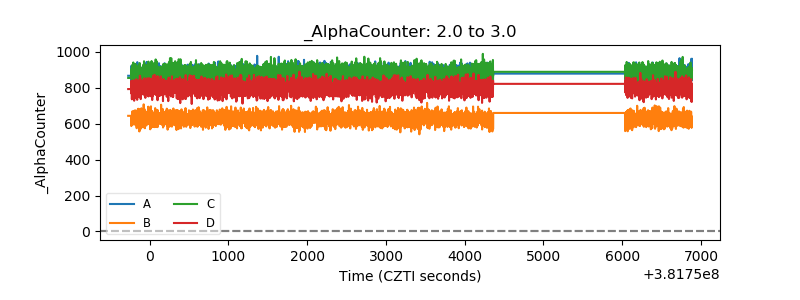 |
| _CPM_Rate | 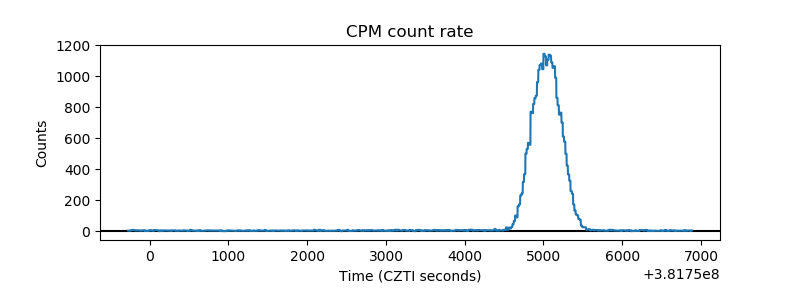 |
| CZT Counter | 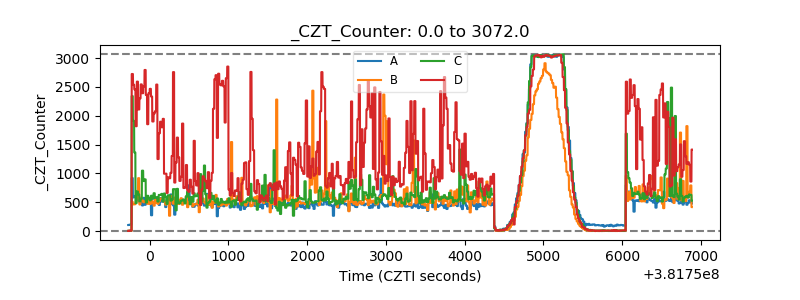 |
| +2.5 Volts monitor | 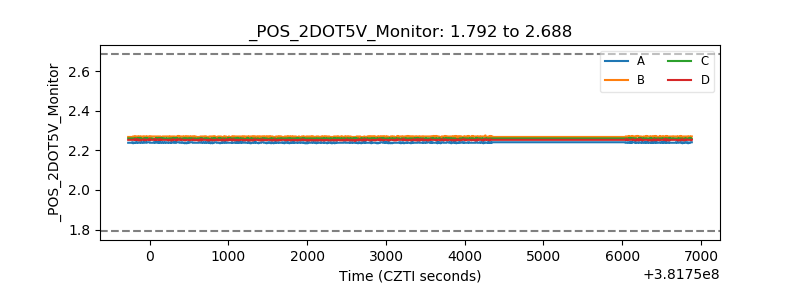 |
| +5 Volts monitor | 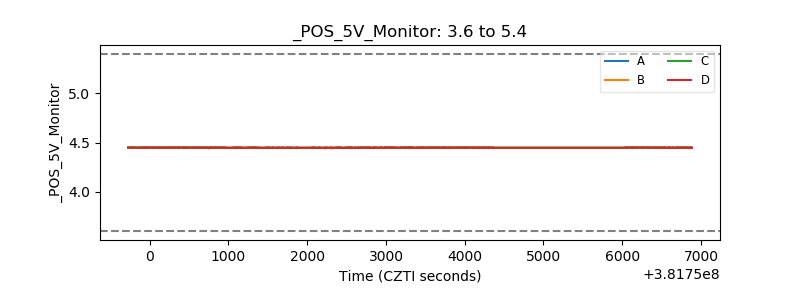 |
| _ROLL_ROT | 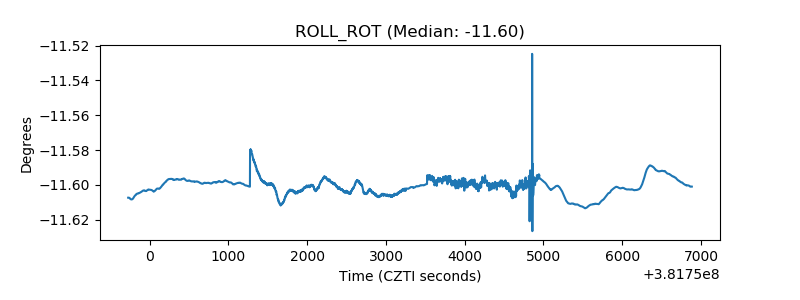 |
| _Roll_DEC | 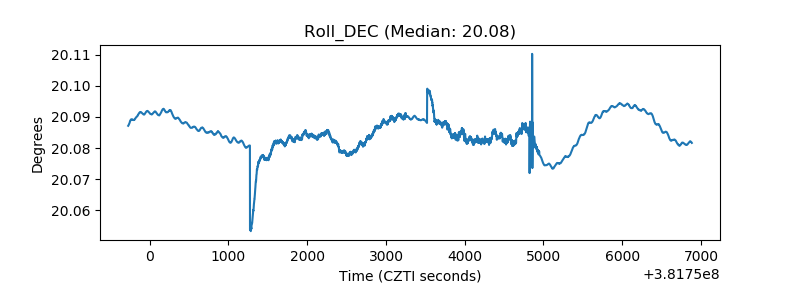 |
| _Roll_RA | 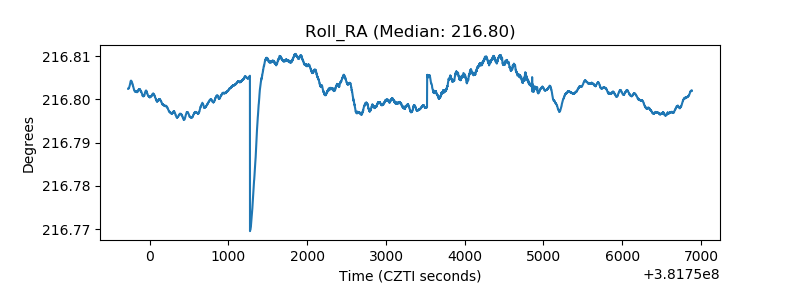 |
| Veto Counter | 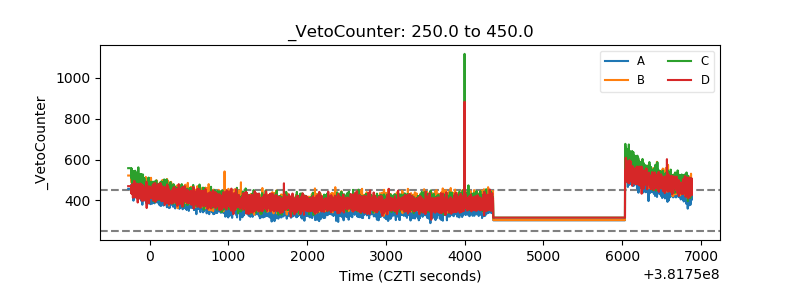 |