| Param | Original file | Final file |
|---|---|---|
| Filename | modeM0/AS1A05_082T12_9000004908_34373cztM0_level2.evt | modeM0/AS1A05_082T12_9000004908_34373cztM0_level2_quad_clean.evt |
| Size (bytes) | 747,570,240 | 75,378,240 |
| Size | 712.9 MB | 71.9 MB |
| Events in quadrant A | 3,076,307 | 487,638 |
| Events in quadrant B | 3,739,060 | 494,343 |
| Events in quadrant C | 4,883,872 | 479,422 |
| Events in quadrant D | 10,506,912 | 371,862 |
| Mode SS | |||
|---|---|---|---|
| Quadrant | BADHDUFLAG | Total packets | Discarded packets |
| A | 0 | 132 | 0 |
| B | 0 | 132 | 0 |
| C | 0 | 132 | 0 |
| D | 0 | 132 | 0 |
| Mode M0 | |||
|---|---|---|---|
| Quadrant | BADHDUFLAG | Total packets | Discarded packets |
| A | 0 | 13134 | 3 |
| B | 0 | 15018 | 2 |
| C | 0 | 18839 | 2 |
| D | 0 | 35733 | 2 |
| Mode M9 | |||
|---|---|---|---|
| Quadrant | BADHDUFLAG | Total packets | Discarded packets |
| A | 0 | 30 | 0 |
| B | 0 | 30 | 0 |
| C | 0 | 30 | 0 |
| D | 0 | 30 | 0 |
| Quadrant | Total seconds | Saturated seconds | Saturation percentage |
|---|---|---|---|
| A | 6432 | 6 | 0.093284% |
| B | 6432 | 127 | 1.974502% |
| C | 6432 | 147 | 2.285448% |
| D | 6432 | 2340 | 36.380597% |
Noise dominated data is calculated using 1-second bins in cleaned event files. If a bin has >2000 counts, and if more than 50% of those come from <1% of pixels, then it is considered to be noise-dominated and hence unusable.
| Quadrant | # 1 sec bins | Bins with >0 counts | Bins with >2000 counts | High rate bins dominated by noise | Noise dominated (total time) | Noise dominated (detector-on time) | Marked lightcurve |
|---|---|---|---|---|---|---|---|
| A | 9418 | 6434 | 3 | 3 | 0.03% | 0.05% | 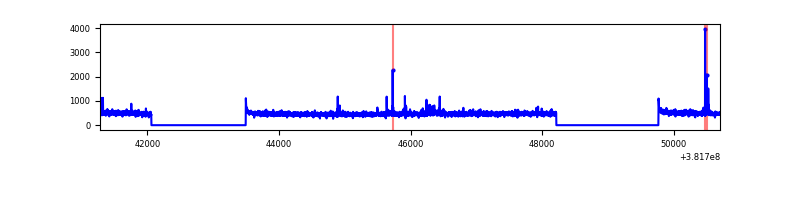 |
| B | 9418 | 6434 | 83 | 83 | 0.88% | 1.29% | 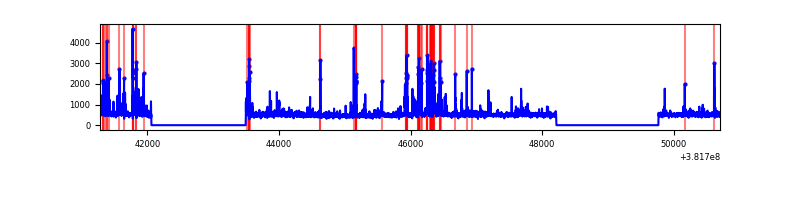 |
| C | 9418 | 6434 | 128 | 128 | 1.36% | 1.99% | 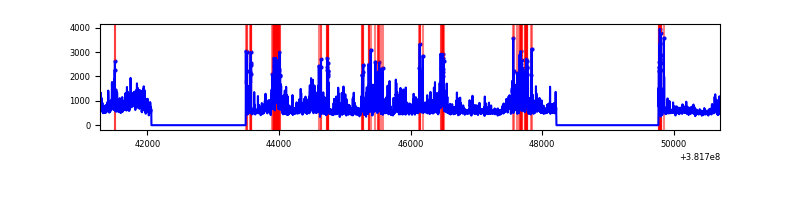 |
| D | 9418 | 6434 | 2217 | 2217 | 23.54% | 34.46% | 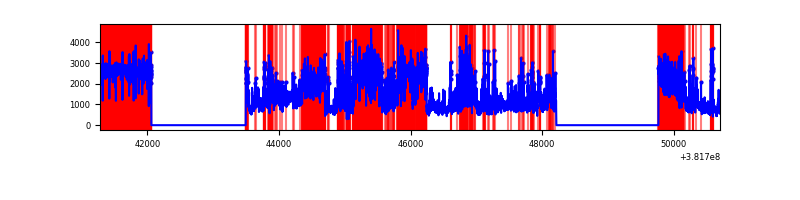 |
Top three noisy pixels from each quadrant. If the there are fewer than three noisy pixels in the level2.evt file, extra rows are filled as -1
| Pixel properties | Quadrant properties | ||||||
|---|---|---|---|---|---|---|---|
| Quadrant | DetID | PixID | Counts | Sigma | Mean | Median | Sigma |
| A | 9 | 143 | 53627 | 336.74 | 770 | 753 | 157.0 |
| A | 10 | 83 | 34003 | 211.76 | 770 | 753 | 157.0 |
| A | 13 | 6 | 14609 | 88.24 | 770 | 753 | 157.0 |
| B | 5 | 172 | 471089 | 3182.25 | 760 | 740 | 147.8 |
| B | 4 | 171 | 115679 | 777.64 | 760 | 740 | 147.8 |
| B | 4 | 251 | 87916 | 589.81 | 760 | 740 | 147.8 |
| C | 4 | 254 | 1519939 | 8626.56 | 743 | 749 | 176.1 |
| C | 15 | 214 | 268388 | 1519.76 | 743 | 749 | 176.1 |
| C | 0 | 10 | 115284 | 650.37 | 743 | 749 | 176.1 |
| D | 7 | 223 | 4604473 | 29552.39 | 627 | 609 | 155.8 |
| D | 12 | 235 | 1790710 | 11490.73 | 627 | 609 | 155.8 |
| D | 8 | 195 | 945841 | 6067.48 | 627 | 609 | 155.8 |
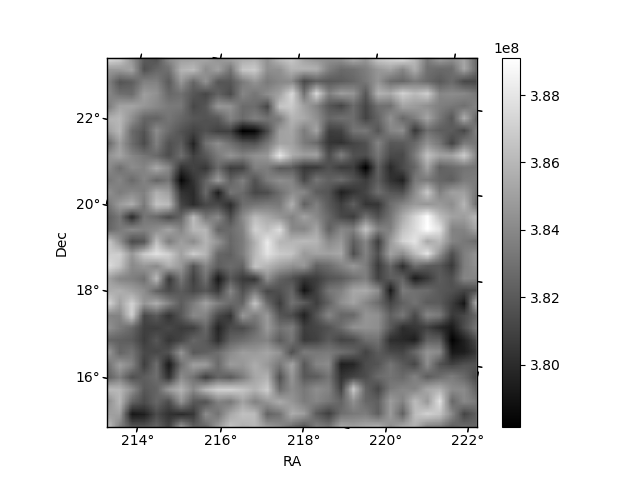
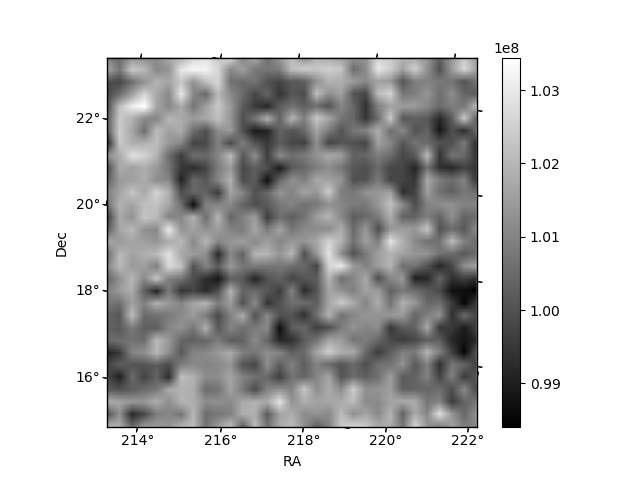
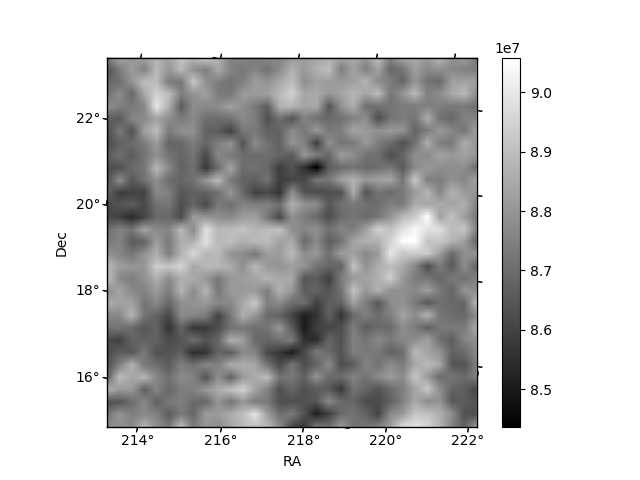
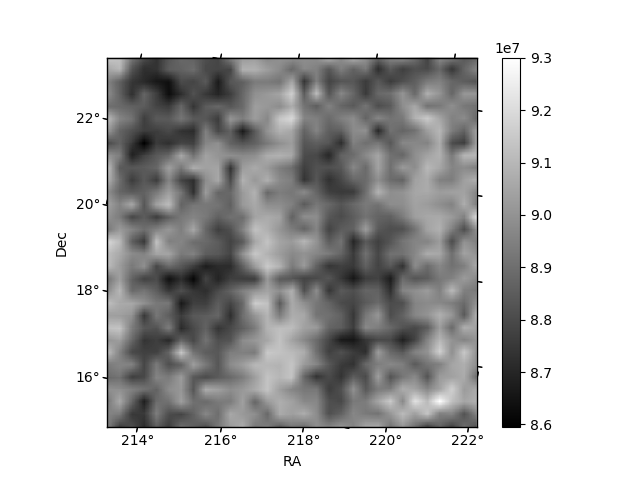
Histogram calculated using DETX and DETY for each event in the final _common_clean file
| Quadrant A | 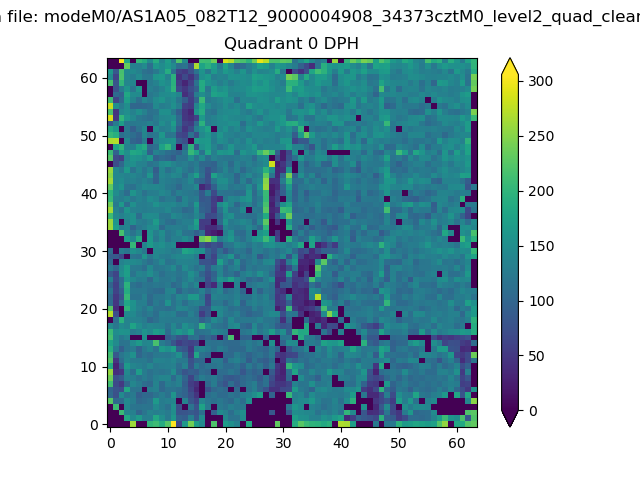 |
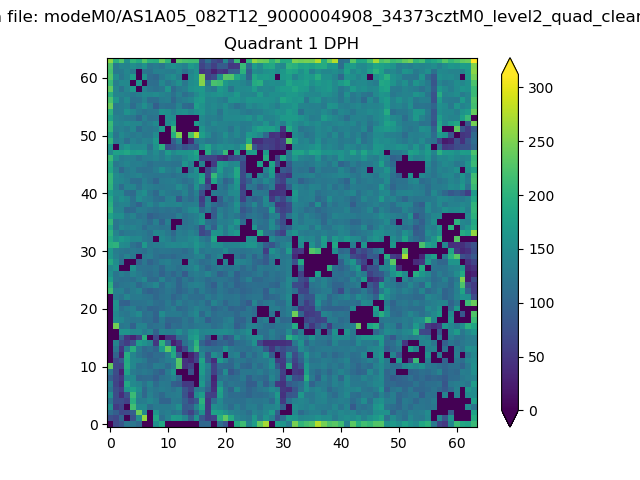 |
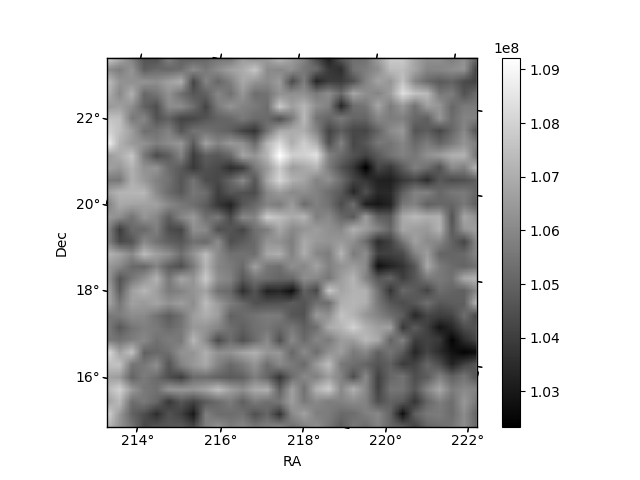
Quadrant B |
|---|---|---|---|
| Quadrant D | 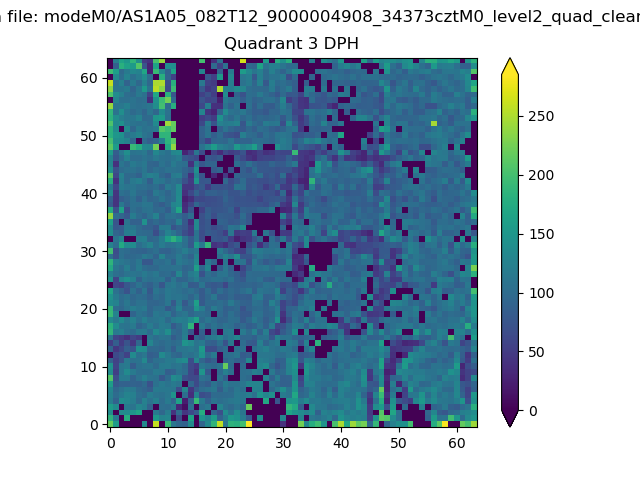 |
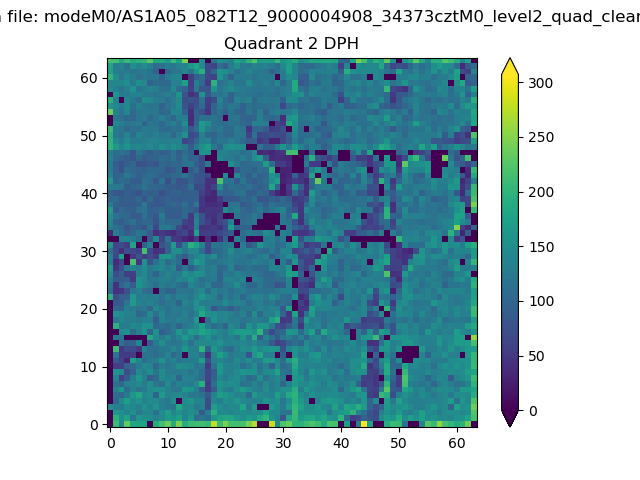 |
Quadrant C |
| Plot type | Count rate plots | Images |
|---|---|---|
| Comparison with Poisson distribution Blue bars denote a histogram of data divided into 1 sec bins. Red curve is a Poisson curve with rate = median count rate of data. |
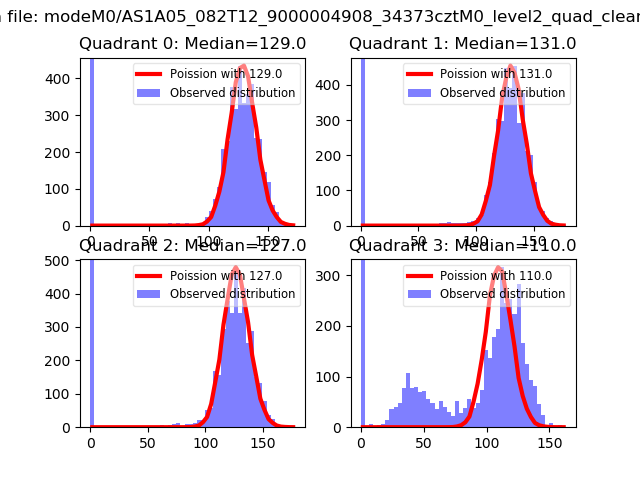 |
 |
| Quadrant-wise count rates Data is divided into 100 sec bins |
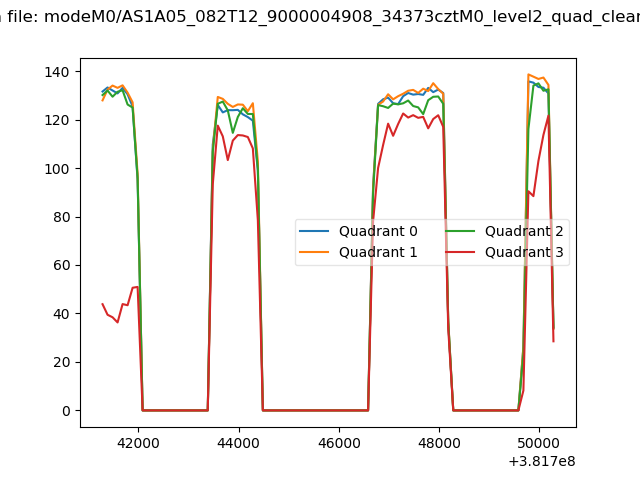 |
|
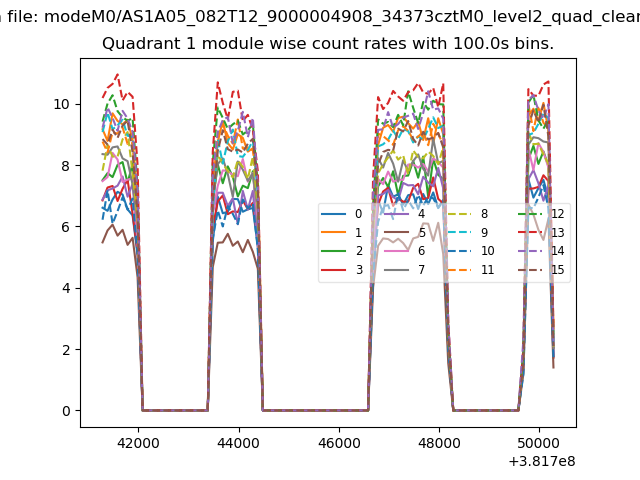
| Module-wise count rates for Quadrant A Data is divided into 100 sec bins |
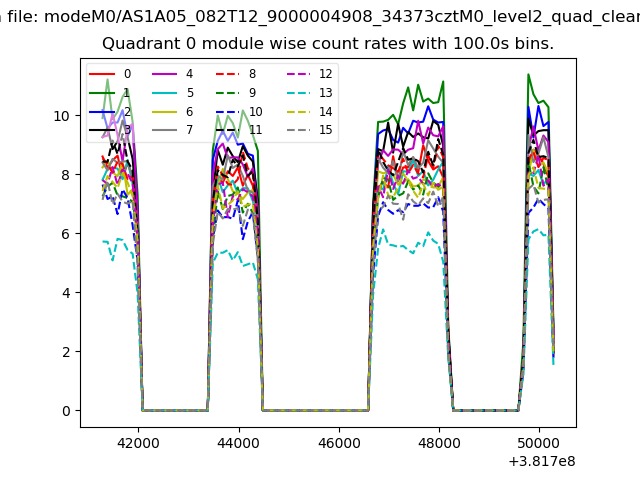 |
 |
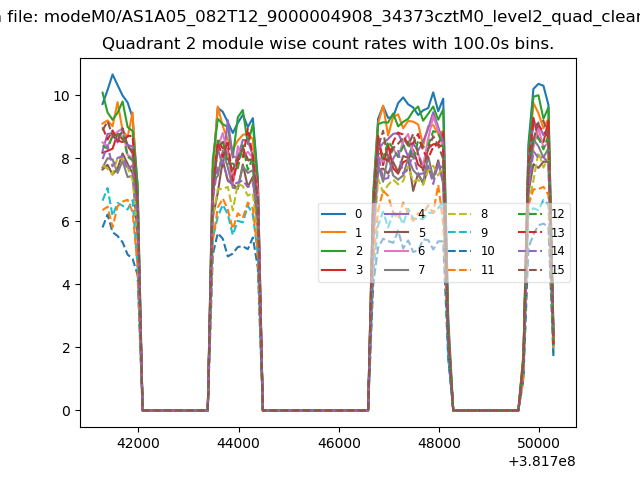
| Module-wise count rates for Quadrant B Data is divided into 100 sec bins |
 |
 |
| Module-wise count rates for Quadrant C Data is divided into 100 sec bins |
 |
 |
| Module-wise count rates for Quadrant D Data is divided into 100 sec bins |
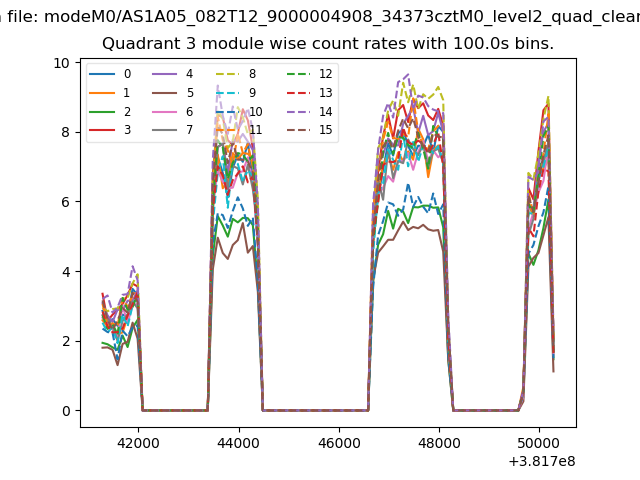 |
 |
| Parameter | Plot |
|---|---|
| CZT HV Monitor | 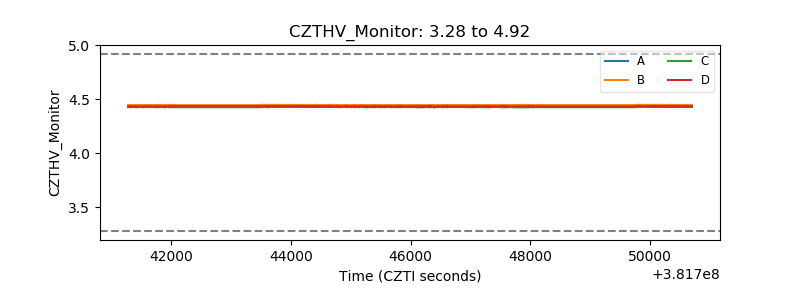 |
| D_VDD | 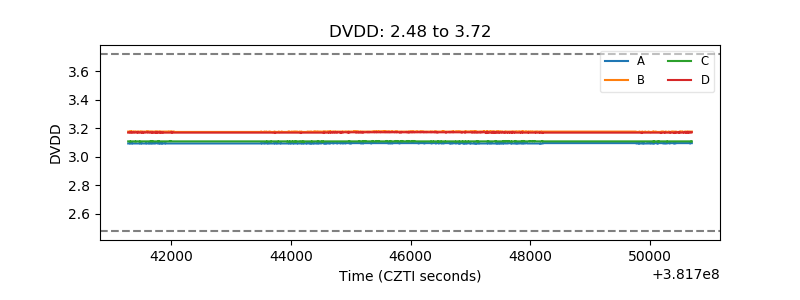 |
| Temperature 1 | 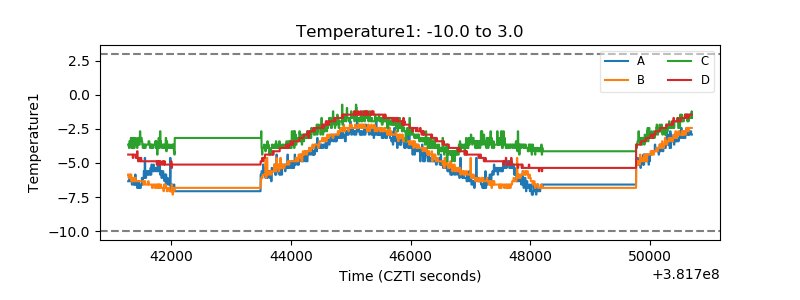 |
| Veto HV Monitor |  |
| Veto LLD | 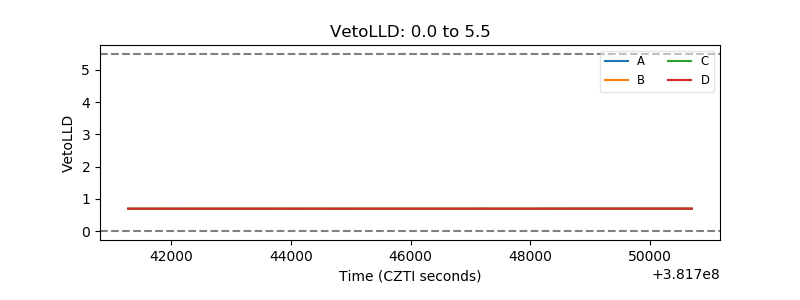 |
| Alpha Counter | 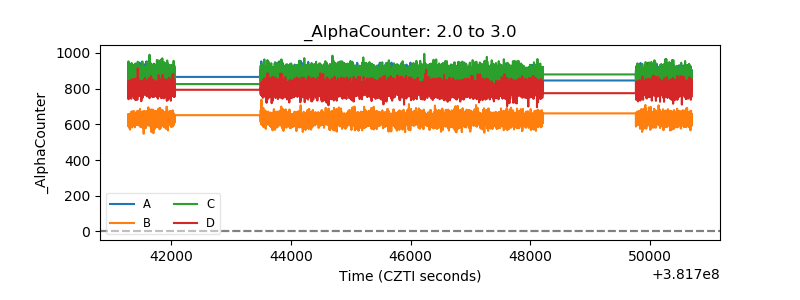 |
| _CPM_Rate | 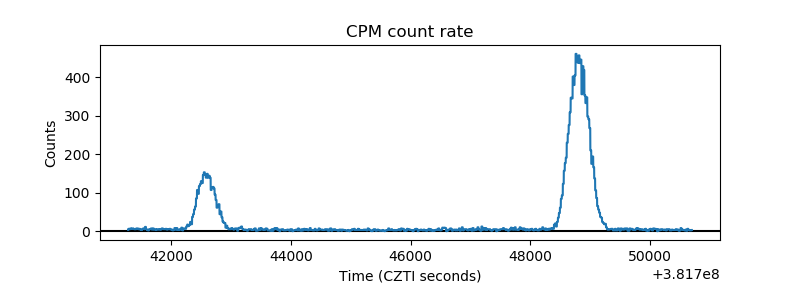 |
| CZT Counter | 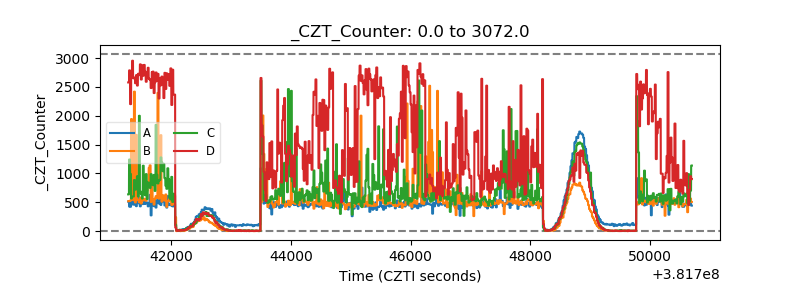 |
| +2.5 Volts monitor | 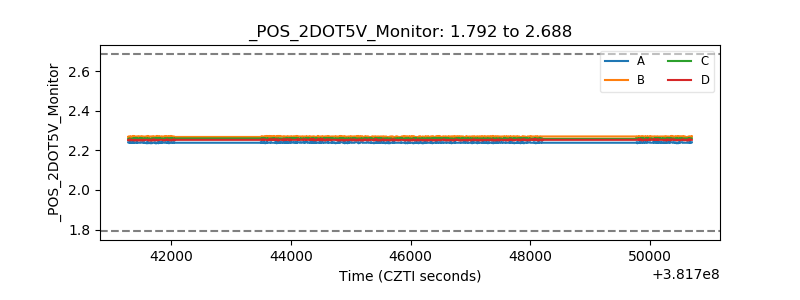 |
| +5 Volts monitor | 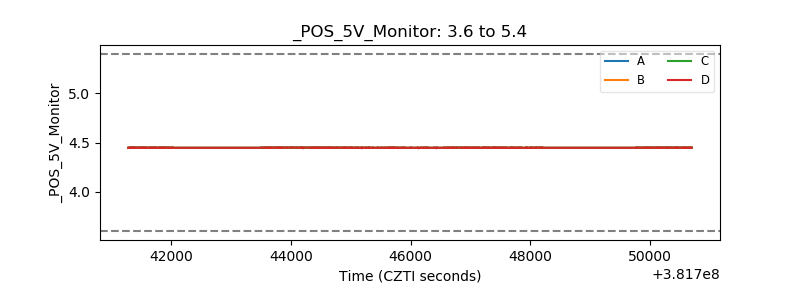 |
| _ROLL_ROT | 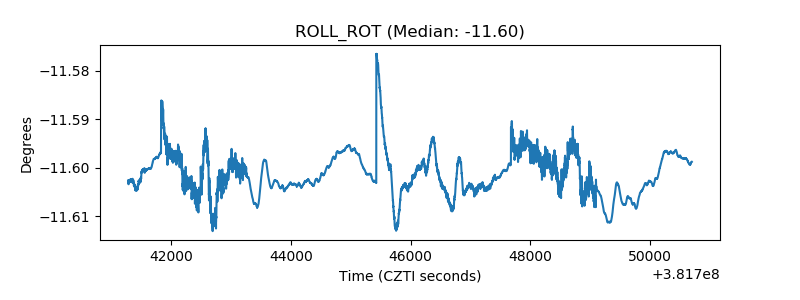 |
| _Roll_DEC | 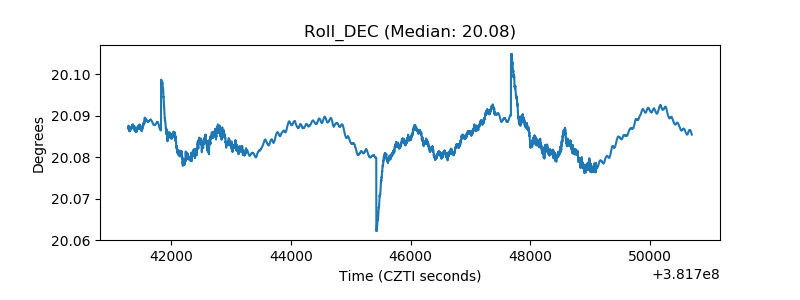 |
| _Roll_RA | 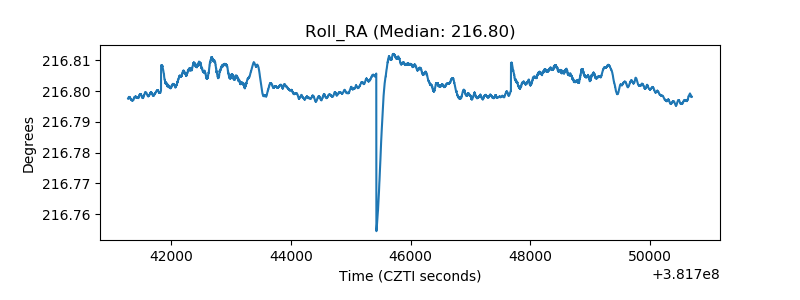 |
| Veto Counter | 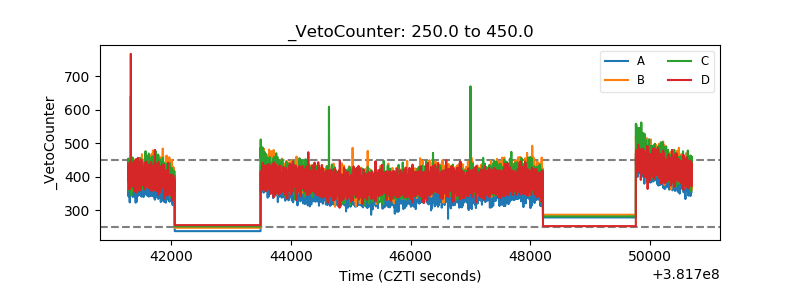 |