| Param | Original file | Final file |
|---|---|---|
| Filename | modeM0/AS1A11_047T01_9000004904_34348cztM0_level2.evt | modeM0/AS1A11_047T01_9000004904_34348cztM0_level2_quad_clean.evt |
| Size (bytes) | 235,851,840 | 34,104,960 |
| Size | 224.9 MB | 32.5 MB |
| Events in quadrant A | 983,323 | 255,950 |
| Events in quadrant B | 1,201,483 | 255,025 |
| Events in quadrant C | 1,164,727 | 248,621 |
| Events in quadrant D | 3,664,402 | 135,901 |
| Mode SS | |||
|---|---|---|---|
| Quadrant | BADHDUFLAG | Total packets | Discarded packets |
| A | 0 | 38 | 0 |
| B | 0 | 38 | 0 |
| C | 0 | 38 | 0 |
| D | 0 | 38 | 0 |
| Mode M0 | |||
|---|---|---|---|
| Quadrant | BADHDUFLAG | Total packets | Discarded packets |
| A | 0 | 4059 | 1 |
| B | 0 | 4777 | 1 |
| C | 0 | 4636 | 1 |
| D | 0 | 12170 | 1 |
| Mode M9 | |||
|---|---|---|---|
| Quadrant | BADHDUFLAG | Total packets | Discarded packets |
| A | 0 | 19 | 0 |
| B | 0 | 19 | 0 |
| C | 0 | 19 | 0 |
| D | 0 | 19 | 0 |
| Quadrant | Total seconds | Saturated seconds | Saturation percentage |
|---|---|---|---|
| A | 1874 | 5 | 0.266809% |
| B | 1874 | 60 | 3.201708% |
| C | 1874 | 35 | 1.867663% |
| D | 1874 | 1121 | 59.818570% |
Noise dominated data is calculated using 1-second bins in cleaned event files. If a bin has >2000 counts, and if more than 50% of those come from <1% of pixels, then it is considered to be noise-dominated and hence unusable.
| Quadrant | # 1 sec bins | Bins with >0 counts | Bins with >2000 counts | High rate bins dominated by noise | Noise dominated (total time) | Noise dominated (detector-on time) | Marked lightcurve |
|---|---|---|---|---|---|---|---|
| A | 3697 | 1875 | 0 | 0 | 0.00% | 0.00% | 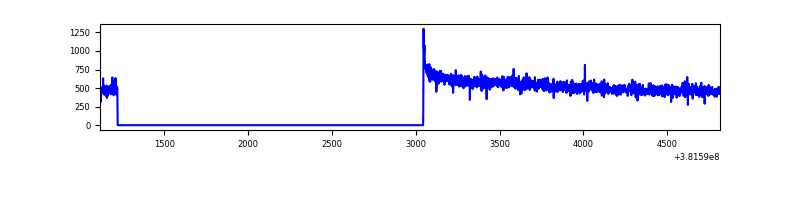 |
| B | 3697 | 1875 | 28 | 28 | 0.76% | 1.49% | 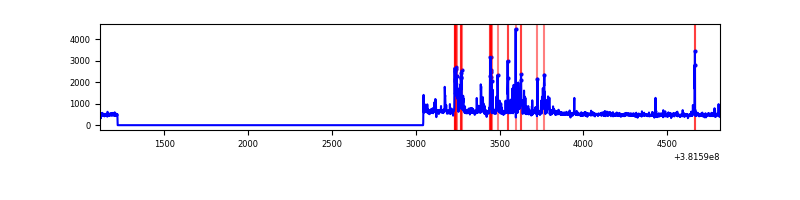 |
| C | 3697 | 1875 | 20 | 20 | 0.54% | 1.07% | 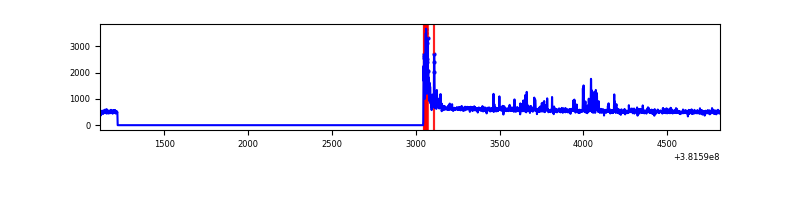 |
| D | 3696 | 1874 | 1043 | 1043 | 28.22% | 55.66% | 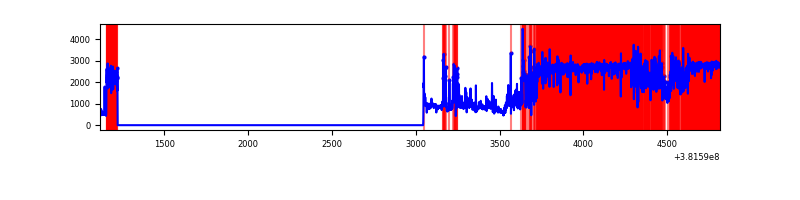 |
Top three noisy pixels from each quadrant. If the there are fewer than three noisy pixels in the level2.evt file, extra rows are filled as -1
| Pixel properties | Quadrant properties | ||||||
|---|---|---|---|---|---|---|---|
| Quadrant | DetID | PixID | Counts | Sigma | Mean | Median | Sigma |
| A | 10 | 83 | 14992 | 290.65 | 249 | 245 | 50.7 |
| A | 13 | 6 | 3953 | 73.08 | 249 | 245 | 50.7 |
| A | 13 | 254 | 3106 | 56.39 | 249 | 245 | 50.7 |
| B | 5 | 172 | 196323 | 4146.61 | 241 | 236 | 47.3 |
| B | 4 | 251 | 23775 | 497.77 | 241 | 236 | 47.3 |
| B | 5 | 200 | 12545 | 260.3 | 241 | 236 | 47.3 |
| C | 0 | 10 | 121796 | 2168.19 | 239 | 242 | 56.1 |
| C | 15 | 214 | 81307 | 1445.98 | 239 | 242 | 56.1 |
| C | 3 | 233 | 11424 | 199.46 | 239 | 242 | 56.1 |
| D | 7 | 223 | 1327668 | 31680.79 | 164 | 159 | 41.9 |
| D | 10 | 118 | 1148297 | 27400.13 | 164 | 159 | 41.9 |
| D | 8 | 195 | 172034 | 4101.77 | 164 | 159 | 41.9 |
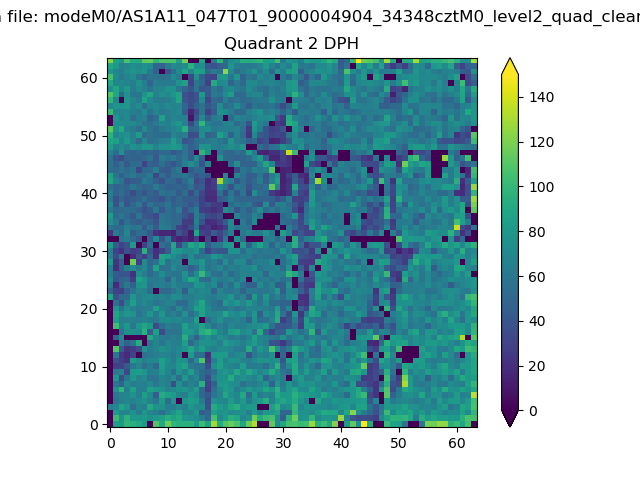
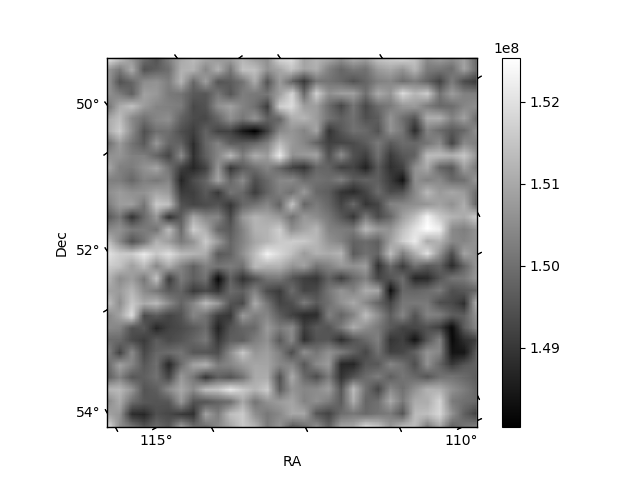
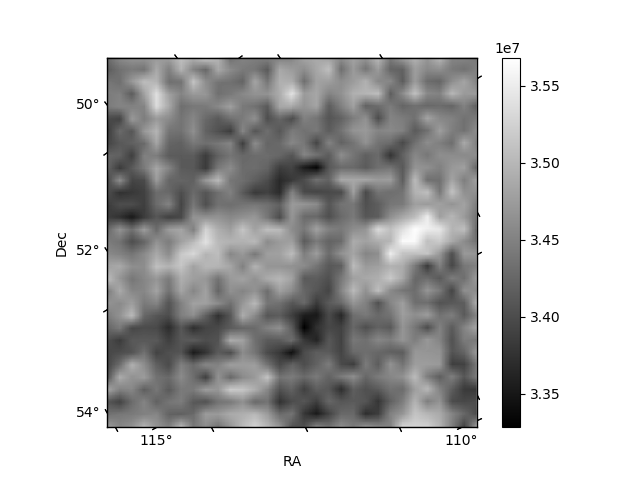
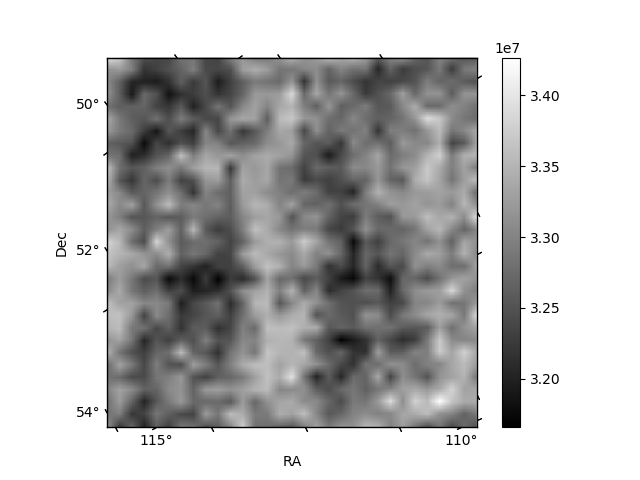
Histogram calculated using DETX and DETY for each event in the final _common_clean file
| Quadrant A | 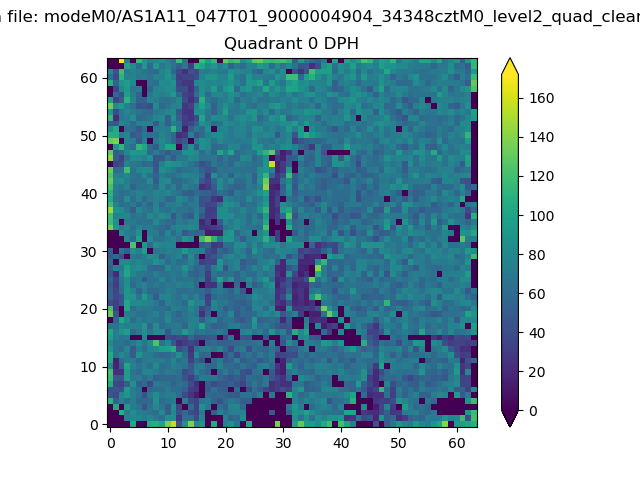 |
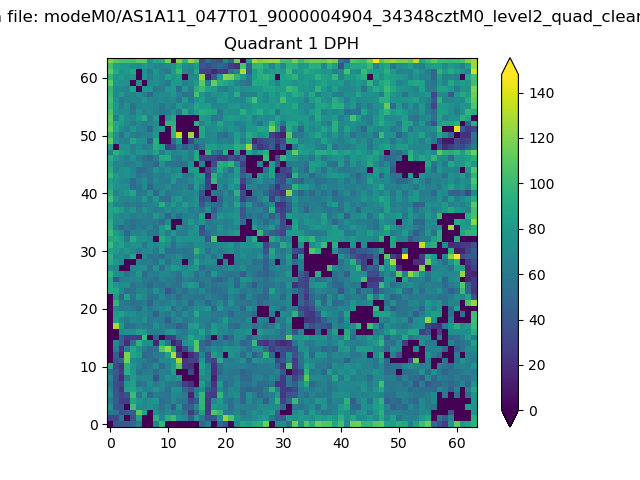 |
Quadrant B |
|---|---|---|---|
| Quadrant D | 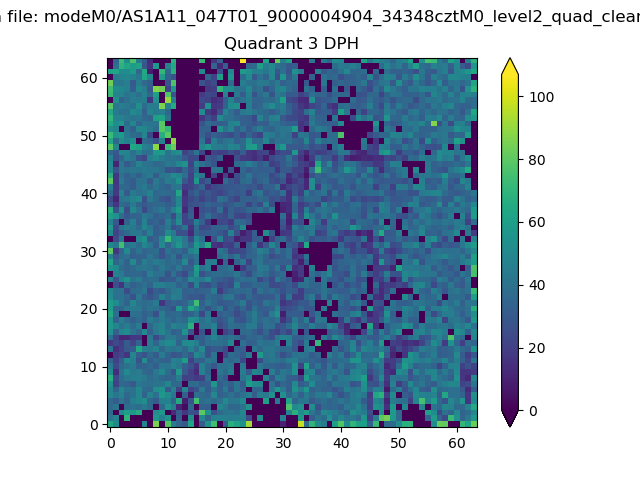 |
 |
Quadrant C |
| Plot type | Count rate plots | Images |
|---|---|---|
| Comparison with Poisson distribution Blue bars denote a histogram of data divided into 1 sec bins. Red curve is a Poisson curve with rate = median count rate of data. |
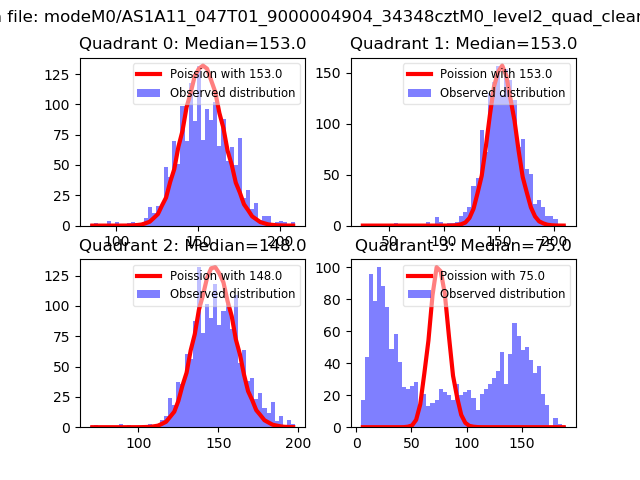 |
 |
| Quadrant-wise count rates Data is divided into 100 sec bins |
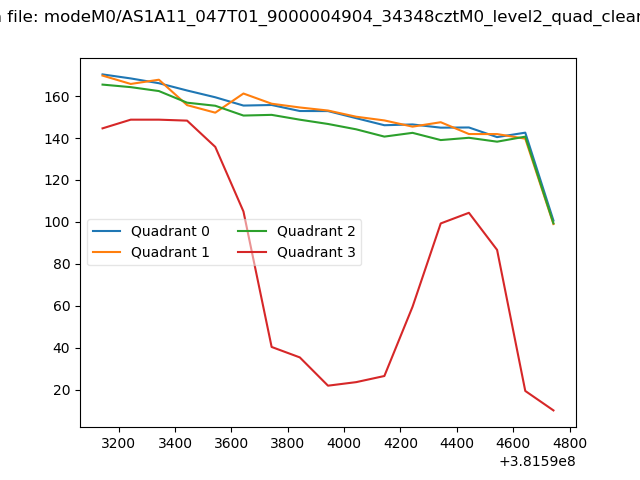 |
|
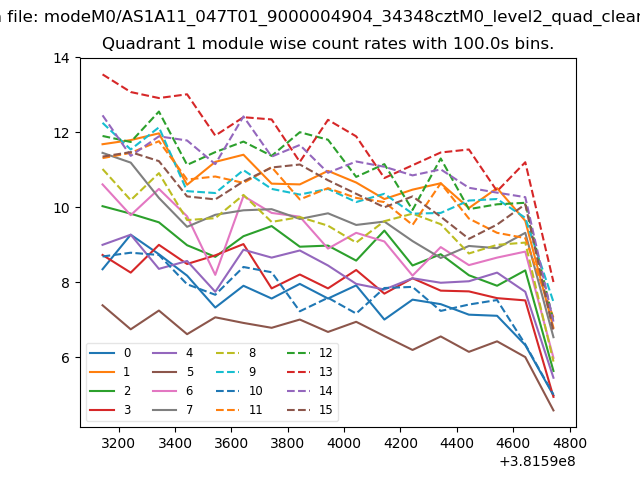
| Module-wise count rates for Quadrant A Data is divided into 100 sec bins |
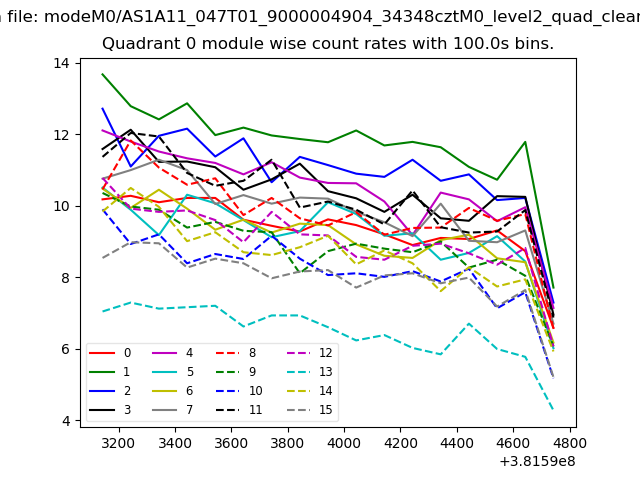 |
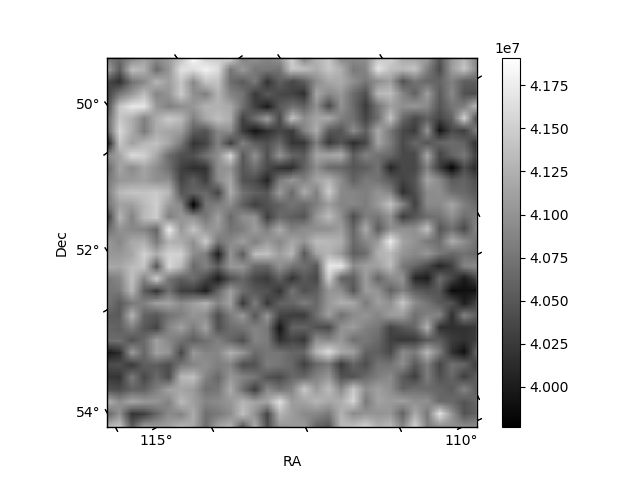 |
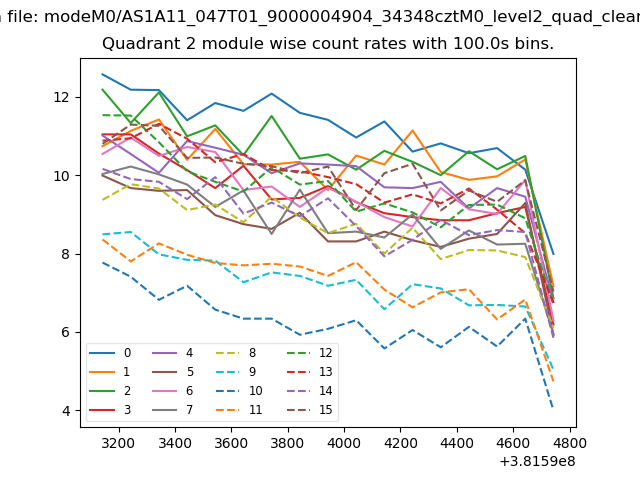
| Module-wise count rates for Quadrant B Data is divided into 100 sec bins |
 |
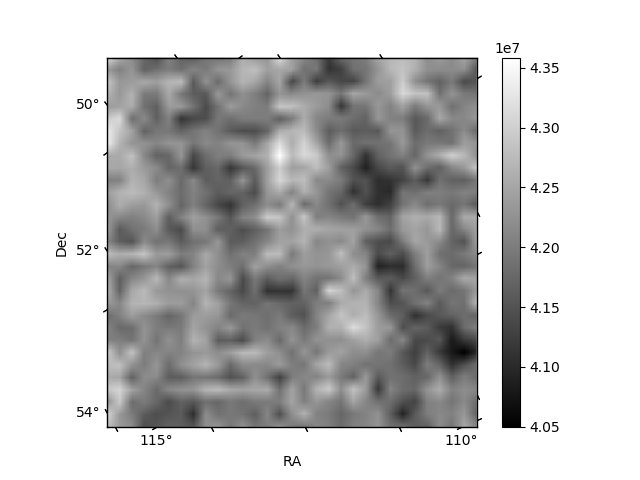 |
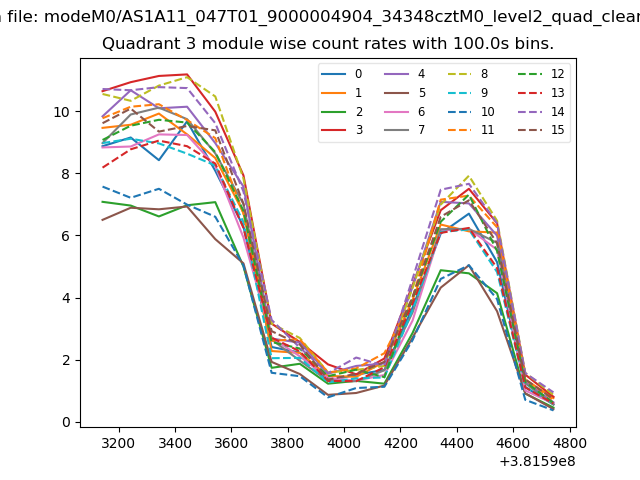
| Module-wise count rates for Quadrant C Data is divided into 100 sec bins |
 |
 |
| Module-wise count rates for Quadrant D Data is divided into 100 sec bins |
 |
 |
| Parameter | Plot |
|---|---|
| CZT HV Monitor | 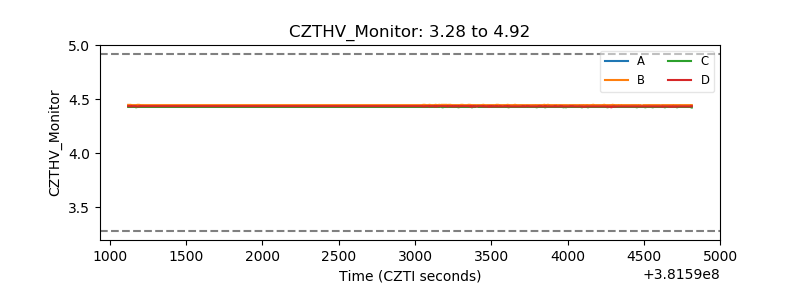 |
| D_VDD | 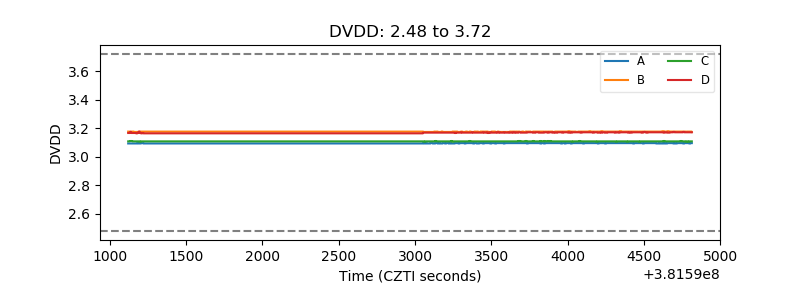 |
| Temperature 1 | 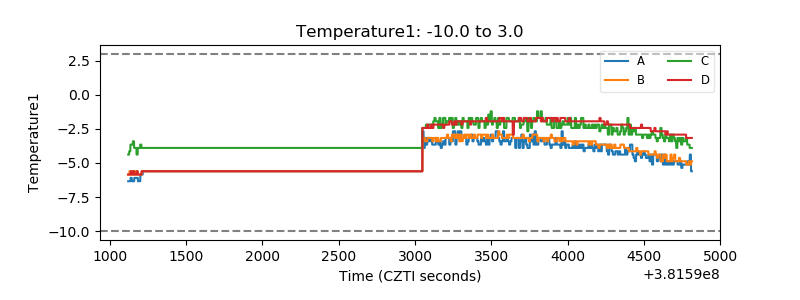 |
| Veto HV Monitor |  |
| Veto LLD | 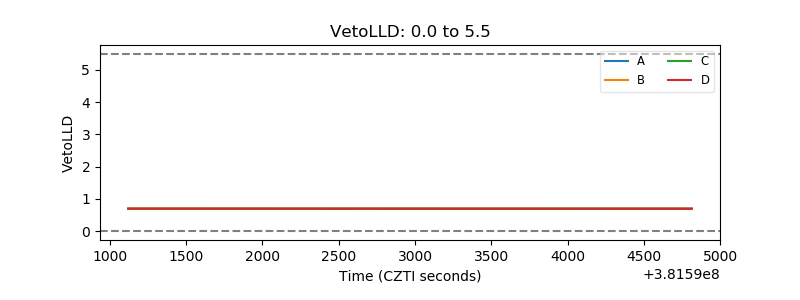 |
| Alpha Counter | 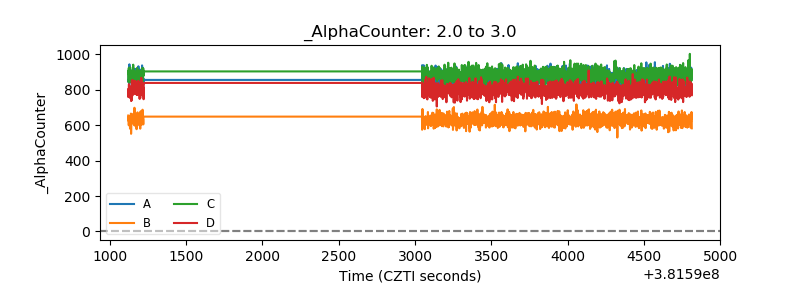 |
| _CPM_Rate | 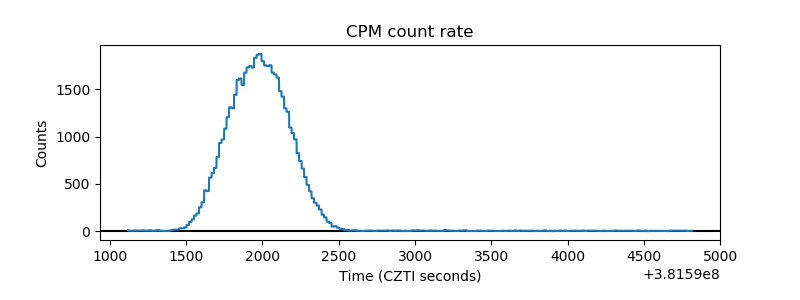 |
| CZT Counter | 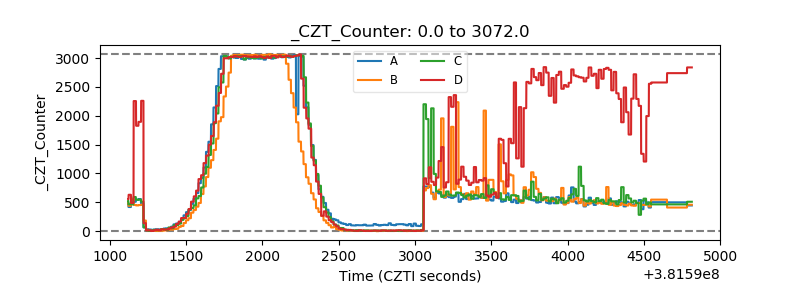 |
| +2.5 Volts monitor | 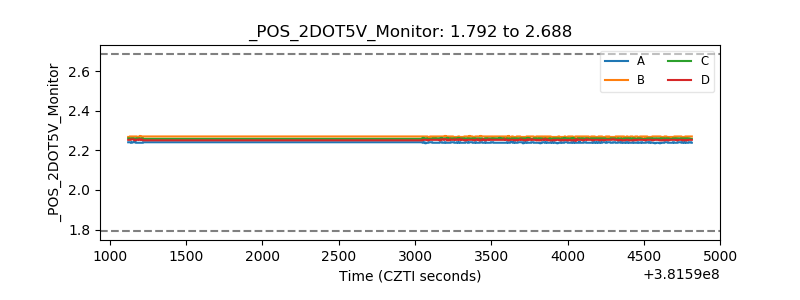 |
| +5 Volts monitor | 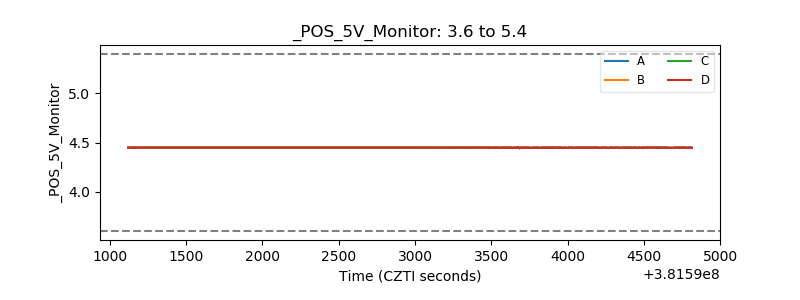 |
| _ROLL_ROT | 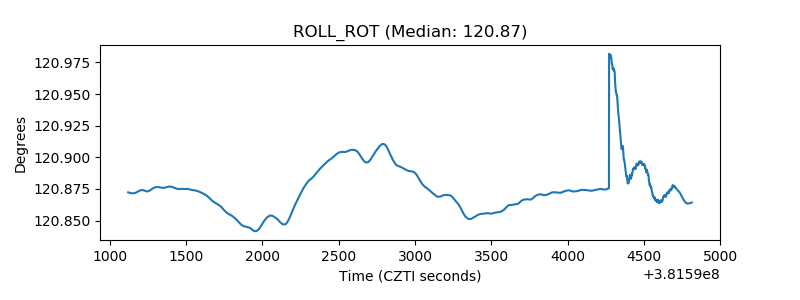 |
| _Roll_DEC | 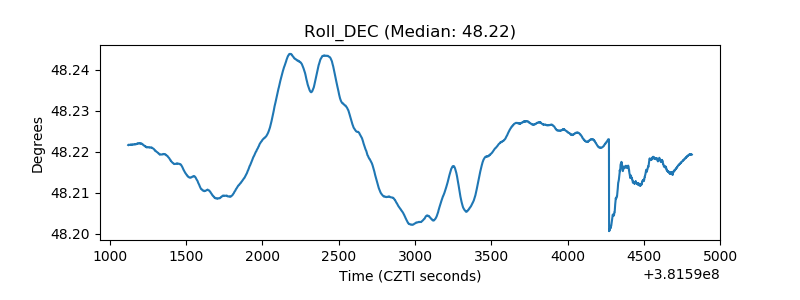 |
| _Roll_RA |  |
| Veto Counter | 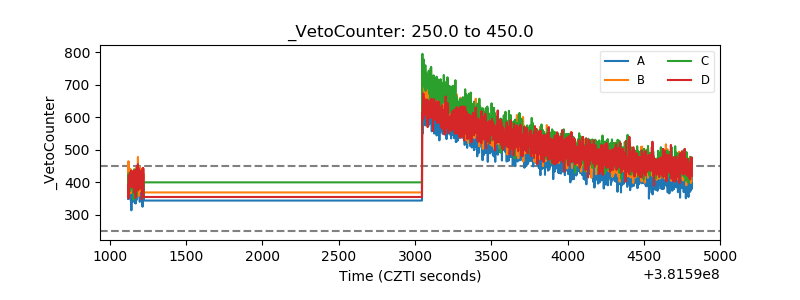 |