| Param | Original file | Final file |
|---|---|---|
| Filename | modeM0/AS1A05_019T01_9000004906_34365cztM0_level2.evt | modeM0/AS1A05_019T01_9000004906_34365cztM0_level2_quad_clean.evt |
| Size (bytes) | 703,445,760 | 56,833,920 |
| Size | 670.9 MB | 54.2 MB |
| Events in quadrant A | 2,374,504 | 403,630 |
| Events in quadrant B | 3,360,695 | 403,204 |
| Events in quadrant C | 4,666,100 | 381,339 |
| Events in quadrant D | 10,573,839 | 189,752 |
| Mode SS | |||
|---|---|---|---|
| Quadrant | BADHDUFLAG | Total packets | Discarded packets |
| A | 0 | 100 | 0 |
| B | 0 | 100 | 0 |
| C | 0 | 100 | 0 |
| D | 0 | 100 | 0 |
| Mode M0 | |||
|---|---|---|---|
| Quadrant | BADHDUFLAG | Total packets | Discarded packets |
| A | 0 | 10009 | 3 |
| B | 0 | 13036 | 2 |
| C | 0 | 17213 | 2 |
| D | 0 | 34688 | 2 |
| Mode M9 | |||
|---|---|---|---|
| Quadrant | BADHDUFLAG | Total packets | Discarded packets |
| A | 0 | 23 | 0 |
| B | 0 | 23 | 0 |
| C | 0 | 23 | 0 |
| D | 0 | 24 | 0 |
| Quadrant | Total seconds | Saturated seconds | Saturation percentage |
|---|---|---|---|
| A | 4868 | 4 | 0.082169% |
| B | 4868 | 205 | 4.211175% |
| C | 4868 | 532 | 10.928513% |
| D | 4868 | 3239 | 66.536565% |
Noise dominated data is calculated using 1-second bins in cleaned event files. If a bin has >2000 counts, and if more than 50% of those come from <1% of pixels, then it is considered to be noise-dominated and hence unusable.
| Quadrant | # 1 sec bins | Bins with >0 counts | Bins with >2000 counts | High rate bins dominated by noise | Noise dominated (total time) | Noise dominated (detector-on time) | Marked lightcurve |
|---|---|---|---|---|---|---|---|
| A | 6991 | 4869 | 0 | 0 | 0.00% | 0.00% | 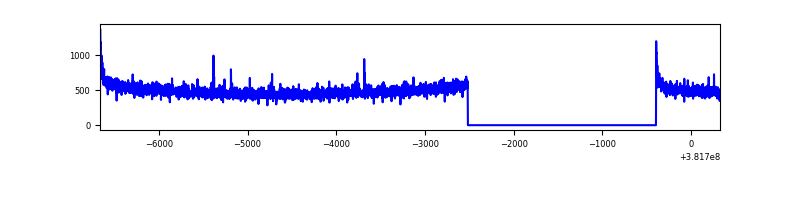 |
| B | 6991 | 4869 | 129 | 129 | 1.85% | 2.65% | 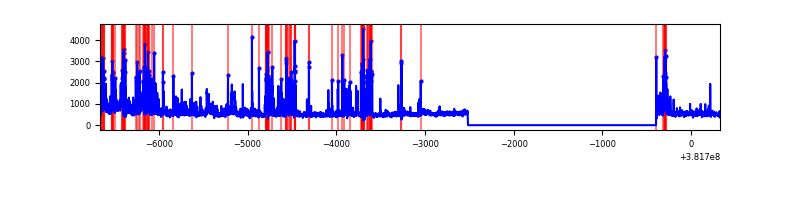 |
| C | 6991 | 4869 | 481 | 481 | 6.88% | 9.88% | 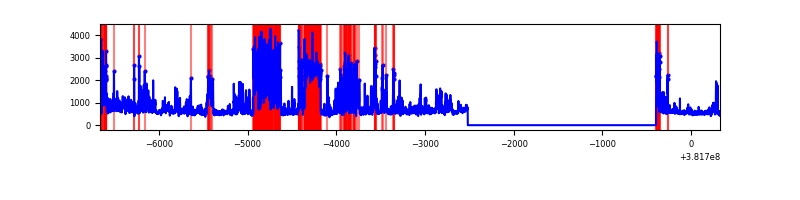 |
| D | 6990 | 4868 | 3304 | 3304 | 47.27% | 67.87% | 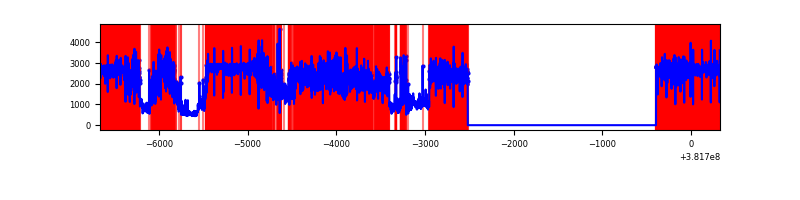 |
Top three noisy pixels from each quadrant. If the there are fewer than three noisy pixels in the level2.evt file, extra rows are filled as -1
| Pixel properties | Quadrant properties | ||||||
|---|---|---|---|---|---|---|---|
| Quadrant | DetID | PixID | Counts | Sigma | Mean | Median | Sigma |
| A | 10 | 83 | 33331 | 272.7 | 599 | 588 | 120.1 |
| A | 13 | 6 | 14982 | 119.88 | 599 | 588 | 120.1 |
| A | 9 | 143 | 9291 | 72.48 | 599 | 588 | 120.1 |
| B | 5 | 172 | 475873 | 4264.33 | 593 | 578 | 111.5 |
| B | 4 | 171 | 290889 | 2604.66 | 593 | 578 | 111.5 |
| B | 0 | 190 | 88204 | 786.18 | 593 | 578 | 111.5 |
| C | 4 | 254 | 2103845 | 16414.4 | 557 | 563 | 128.1 |
| C | 15 | 214 | 195014 | 1517.53 | 557 | 563 | 128.1 |
| C | 0 | 10 | 135727 | 1054.84 | 557 | 563 | 128.1 |
| D | 7 | 223 | 7819832 | 70933.82 | 409 | 401 | 110.2 |
| D | 8 | 195 | 624101 | 5657.88 | 409 | 401 | 110.2 |
| D | 13 | 249 | 167253 | 1513.59 | 409 | 401 | 110.2 |
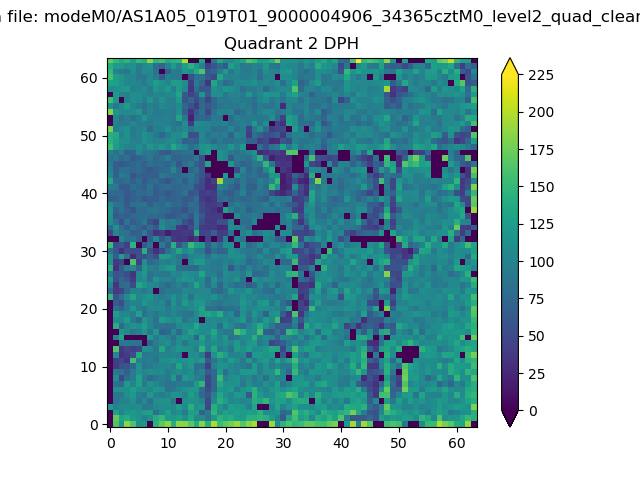
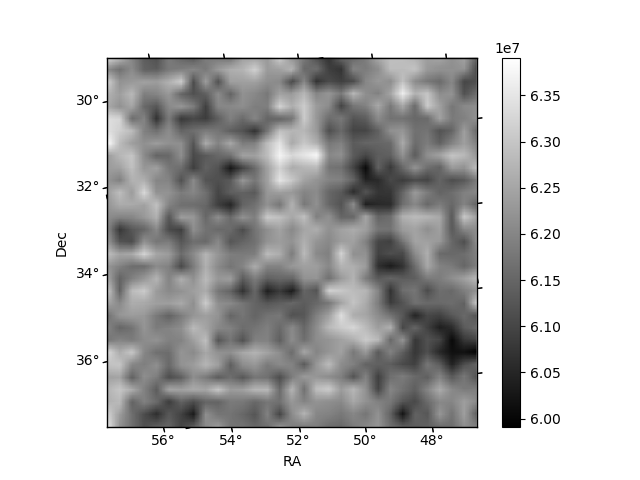
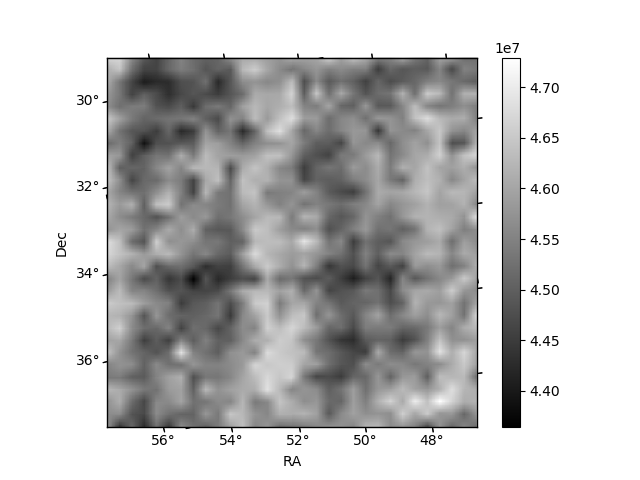
Histogram calculated using DETX and DETY for each event in the final _common_clean file
| Quadrant A | 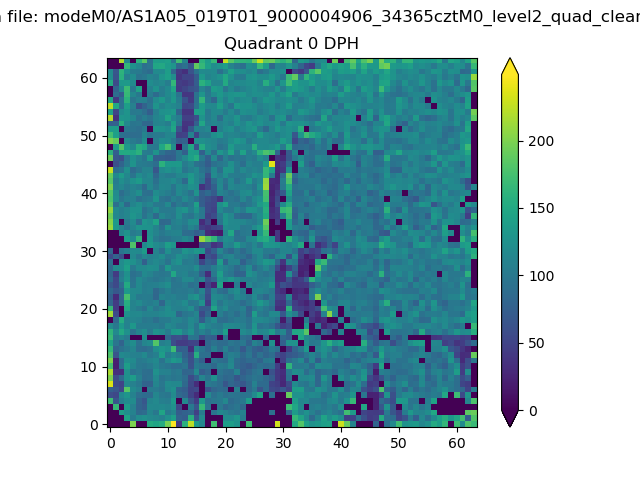 |
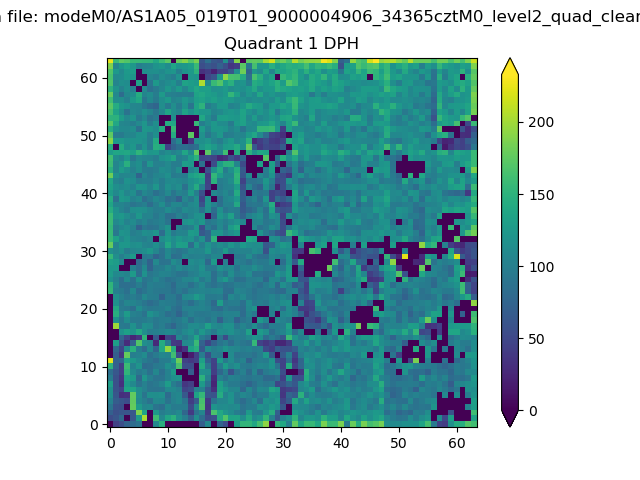 |
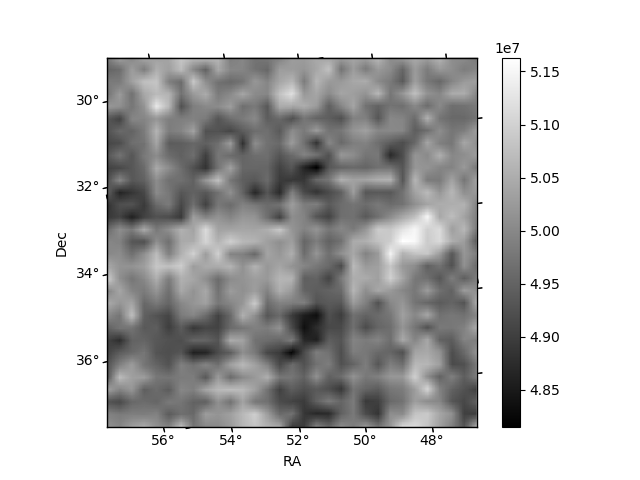
Quadrant B |
|---|---|---|---|
| Quadrant D | 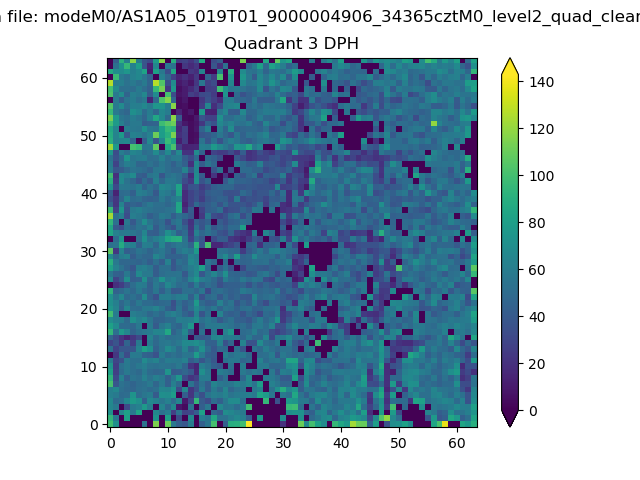 |
 |
Quadrant C |
| Plot type | Count rate plots | Images |
|---|---|---|
| Comparison with Poisson distribution Blue bars denote a histogram of data divided into 1 sec bins. Red curve is a Poisson curve with rate = median count rate of data. |
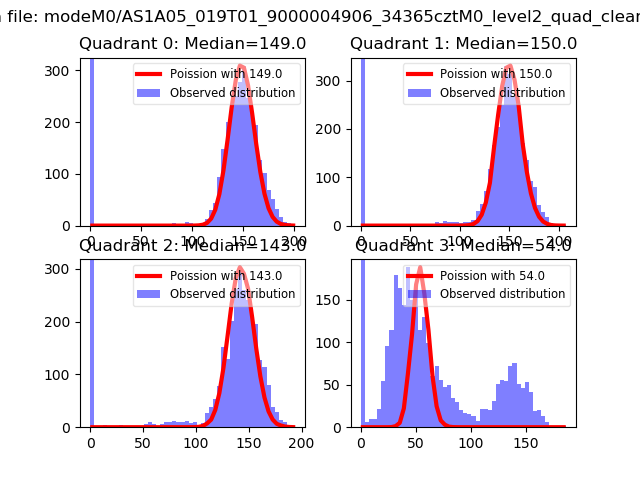 |
 |
| Quadrant-wise count rates Data is divided into 100 sec bins |
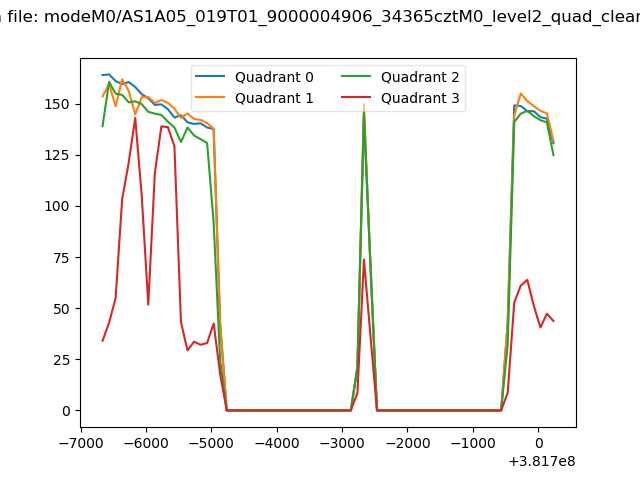 |
|
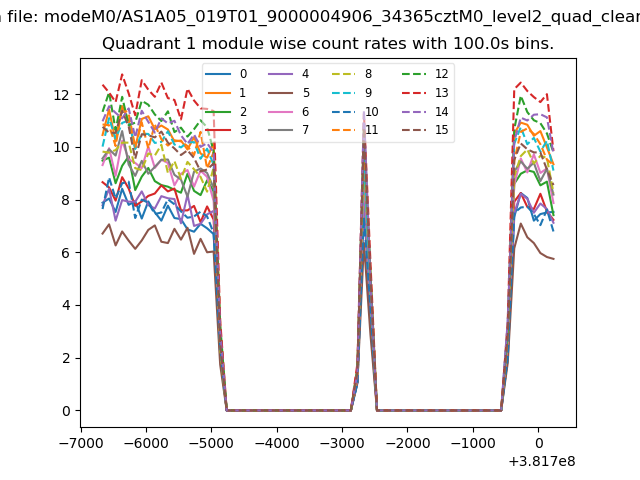
| Module-wise count rates for Quadrant A Data is divided into 100 sec bins |
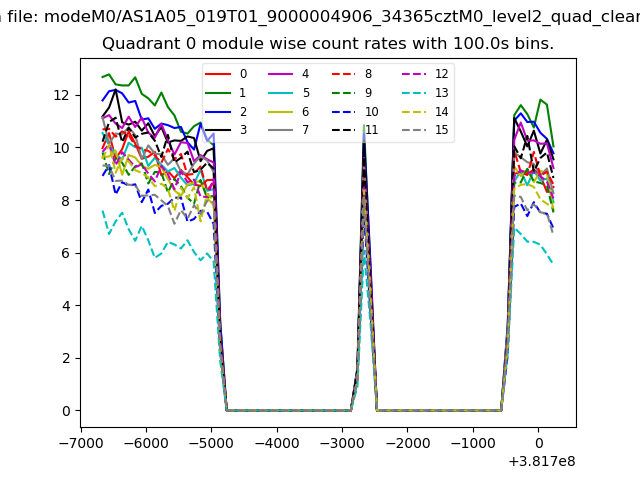 |
 |
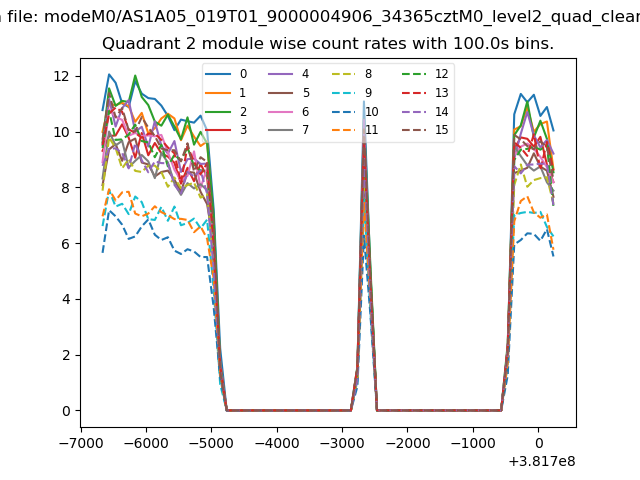
| Module-wise count rates for Quadrant B Data is divided into 100 sec bins |
 |
 |
| Module-wise count rates for Quadrant C Data is divided into 100 sec bins |
 |
 |
| Module-wise count rates for Quadrant D Data is divided into 100 sec bins |
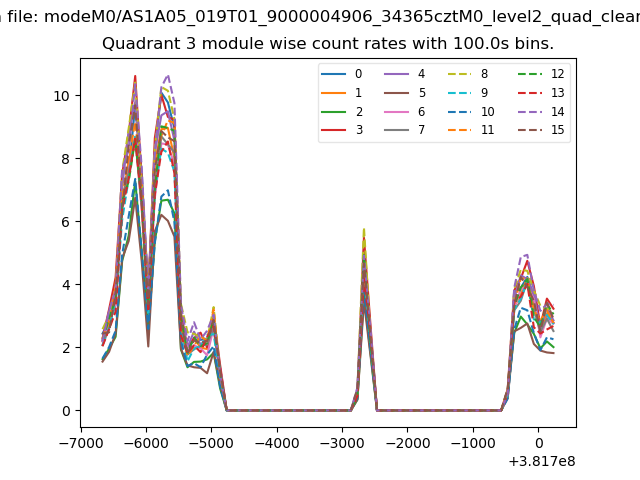 |
 |
| Parameter | Plot |
|---|---|
| CZT HV Monitor | 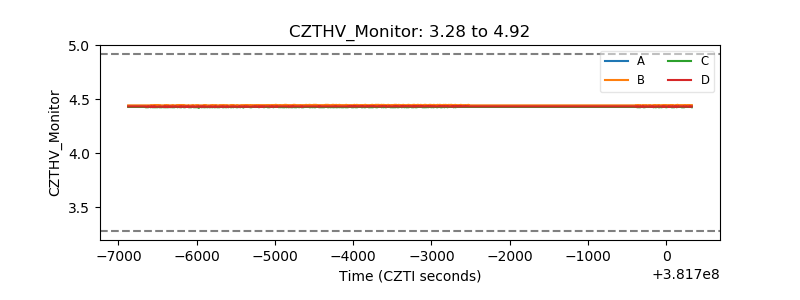 |
| D_VDD | 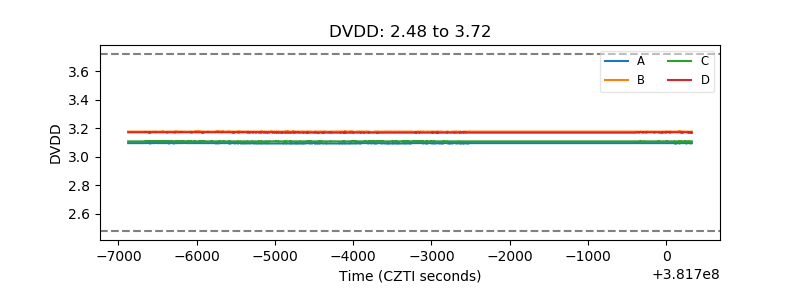 |
| Temperature 1 | 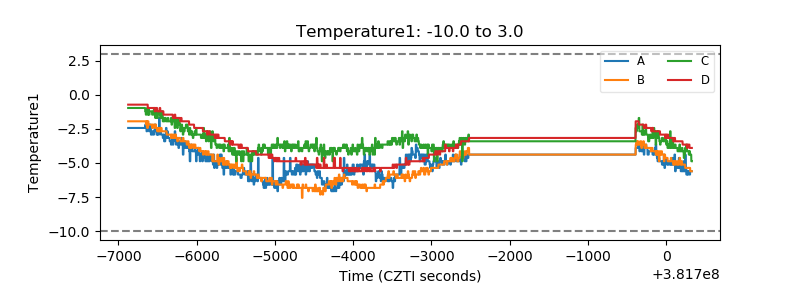 |
| Veto HV Monitor | 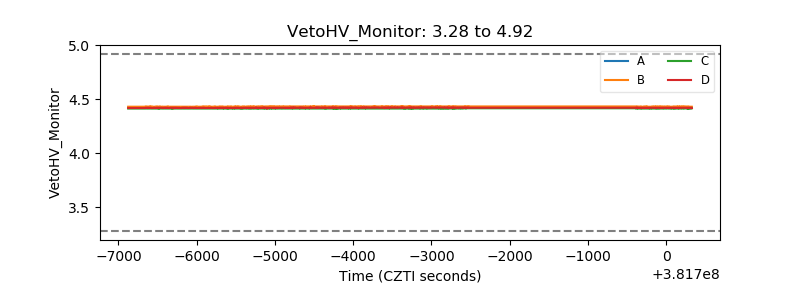 |
| Veto LLD | 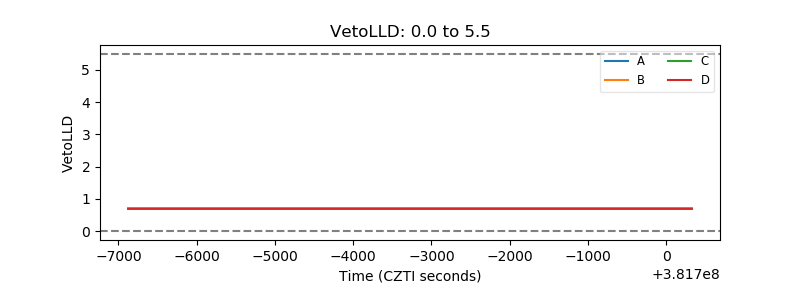 |
| Alpha Counter | 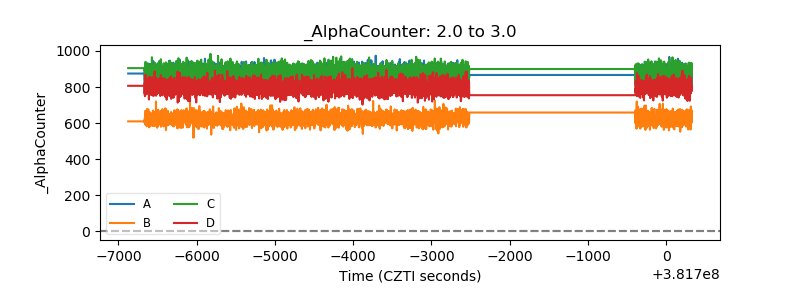 |
| _CPM_Rate | 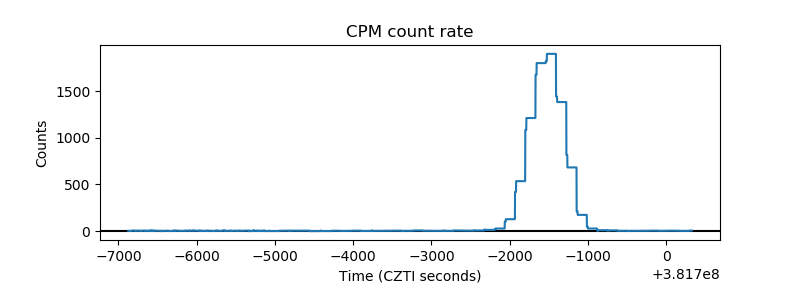 |
| CZT Counter | 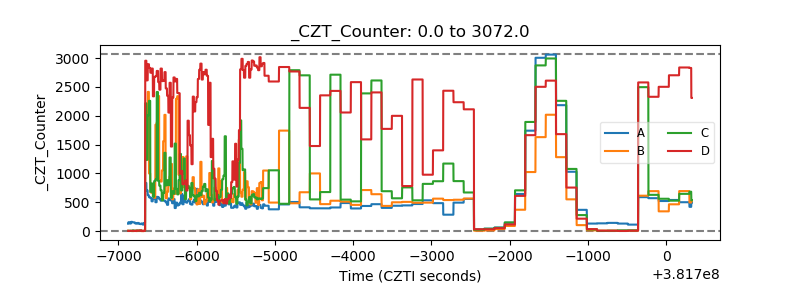 |
| +2.5 Volts monitor | 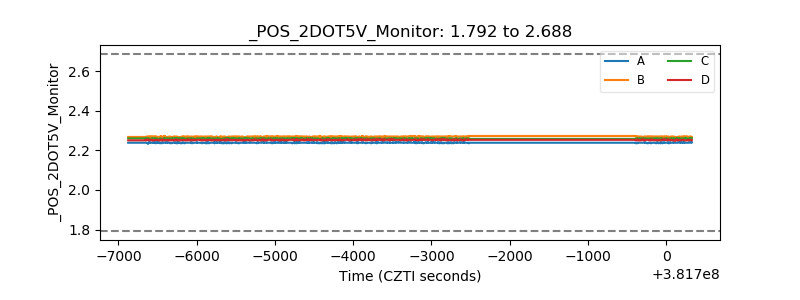 |
| +5 Volts monitor | 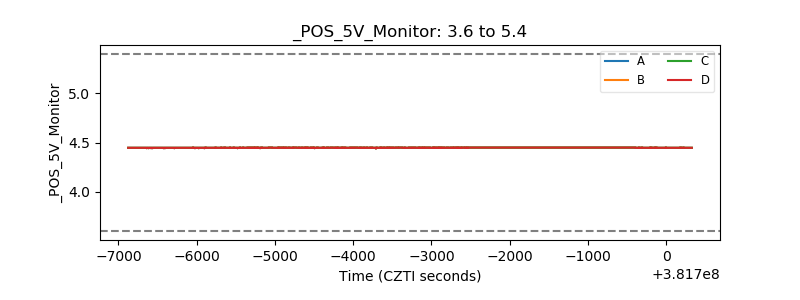 |
| _ROLL_ROT | 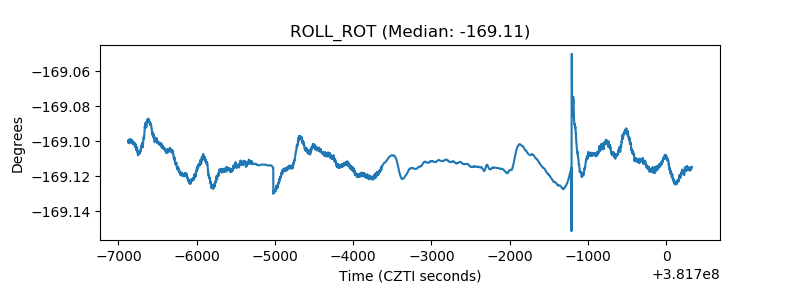 |
| _Roll_DEC | 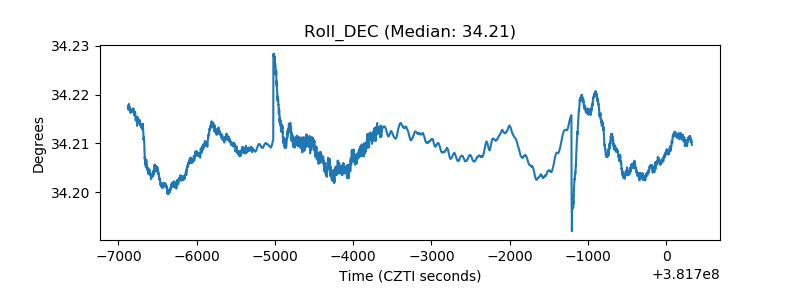 |
| _Roll_RA | 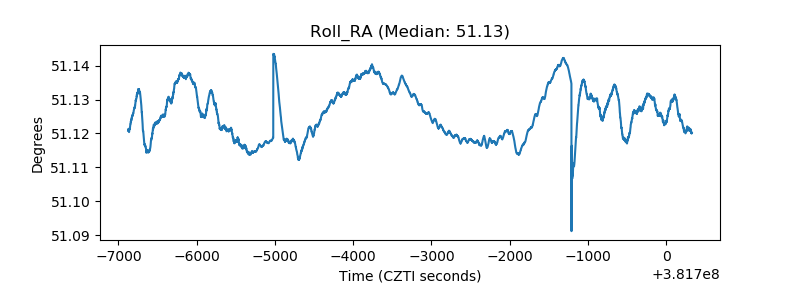 |
| Veto Counter | 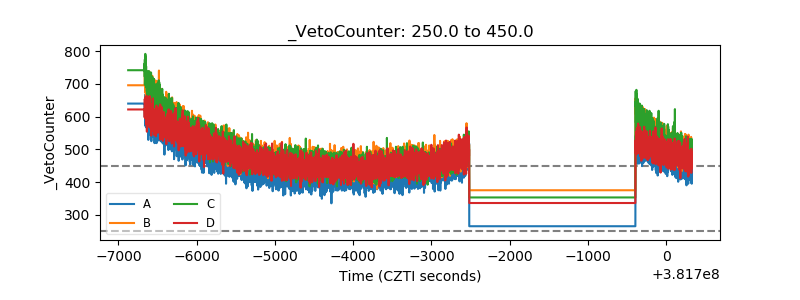 |