| Param | Original file | Final file |
|---|---|---|
| Filename | modeM0/AS1A05_019T01_9000004906_34363cztM0_level2.evt | modeM0/AS1A05_019T01_9000004906_34363cztM0_level2_quad_clean.evt |
| Size (bytes) | 740,545,920 | 79,534,080 |
| Size | 706.2 MB | 75.8 MB |
| Events in quadrant A | 2,632,803 | 563,261 |
| Events in quadrant B | 3,271,001 | 560,197 |
| Events in quadrant C | 6,745,538 | 480,753 |
| Events in quadrant D | 9,420,338 | 431,159 |
| Mode SS | |||
|---|---|---|---|
| Quadrant | BADHDUFLAG | Total packets | Discarded packets |
| A | 0 | 108 | 0 |
| B | 0 | 108 | 0 |
| C | 0 | 108 | 0 |
| D | 0 | 108 | 0 |
| Mode M0 | |||
|---|---|---|---|
| Quadrant | BADHDUFLAG | Total packets | Discarded packets |
| A | 0 | 11053 | 3 |
| B | 0 | 13106 | 2 |
| C | 0 | 23823 | 2 |
| D | 0 | 31663 | 2 |
| Mode M9 | |||
|---|---|---|---|
| Quadrant | BADHDUFLAG | Total packets | Discarded packets |
| A | 0 | 25 | 0 |
| B | 0 | 25 | 0 |
| C | 0 | 25 | 0 |
| D | 0 | 26 | 0 |
| Quadrant | Total seconds | Saturated seconds | Saturation percentage |
|---|---|---|---|
| A | 5313 | 5 | 0.094109% |
| B | 5313 | 78 | 1.468097% |
| C | 5313 | 1213 | 22.830792% |
| D | 5313 | 2045 | 38.490495% |
Noise dominated data is calculated using 1-second bins in cleaned event files. If a bin has >2000 counts, and if more than 50% of those come from <1% of pixels, then it is considered to be noise-dominated and hence unusable.
| Quadrant | # 1 sec bins | Bins with >0 counts | Bins with >2000 counts | High rate bins dominated by noise | Noise dominated (total time) | Noise dominated (detector-on time) | Marked lightcurve |
|---|---|---|---|---|---|---|---|
| A | 7287 | 5314 | 0 | 0 | 0.00% | 0.00% | 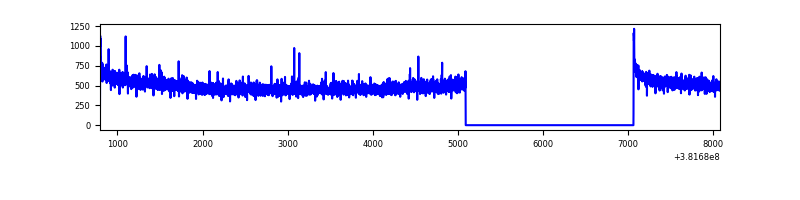 |
| B | 7287 | 5314 | 47 | 47 | 0.64% | 0.88% | 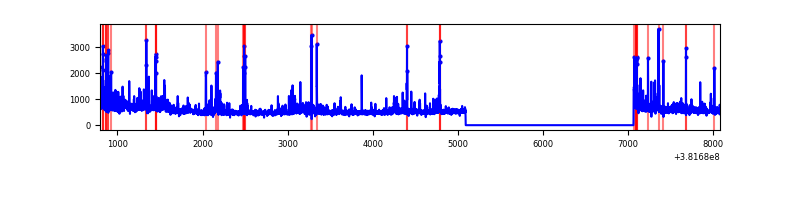 |
| C | 7286 | 5313 | 1034 | 1034 | 14.19% | 19.46% | 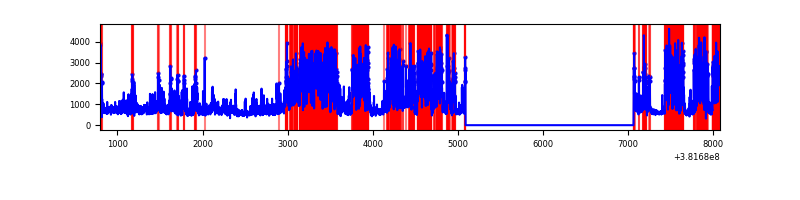 |
| D | 7287 | 5314 | 2078 | 2078 | 28.52% | 39.10% |  |
Top three noisy pixels from each quadrant. If the there are fewer than three noisy pixels in the level2.evt file, extra rows are filled as -1
| Pixel properties | Quadrant properties | ||||||
|---|---|---|---|---|---|---|---|
| Quadrant | DetID | PixID | Counts | Sigma | Mean | Median | Sigma |
| A | 10 | 83 | 33849 | 251.05 | 667 | 656 | 132.2 |
| A | 13 | 6 | 13137 | 94.4 | 667 | 656 | 132.2 |
| A | 13 | 254 | 8299 | 57.81 | 667 | 656 | 132.2 |
| B | 5 | 172 | 280719 | 2255.47 | 659 | 643 | 124.2 |
| B | 0 | 190 | 143131 | 1147.47 | 659 | 643 | 124.2 |
| B | 4 | 251 | 90781 | 725.89 | 659 | 643 | 124.2 |
| C | 4 | 254 | 3764567 | 28203.95 | 584 | 588 | 133.5 |
| C | 3 | 233 | 365163 | 2731.8 | 584 | 588 | 133.5 |
| C | 15 | 214 | 206437 | 1542.45 | 584 | 588 | 133.5 |
| D | 7 | 223 | 2900834 | 20132.54 | 581 | 566 | 144.1 |
| D | 1 | 52 | 2498587 | 17340.3 | 581 | 566 | 144.1 |
| D | 8 | 195 | 707370 | 4906.36 | 581 | 566 | 144.1 |
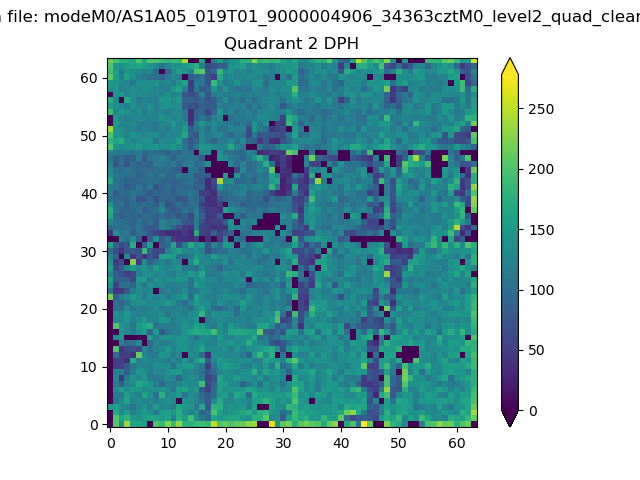
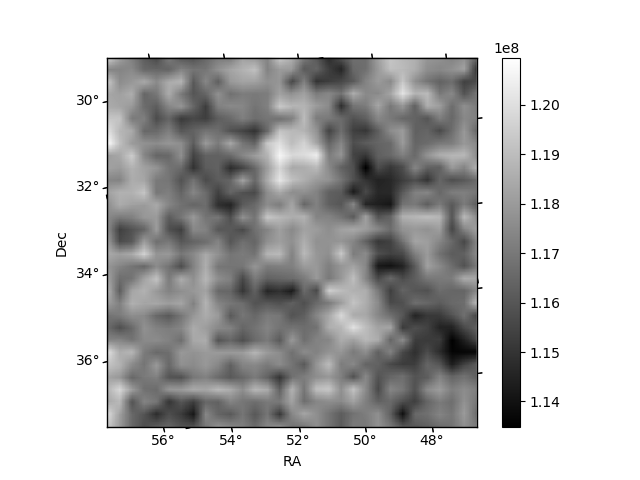
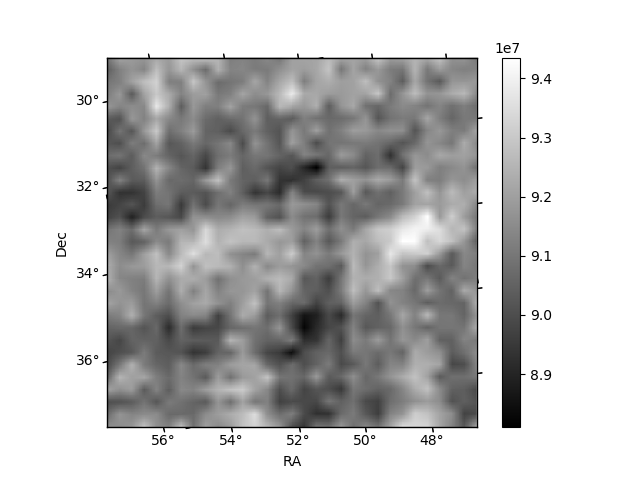
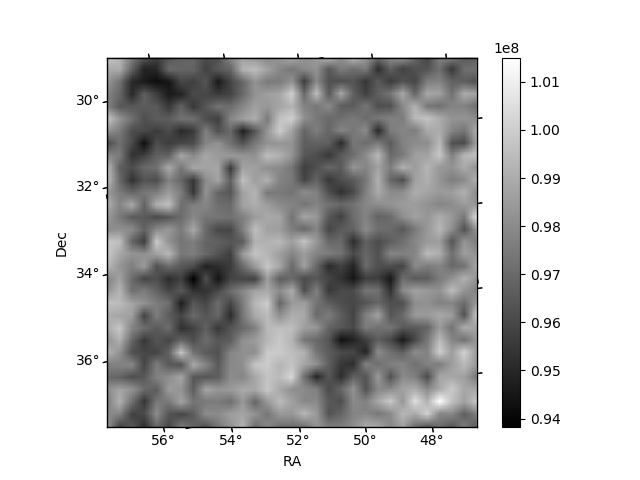
Histogram calculated using DETX and DETY for each event in the final _common_clean file
| Quadrant A | 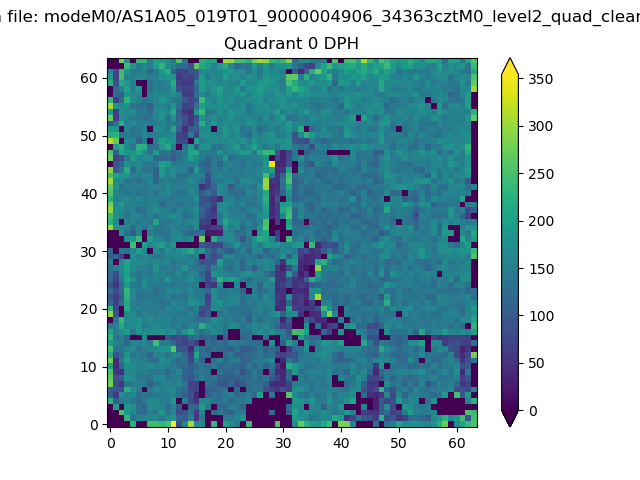 |
 |
Quadrant B |
|---|---|---|---|
| Quadrant D | 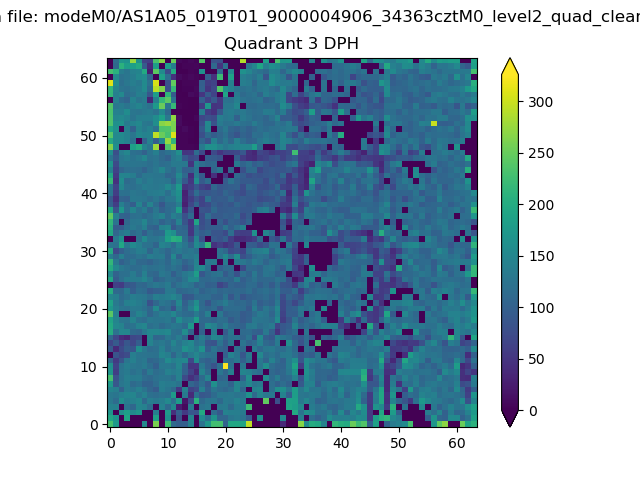 |
 |
Quadrant C |
| Plot type | Count rate plots | Images |
|---|---|---|
| Comparison with Poisson distribution Blue bars denote a histogram of data divided into 1 sec bins. Red curve is a Poisson curve with rate = median count rate of data. |
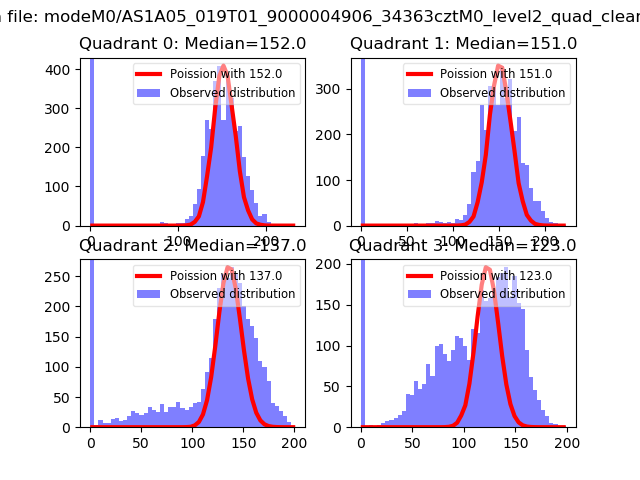 |
 |
| Quadrant-wise count rates Data is divided into 100 sec bins |
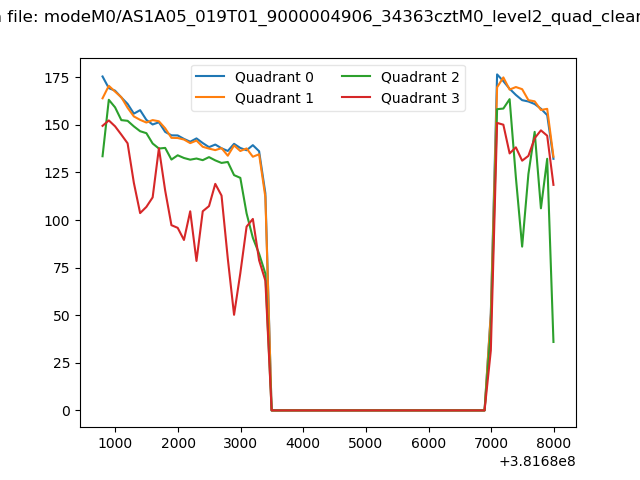 |
|
| Module-wise count rates for Quadrant A Data is divided into 100 sec bins |
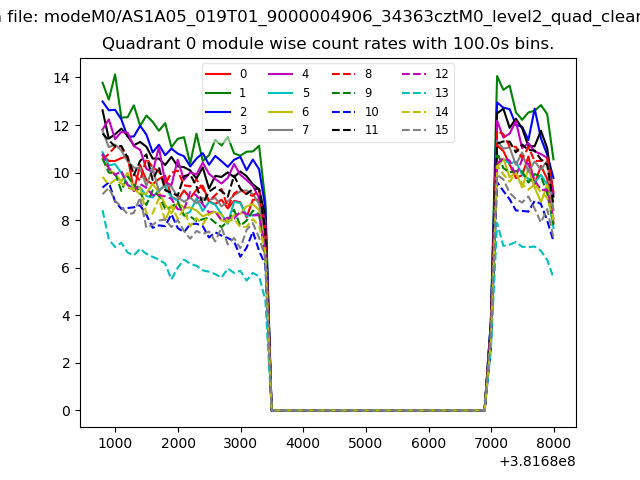 |
 |
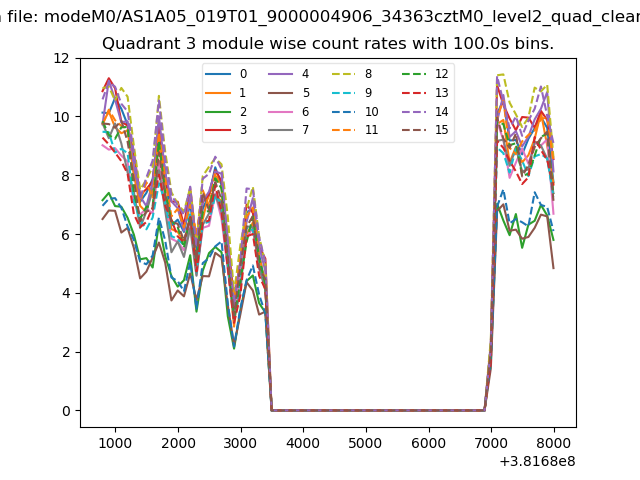
| Module-wise count rates for Quadrant B Data is divided into 100 sec bins |
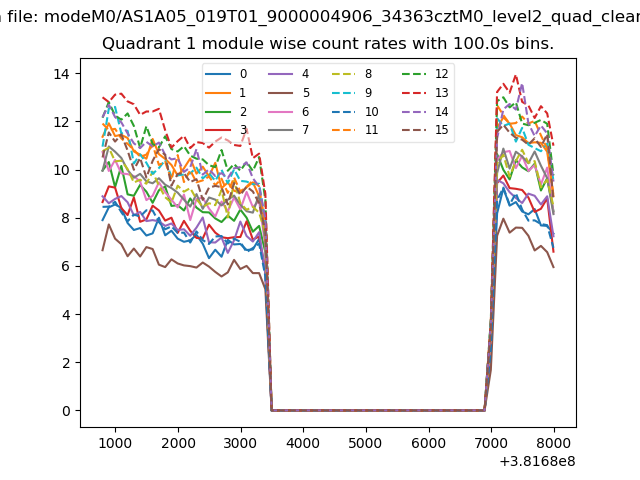 |
 |
| Module-wise count rates for Quadrant C Data is divided into 100 sec bins |
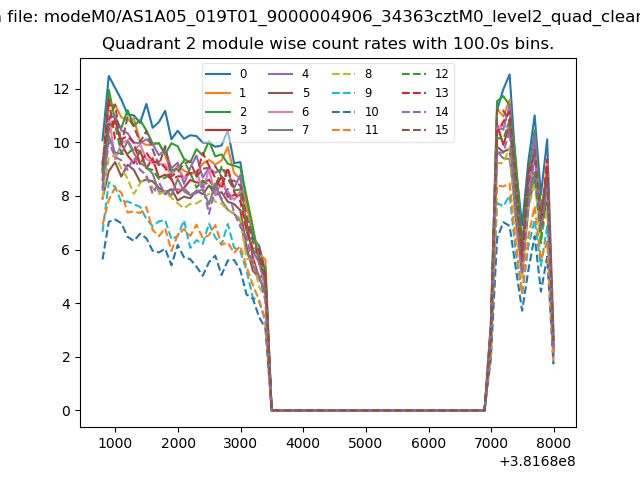 |
 |
| Module-wise count rates for Quadrant D Data is divided into 100 sec bins |
 |
 |
| Parameter | Plot |
|---|---|
| CZT HV Monitor | 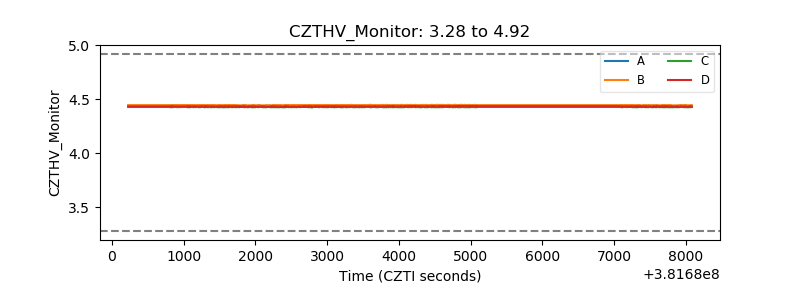 |
| D_VDD | 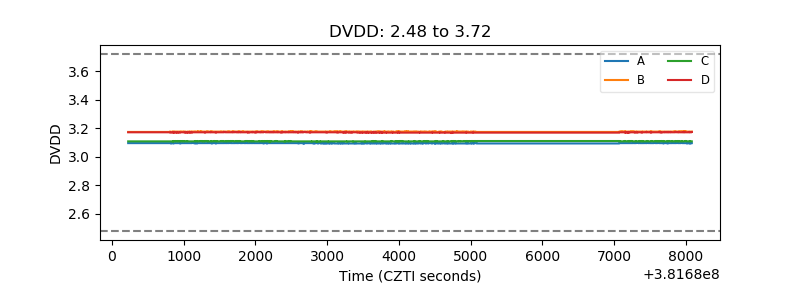 |
| Temperature 1 | 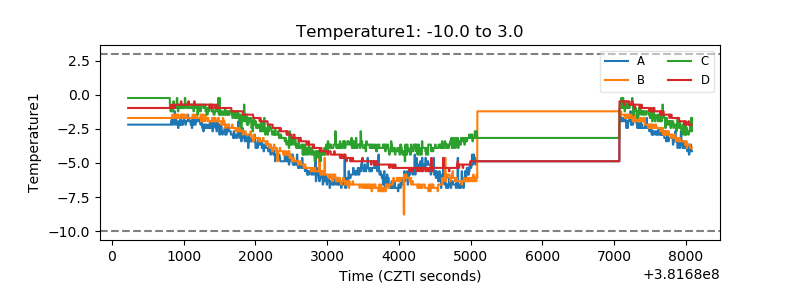 |
| Veto HV Monitor | 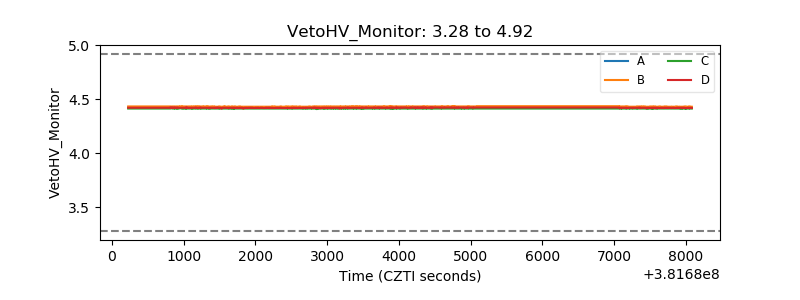 |
| Veto LLD | 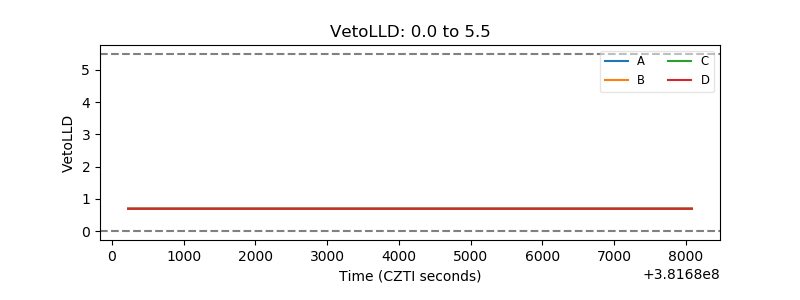 |
| Alpha Counter | 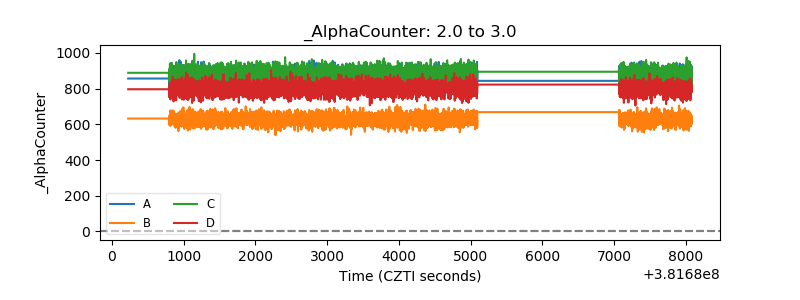 |
| _CPM_Rate | 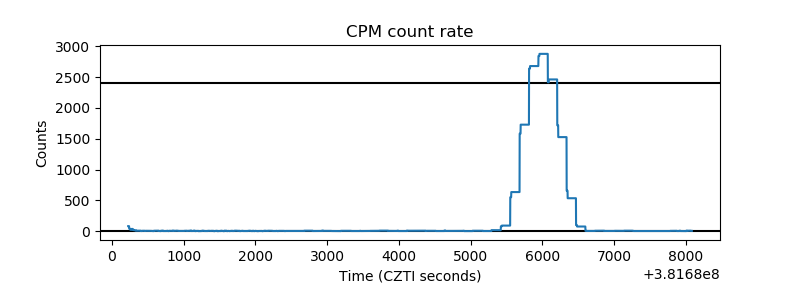 |
| CZT Counter | 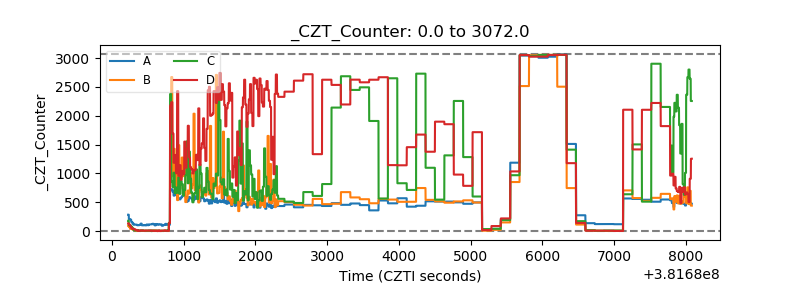 |
| +2.5 Volts monitor | 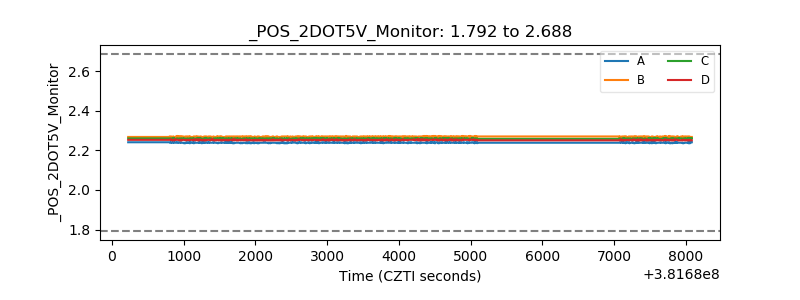 |
| +5 Volts monitor | 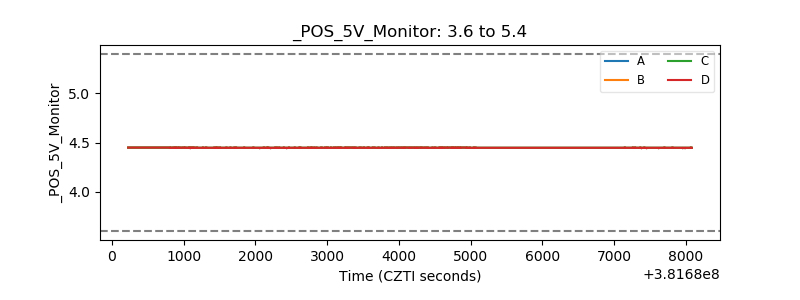 |
| _ROLL_ROT | 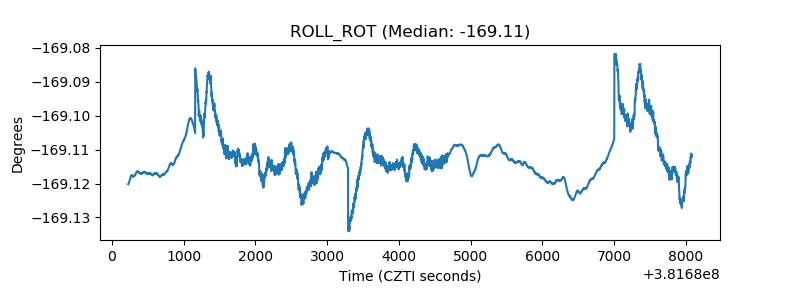 |
| _Roll_DEC | 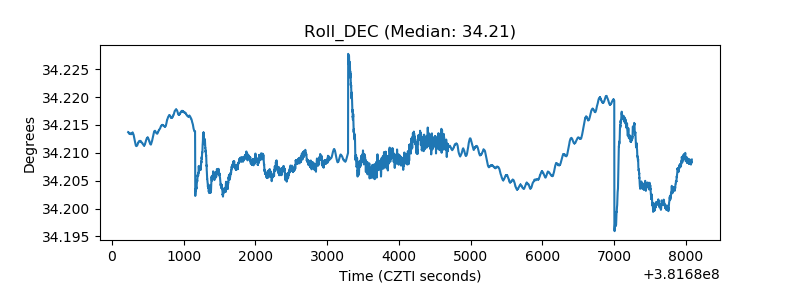 |
| _Roll_RA |  |
| Veto Counter | 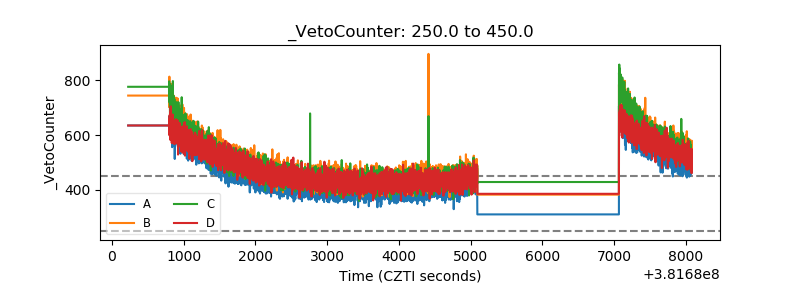 |