| Param | Original file | Final file |
|---|---|---|
| Filename | modeM0/AS1A05_019T01_9000004906_34362cztM0_level2.evt | modeM0/AS1A05_019T01_9000004906_34362cztM0_level2_quad_clean.evt |
| Size (bytes) | 605,318,400 | 86,224,320 |
| Size | 577.3 MB | 82.2 MB |
| Events in quadrant A | 2,649,002 | 593,879 |
| Events in quadrant B | 3,336,043 | 589,756 |
| Events in quadrant C | 4,212,111 | 557,515 |
| Events in quadrant D | 7,767,495 | 488,797 |
| Mode SS | |||
|---|---|---|---|
| Quadrant | BADHDUFLAG | Total packets | Discarded packets |
| A | 0 | 110 | 0 |
| B | 0 | 110 | 0 |
| C | 0 | 110 | 0 |
| D | 0 | 110 | 0 |
| Mode M0 | |||
|---|---|---|---|
| Quadrant | BADHDUFLAG | Total packets | Discarded packets |
| A | 0 | 11350 | 2 |
| B | 0 | 13477 | 1 |
| C | 0 | 16182 | 1 |
| D | 0 | 26839 | 1 |
| Mode M9 | |||
|---|---|---|---|
| Quadrant | BADHDUFLAG | Total packets | Discarded packets |
| A | 0 | 19 | 0 |
| B | 0 | 19 | 0 |
| C | 0 | 19 | 0 |
| D | 0 | 20 | 0 |
| Quadrant | Total seconds | Saturated seconds | Saturation percentage |
|---|---|---|---|
| A | 5442 | 6 | 0.110254% |
| B | 5442 | 88 | 1.617053% |
| C | 5442 | 130 | 2.388828% |
| D | 5442 | 1257 | 23.098126% |
Noise dominated data is calculated using 1-second bins in cleaned event files. If a bin has >2000 counts, and if more than 50% of those come from <1% of pixels, then it is considered to be noise-dominated and hence unusable.
| Quadrant | # 1 sec bins | Bins with >0 counts | Bins with >2000 counts | High rate bins dominated by noise | Noise dominated (total time) | Noise dominated (detector-on time) | Marked lightcurve |
|---|---|---|---|---|---|---|---|
| A | 7295 | 5443 | 2 | 2 | 0.03% | 0.04% | 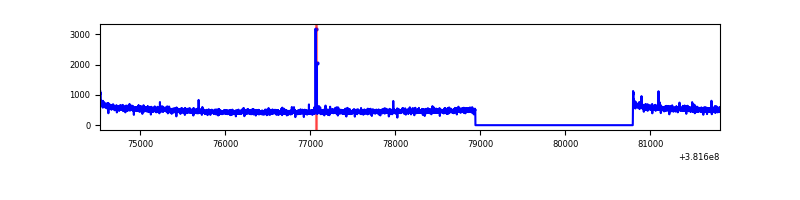 |
| B | 7295 | 5443 | 53 | 53 | 0.73% | 0.97% | 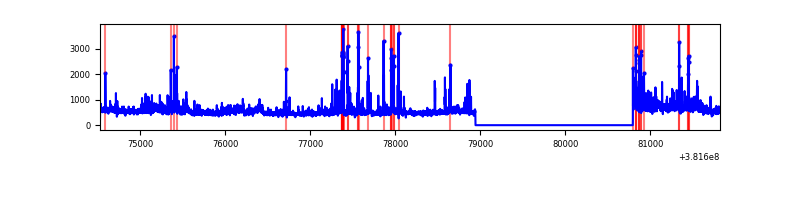 |
| C | 7295 | 5443 | 102 | 102 | 1.40% | 1.87% | 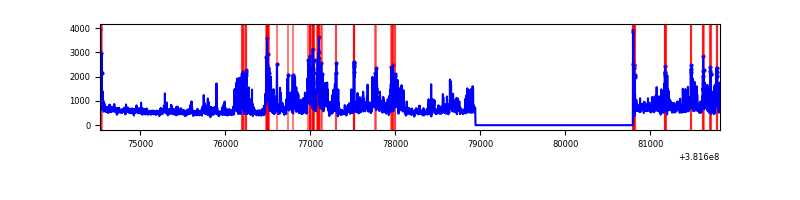 |
| D | 7295 | 5443 | 1292 | 1292 | 17.71% | 23.74% | 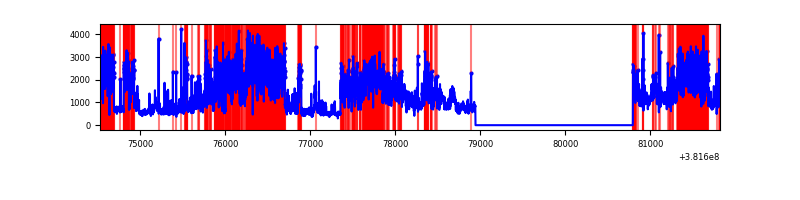 |
Top three noisy pixels from each quadrant. If the there are fewer than three noisy pixels in the level2.evt file, extra rows are filled as -1
| Pixel properties | Quadrant properties | ||||||
|---|---|---|---|---|---|---|---|
| Quadrant | DetID | PixID | Counts | Sigma | Mean | Median | Sigma |
| A | 10 | 83 | 32909 | 245.06 | 668 | 656 | 131.6 |
| A | 13 | 6 | 19767 | 145.21 | 668 | 656 | 131.6 |
| A | 9 | 143 | 15167 | 110.25 | 668 | 656 | 131.6 |
| B | 5 | 172 | 298543 | 2374.58 | 656 | 640 | 125.5 |
| B | 0 | 190 | 239990 | 1907.86 | 656 | 640 | 125.5 |
| B | 5 | 200 | 99554 | 788.44 | 656 | 640 | 125.5 |
| C | 4 | 254 | 943321 | 6511.71 | 634 | 639 | 144.8 |
| C | 3 | 233 | 455029 | 3138.76 | 634 | 639 | 144.8 |
| C | 15 | 214 | 227508 | 1567.13 | 634 | 639 | 144.8 |
| D | 7 | 223 | 2123302 | 14321.92 | 609 | 593 | 148.2 |
| D | 1 | 52 | 2033632 | 13716.92 | 609 | 593 | 148.2 |
| D | 8 | 195 | 482086 | 3248.63 | 609 | 593 | 148.2 |
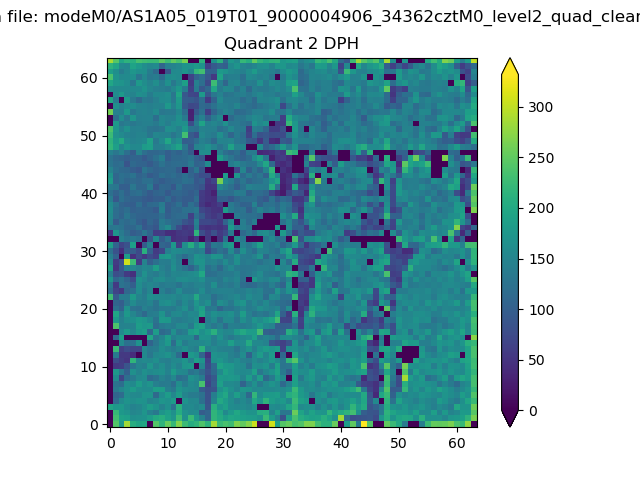
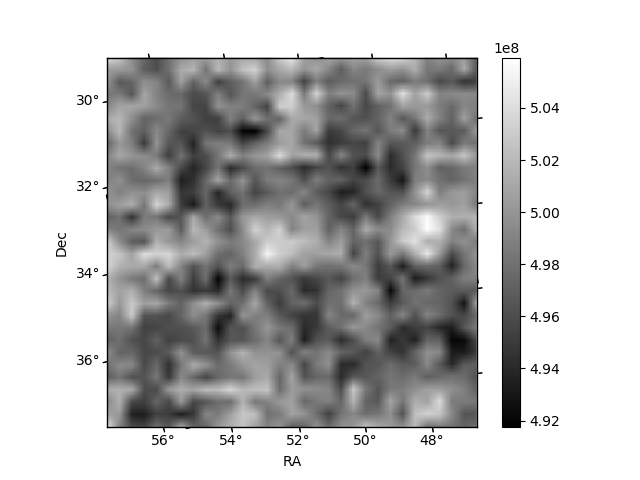
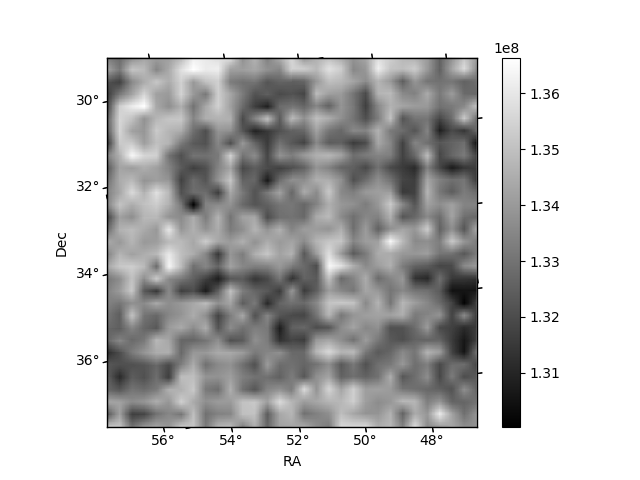
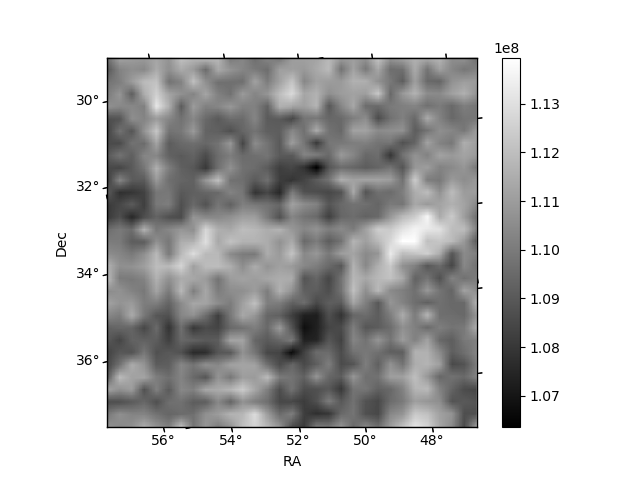
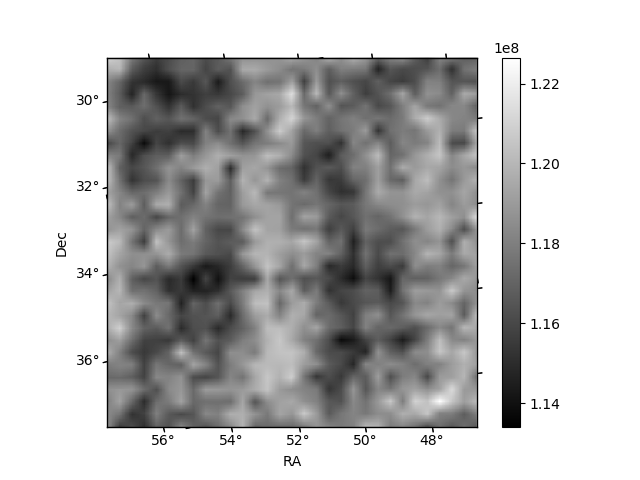
Histogram calculated using DETX and DETY for each event in the final _common_clean file
| Quadrant A | 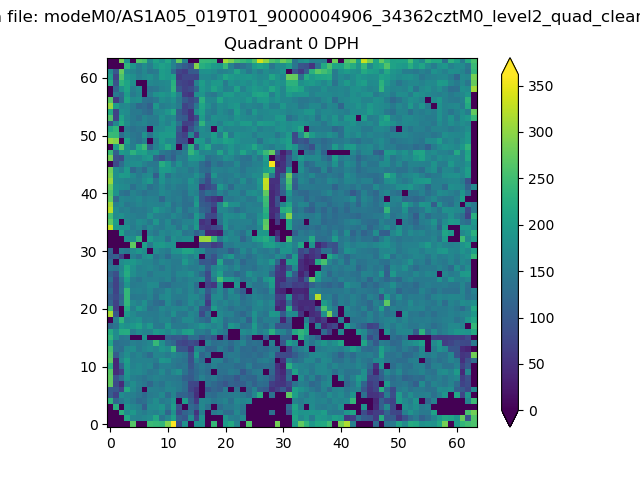 |
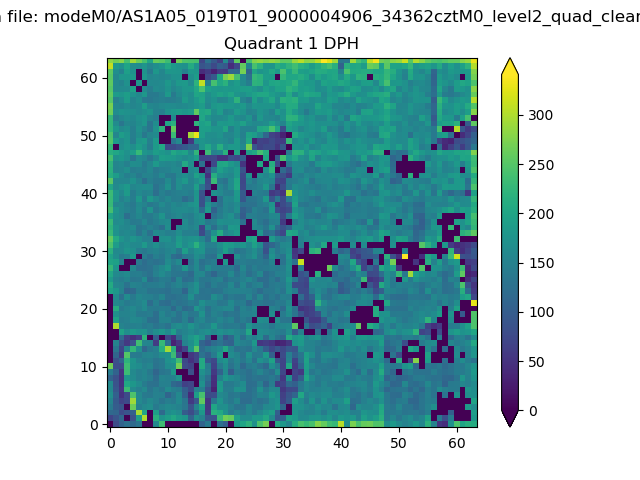 |
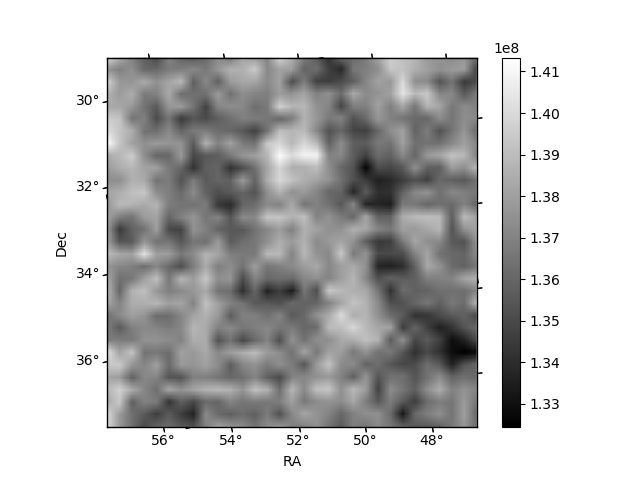
Quadrant B |
|---|---|---|---|
| Quadrant D | 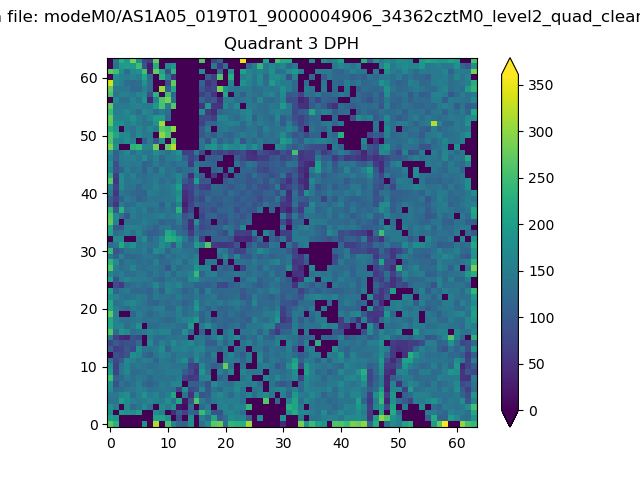 |
 |
Quadrant C |
| Plot type | Count rate plots | Images |
|---|---|---|
| Comparison with Poisson distribution Blue bars denote a histogram of data divided into 1 sec bins. Red curve is a Poisson curve with rate = median count rate of data. |
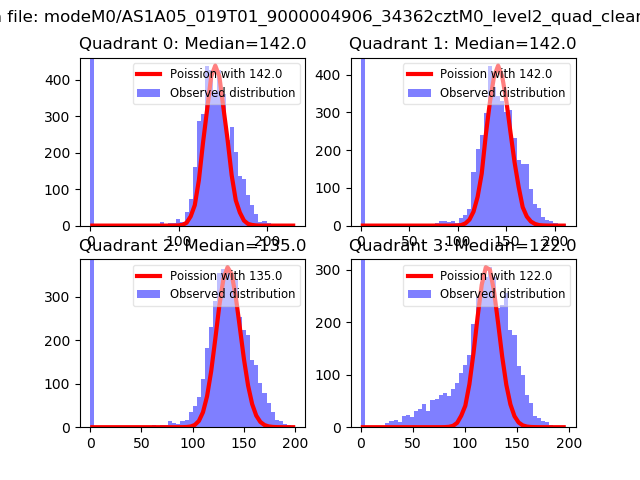 |
 |
| Quadrant-wise count rates Data is divided into 100 sec bins |
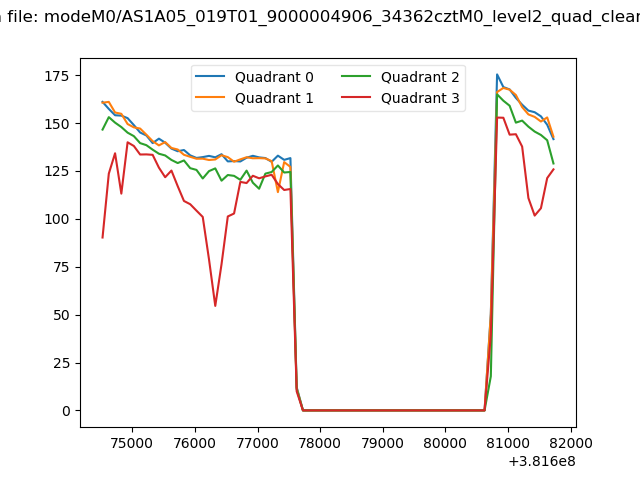 |
|
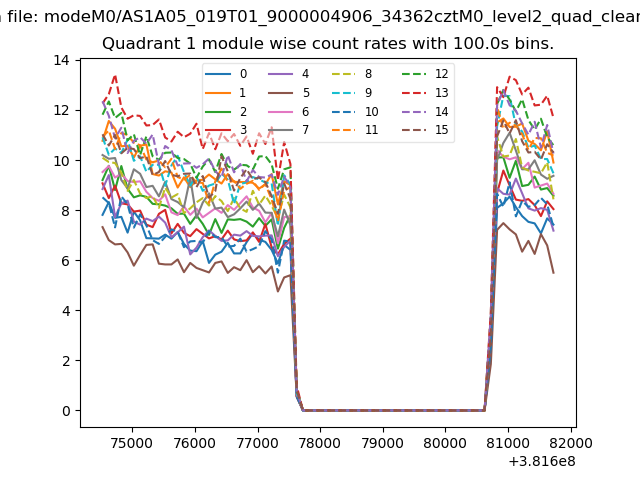
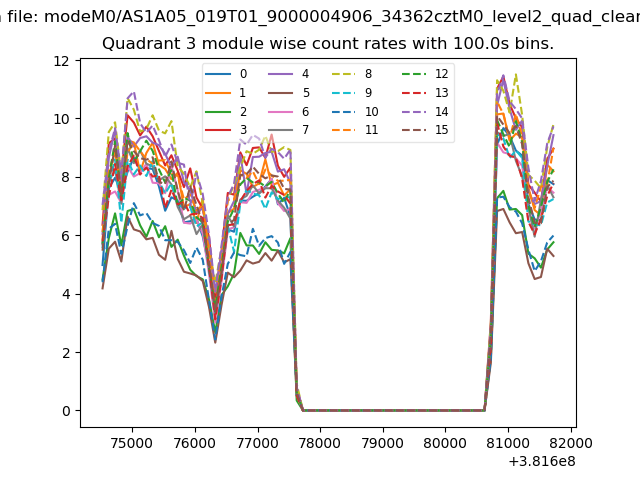
| Module-wise count rates for Quadrant A Data is divided into 100 sec bins |
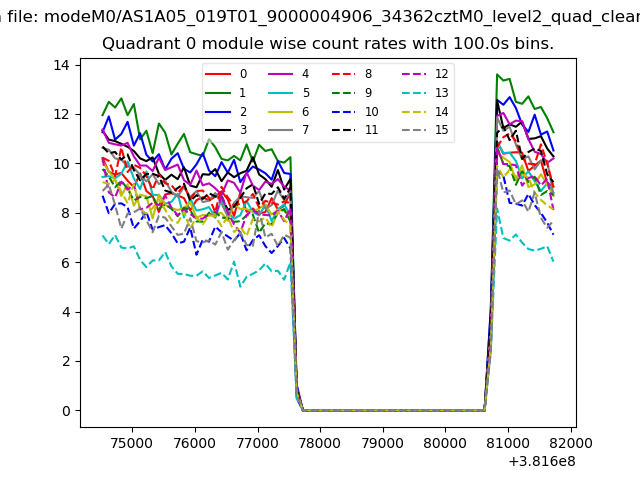 |
 |
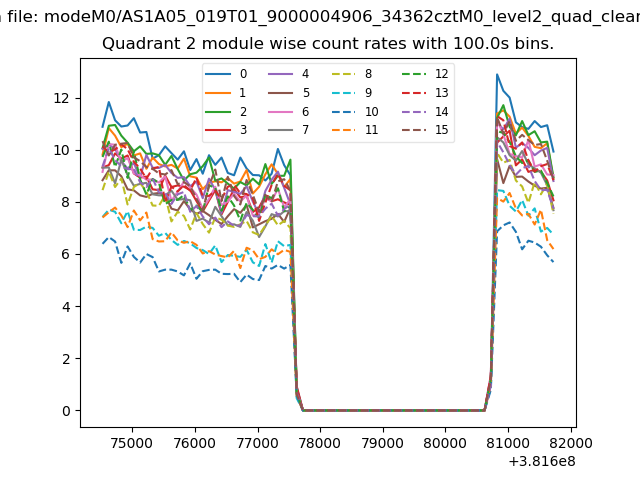
| Module-wise count rates for Quadrant B Data is divided into 100 sec bins |
 |
 |
| Module-wise count rates for Quadrant C Data is divided into 100 sec bins |
 |
 |
| Module-wise count rates for Quadrant D Data is divided into 100 sec bins |
 |
 |
| Parameter | Plot |
|---|---|
| CZT HV Monitor |  |
| D_VDD | 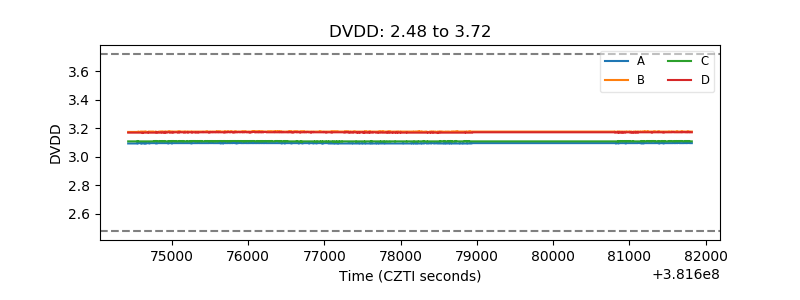 |
| Temperature 1 | 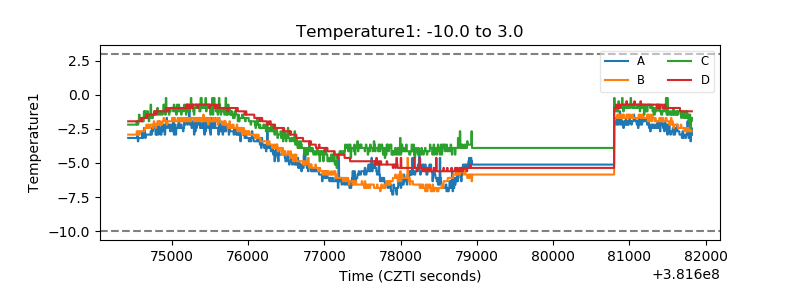 |
| Veto HV Monitor | 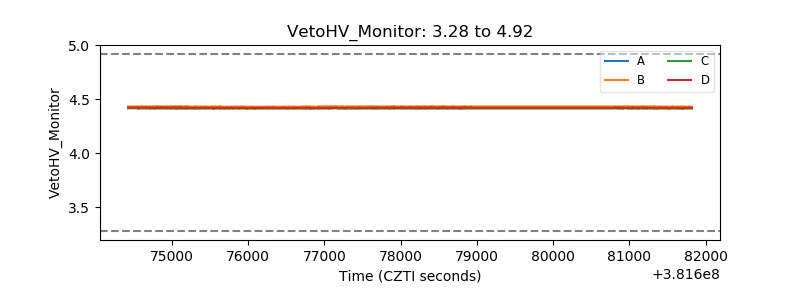 |
| Veto LLD | 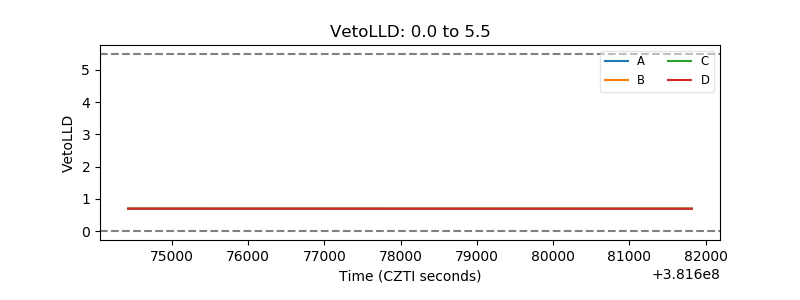 |
| Alpha Counter | 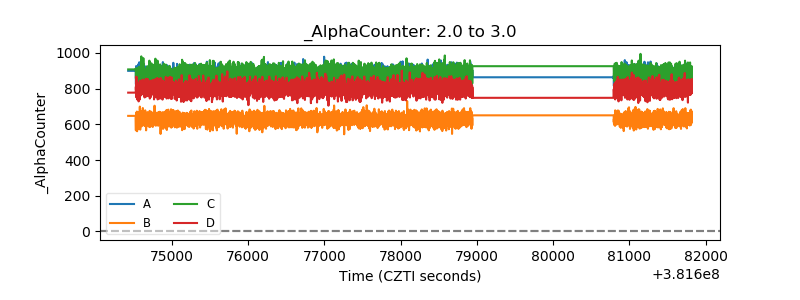 |
| _CPM_Rate | 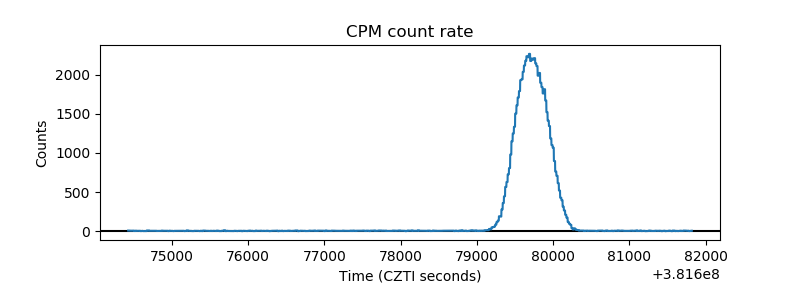 |
| CZT Counter | 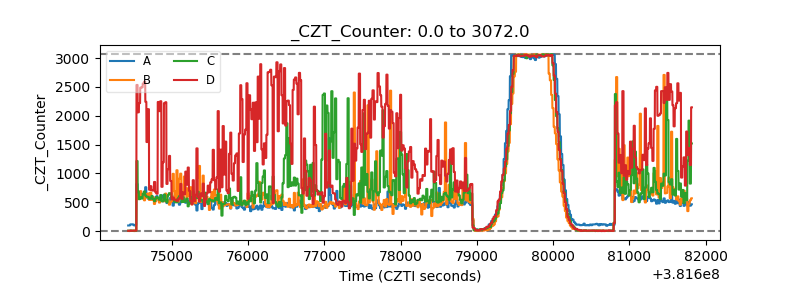 |
| +2.5 Volts monitor | 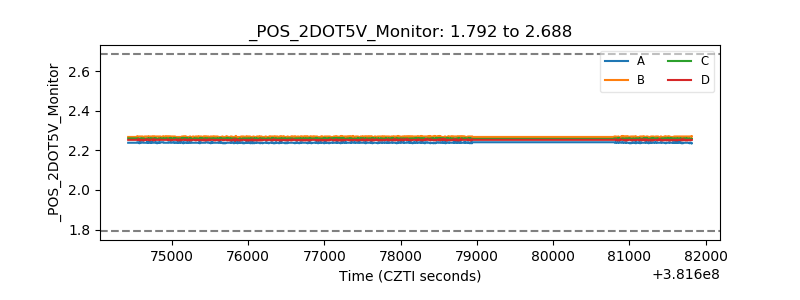 |
| +5 Volts monitor | 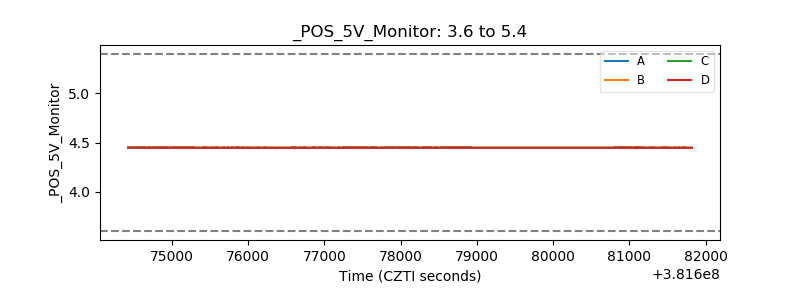 |
| _ROLL_ROT | 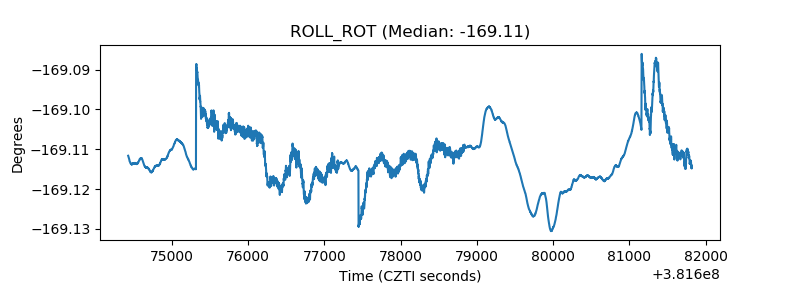 |
| _Roll_DEC | 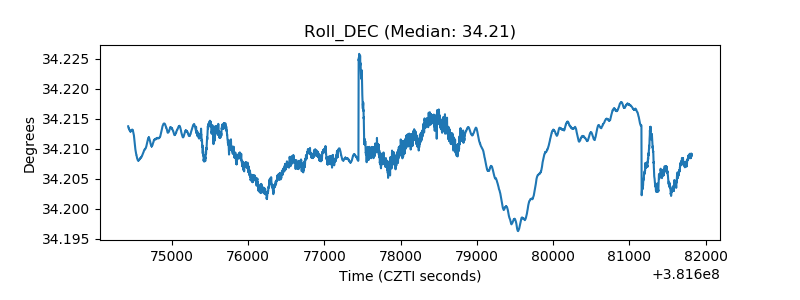 |
| _Roll_RA | 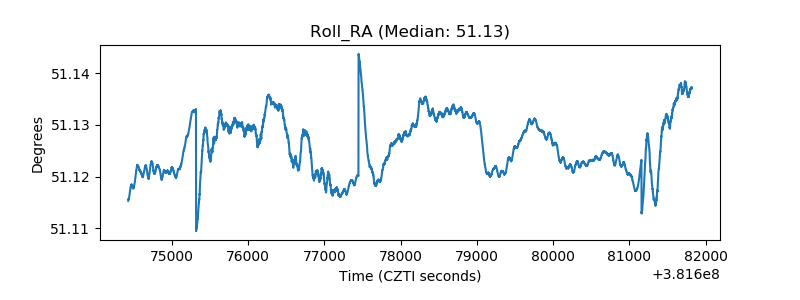 |
| Veto Counter | 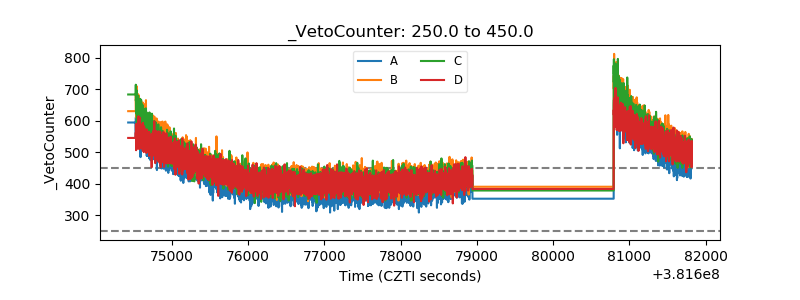 |