| Param | Original file | Final file |
|---|---|---|
| Filename | modeM0/AS1A05_019T01_9000004906_34358cztM0_level2.evt | modeM0/AS1A05_019T01_9000004906_34358cztM0_level2_quad_clean.evt |
| Size (bytes) | 1,874,917,440 | 206,392,320 |
| Size | 1.7 GB | 196.8 MB |
| Events in quadrant A | 7,223,154 | 1,453,035 |
| Events in quadrant B | 9,074,705 | 1,448,528 |
| Events in quadrant C | 8,655,001 | 1,435,863 |
| Events in quadrant D | 30,773,347 | 827,405 |
| Mode SS | |||
|---|---|---|---|
| Quadrant | BADHDUFLAG | Total packets | Discarded packets |
| A | 0 | 320 | 0 |
| B | 0 | 320 | 0 |
| C | 0 | 320 | 0 |
| D | 0 | 320 | 0 |
| Mode M0 | |||
|---|---|---|---|
| Quadrant | BADHDUFLAG | Total packets | Discarded packets |
| A | 0 | 31739 | 5 |
| B | 0 | 36987 | 4 |
| C | 0 | 34807 | 4 |
| D | 0 | 102053 | 4 |
| Mode M9 | |||
|---|---|---|---|
| Quadrant | BADHDUFLAG | Total packets | Discarded packets |
| A | 0 | 53 | 0 |
| B | 0 | 53 | 0 |
| C | 0 | 53 | 0 |
| D | 0 | 54 | 0 |
| Quadrant | Total seconds | Saturated seconds | Saturation percentage |
|---|---|---|---|
| A | 15692 | 26 | 0.165690% |
| B | 15692 | 342 | 2.179454% |
| C | 15692 | 150 | 0.955901% |
| D | 15692 | 9248 | 58.934489% |
Noise dominated data is calculated using 1-second bins in cleaned event files. If a bin has >2000 counts, and if more than 50% of those come from <1% of pixels, then it is considered to be noise-dominated and hence unusable.
| Quadrant | # 1 sec bins | Bins with >0 counts | Bins with >2000 counts | High rate bins dominated by noise | Noise dominated (total time) | Noise dominated (detector-on time) | Marked lightcurve |
|---|---|---|---|---|---|---|---|
| A | 19872 | 15695 | 4 | 4 | 0.02% | 0.03% | 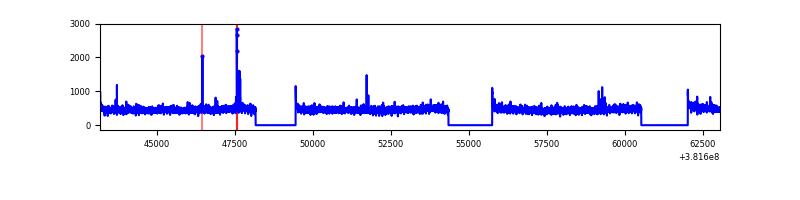 |
| B | 19872 | 15695 | 235 | 235 | 1.18% | 1.50% | 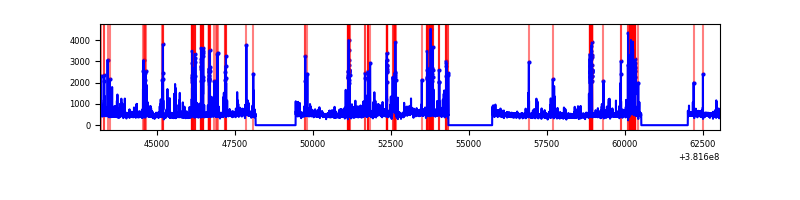 |
| C | 19872 | 15695 | 122 | 122 | 0.61% | 0.78% | 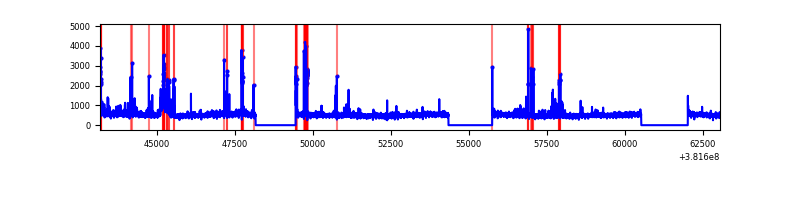 |
| D | 19872 | 15694 | 8728 | 8728 | 43.92% | 55.61% | 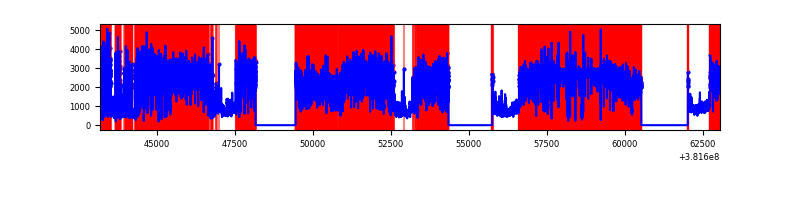 |
Top three noisy pixels from each quadrant. If the there are fewer than three noisy pixels in the level2.evt file, extra rows are filled as -1
| Pixel properties | Quadrant properties | ||||||
|---|---|---|---|---|---|---|---|
| Quadrant | DetID | PixID | Counts | Sigma | Mean | Median | Sigma |
| A | 10 | 83 | 68875 | 182.93 | 1831 | 1790 | 366.7 |
| A | 9 | 143 | 46024 | 120.62 | 1831 | 1790 | 366.7 |
| A | 13 | 6 | 38493 | 100.08 | 1831 | 1790 | 366.7 |
| B | 5 | 172 | 1059866 | 3060.72 | 1804 | 1757 | 345.7 |
| B | 0 | 190 | 463623 | 1336.01 | 1804 | 1757 | 345.7 |
| B | 0 | 245 | 91186 | 258.68 | 1804 | 1757 | 345.7 |
| C | 15 | 214 | 652140 | 1579.22 | 1773 | 1786 | 411.8 |
| C | 14 | 254 | 619300 | 1499.47 | 1773 | 1786 | 411.8 |
| C | 3 | 233 | 179949 | 432.62 | 1773 | 1786 | 411.8 |
| D | 7 | 223 | 22009831 | 68795.91 | 1312 | 1275 | 319.9 |
| D | 8 | 195 | 2189821 | 6841.11 | 1312 | 1275 | 319.9 |
| D | 2 | 250 | 314054 | 977.71 | 1312 | 1275 | 319.9 |
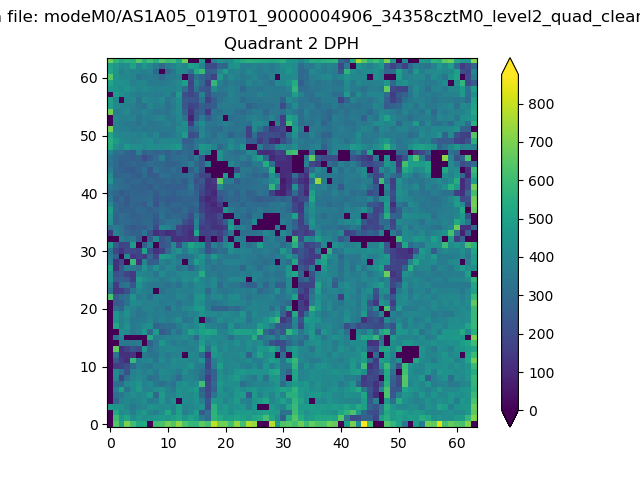
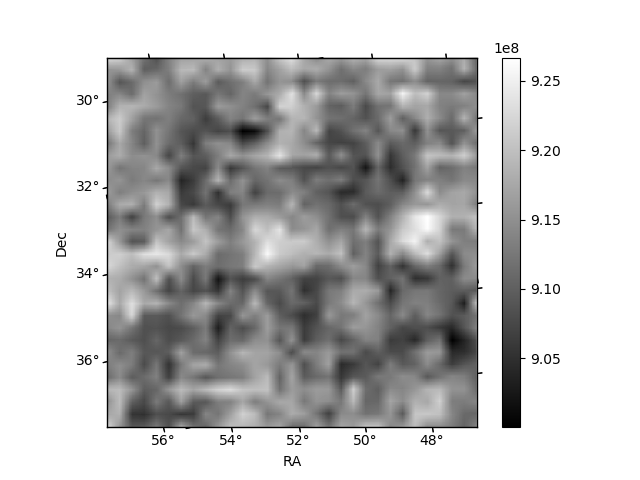
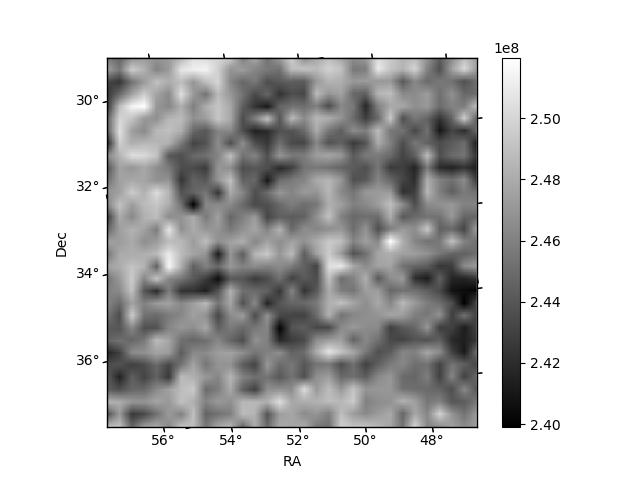
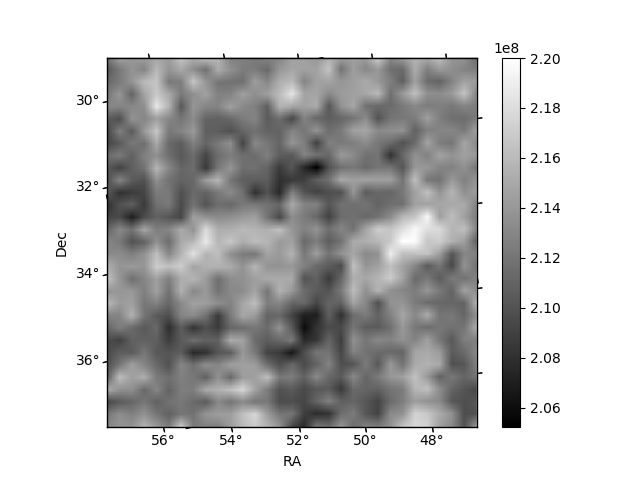
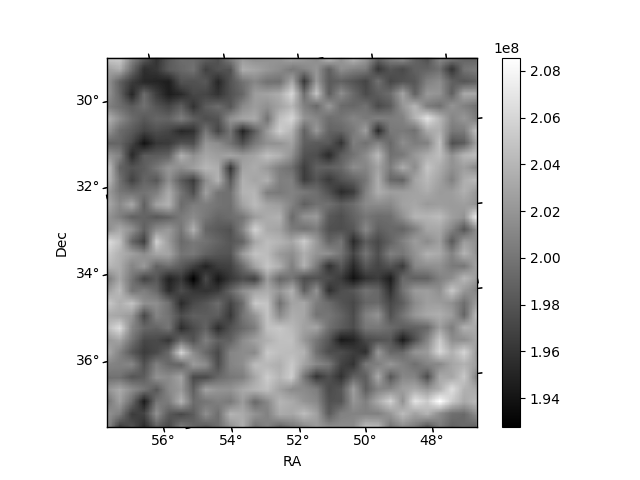
Histogram calculated using DETX and DETY for each event in the final _common_clean file
| Quadrant A | 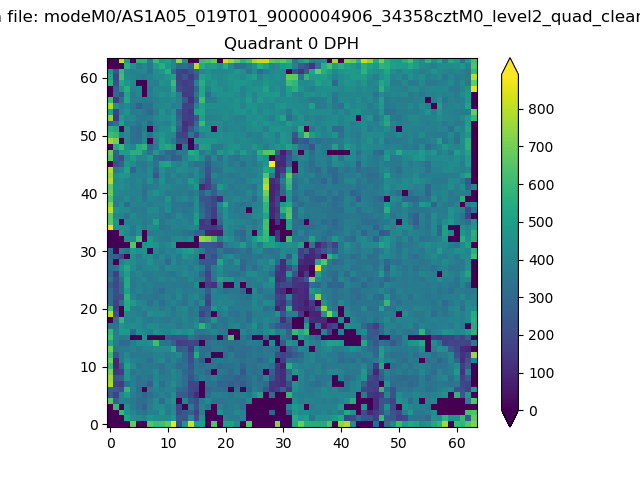 |
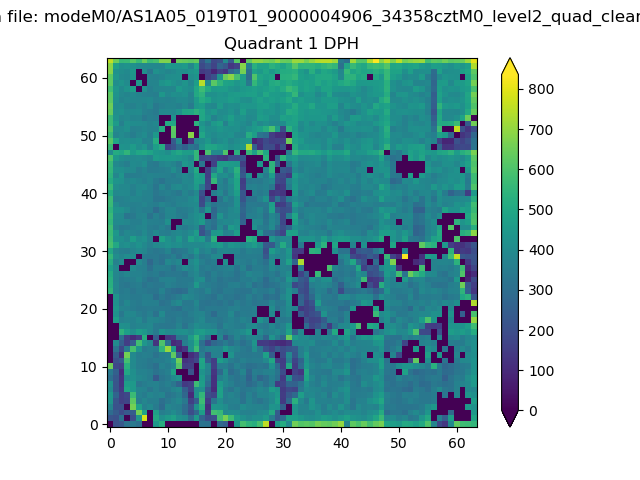 |
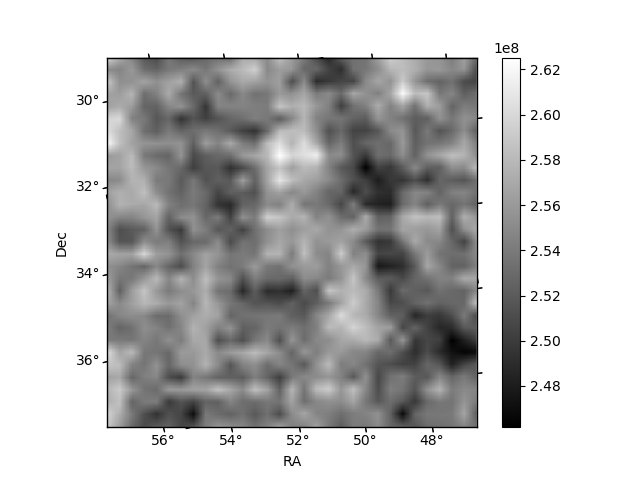
Quadrant B |
|---|---|---|---|
| Quadrant D | 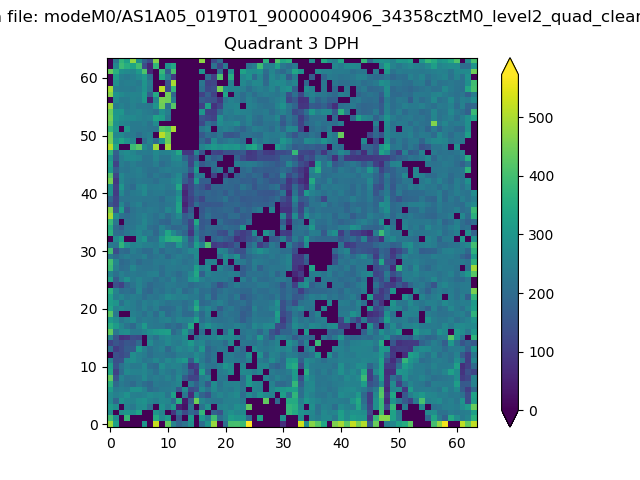 |
 |
Quadrant C |
| Plot type | Count rate plots | Images |
|---|---|---|
| Comparison with Poisson distribution Blue bars denote a histogram of data divided into 1 sec bins. Red curve is a Poisson curve with rate = median count rate of data. |
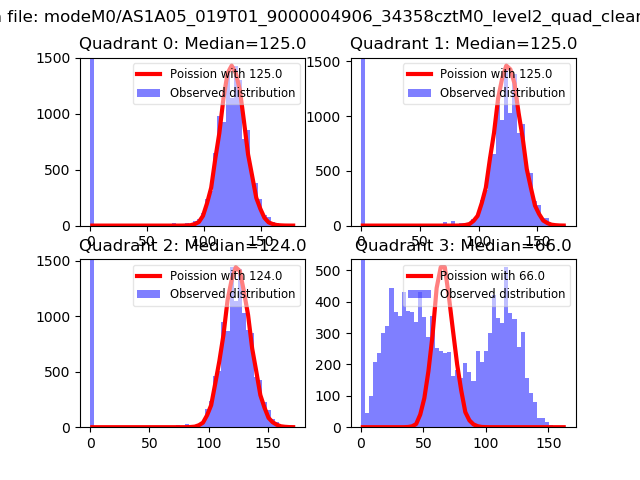 |
 |
| Quadrant-wise count rates Data is divided into 100 sec bins |
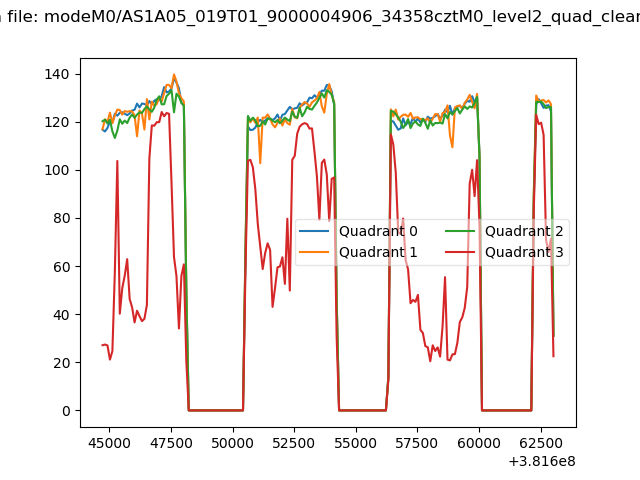 |
|
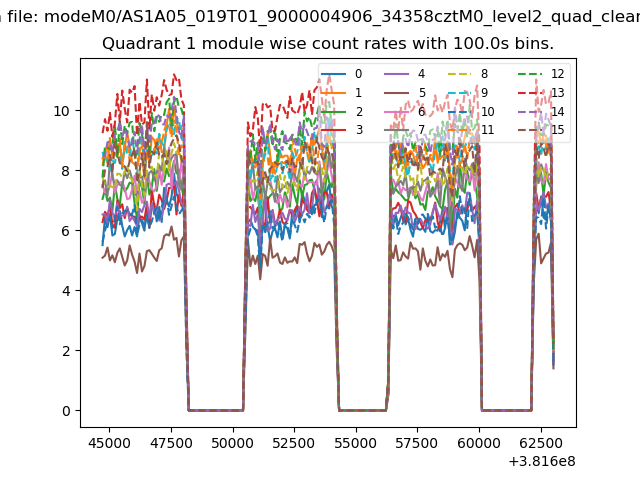
| Module-wise count rates for Quadrant A Data is divided into 100 sec bins |
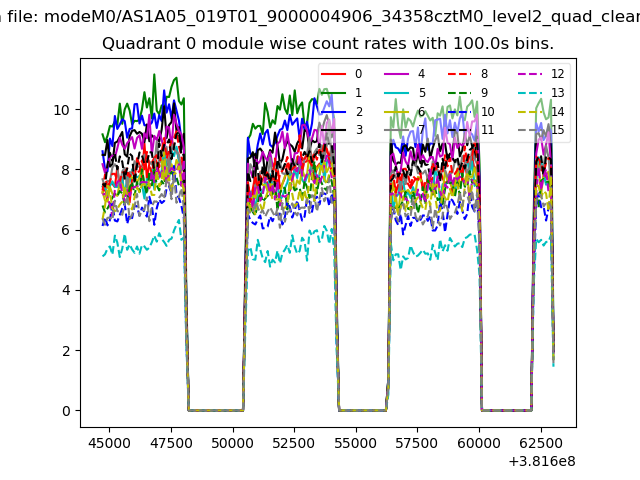 |
 |
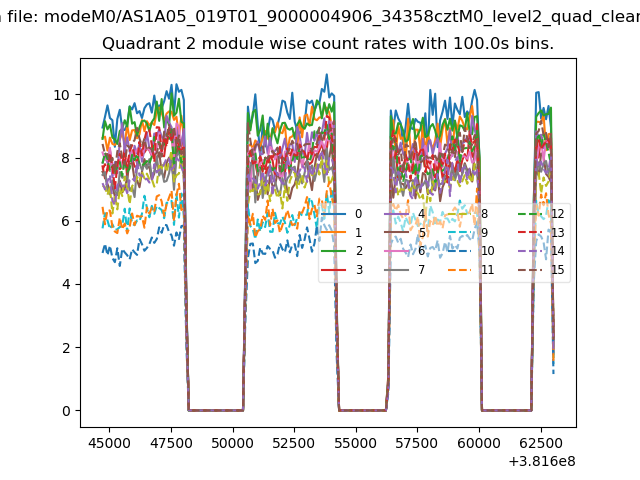
| Module-wise count rates for Quadrant B Data is divided into 100 sec bins |
 |
 |
| Module-wise count rates for Quadrant C Data is divided into 100 sec bins |
 |
 |
| Module-wise count rates for Quadrant D Data is divided into 100 sec bins |
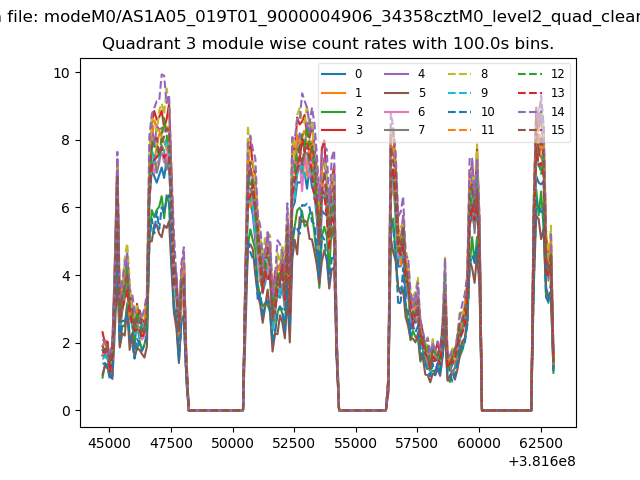 |
 |
| Parameter | Plot |
|---|---|
| CZT HV Monitor | 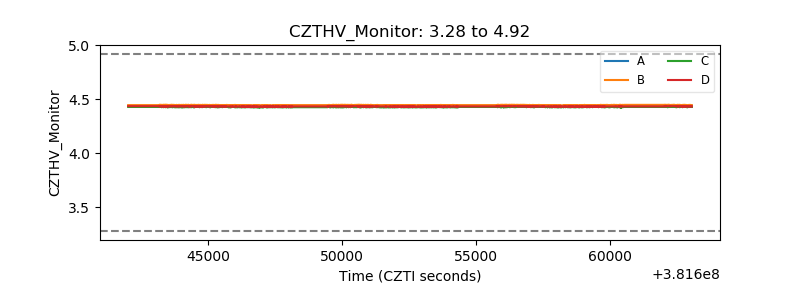 |
| D_VDD | 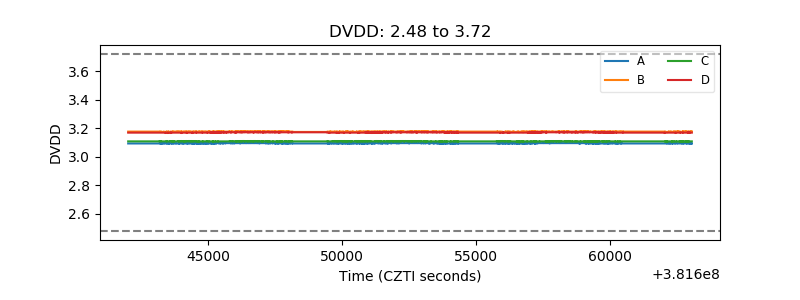 |
| Temperature 1 | 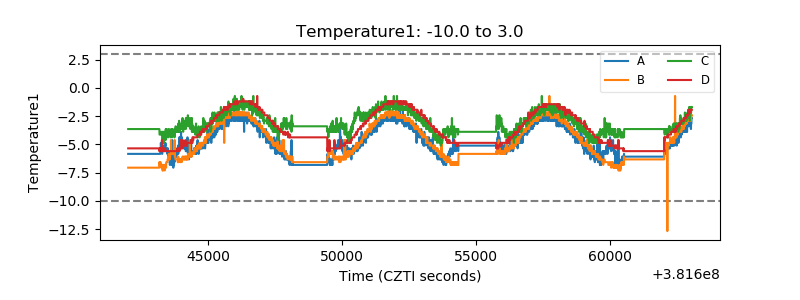 |
| Veto HV Monitor | 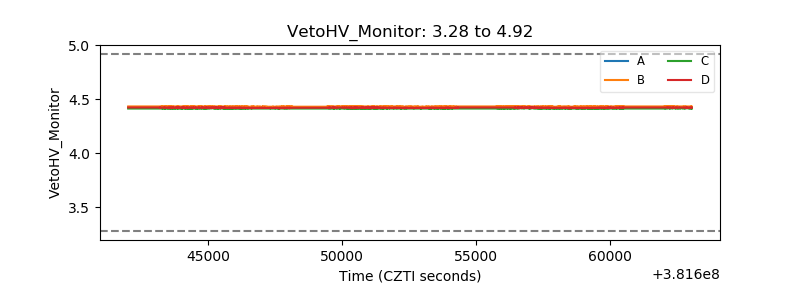 |
| Veto LLD | 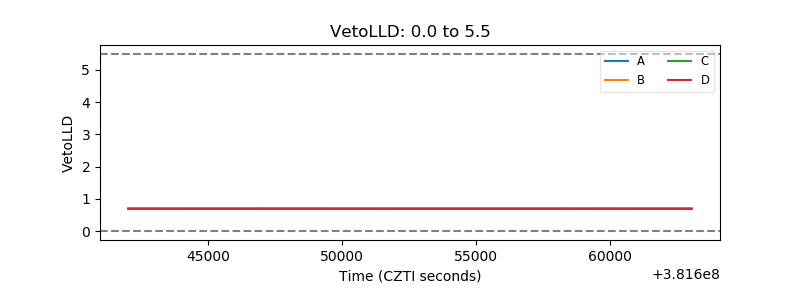 |
| Alpha Counter | 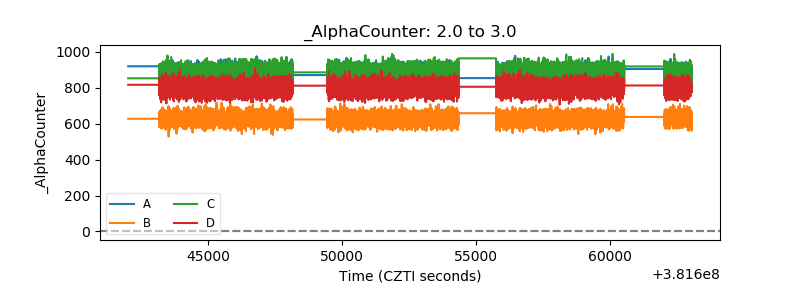 |
| _CPM_Rate | 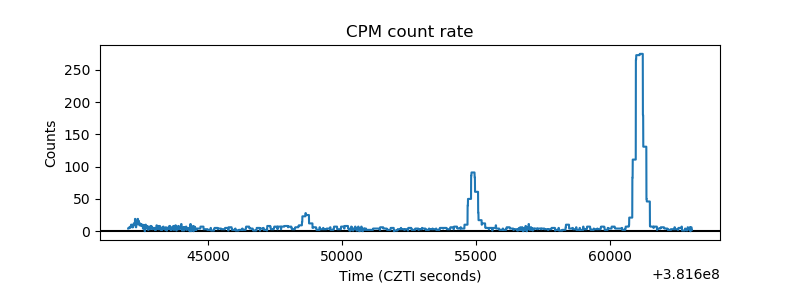 |
| CZT Counter | 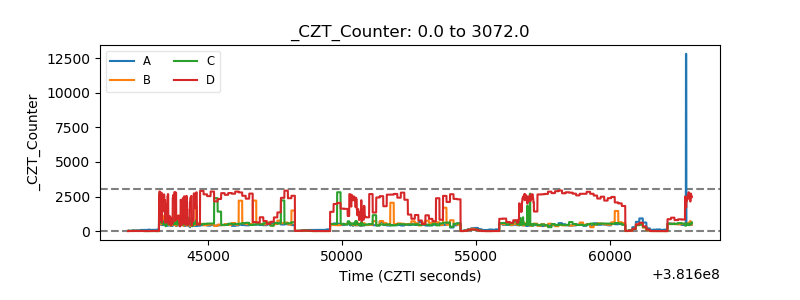 |
| +2.5 Volts monitor | 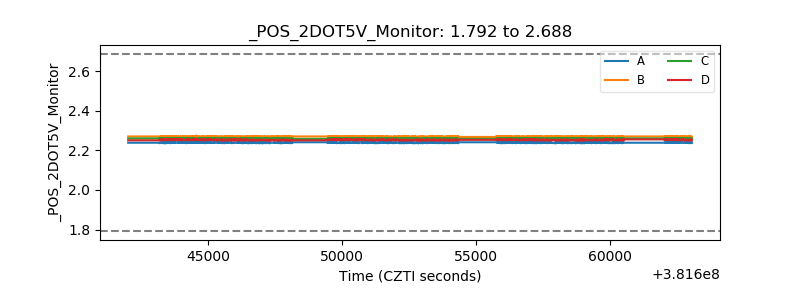 |
| +5 Volts monitor | 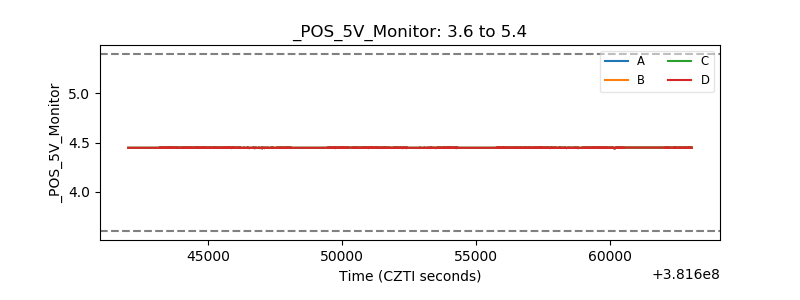 |
| _ROLL_ROT | 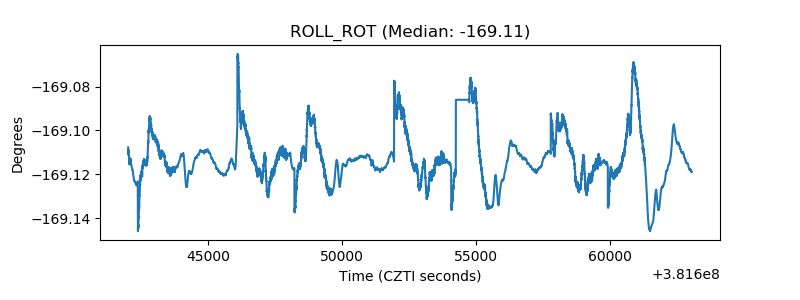 |
| _Roll_DEC | 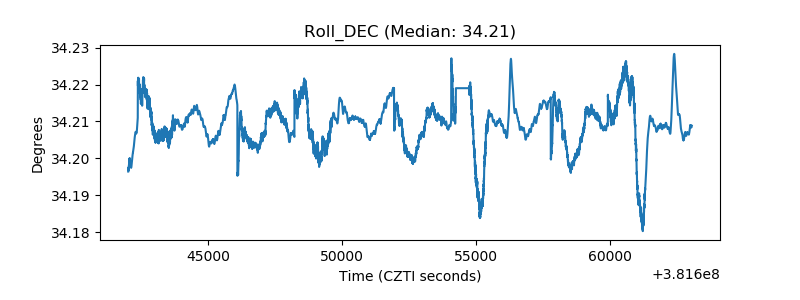 |
| _Roll_RA | 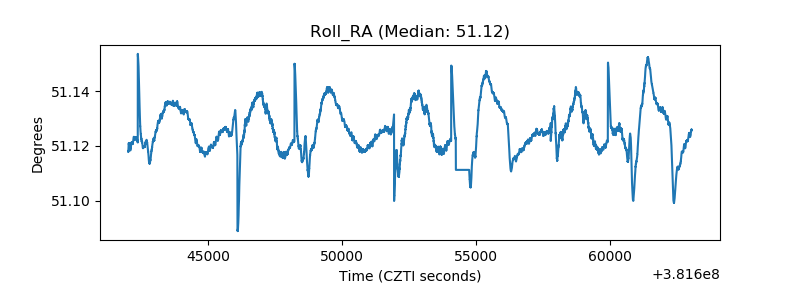 |
| Veto Counter | 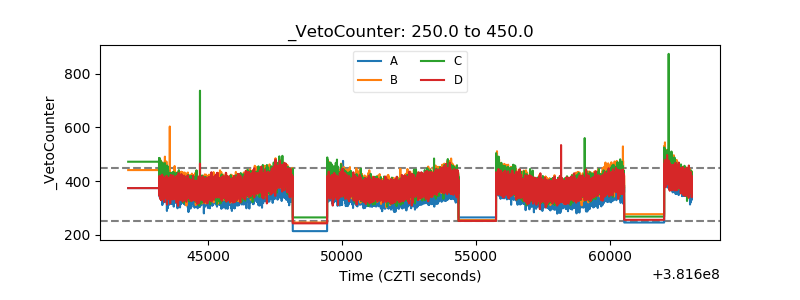 |