| Param | Original file | Final file |
|---|---|---|
| Filename | modeM0/AS1A05_019T01_9000004906_34353cztM0_level2.evt | modeM0/AS1A05_019T01_9000004906_34353cztM0_level2_quad_clean.evt |
| Size (bytes) | 667,938,240 | 53,349,120 |
| Size | 637.0 MB | 50.9 MB |
| Events in quadrant A | 2,424,174 | 338,250 |
| Events in quadrant B | 3,871,443 | 332,617 |
| Events in quadrant C | 2,958,407 | 331,900 |
| Events in quadrant D | 10,614,257 | 238,961 |
| Mode SS | |||
|---|---|---|---|
| Quadrant | BADHDUFLAG | Total packets | Discarded packets |
| A | 0 | 108 | 0 |
| B | 0 | 108 | 0 |
| C | 0 | 108 | 0 |
| D | 0 | 108 | 0 |
| Mode M0 | |||
|---|---|---|---|
| Quadrant | BADHDUFLAG | Total packets | Discarded packets |
| A | 0 | 10759 | 3 |
| B | 0 | 15012 | 2 |
| C | 0 | 11891 | 2 |
| D | 0 | 35172 | 2 |
| Mode M9 | |||
|---|---|---|---|
| Quadrant | BADHDUFLAG | Total packets | Discarded packets |
| A | 0 | 31 | 0 |
| B | 0 | 31 | 0 |
| C | 0 | 31 | 0 |
| D | 0 | 32 | 0 |
| Quadrant | Total seconds | Saturated seconds | Saturation percentage |
|---|---|---|---|
| A | 5322 | 5 | 0.093950% |
| B | 5322 | 344 | 6.463735% |
| C | 5322 | 58 | 1.089816% |
| D | 5322 | 3426 | 64.374295% |
Noise dominated data is calculated using 1-second bins in cleaned event files. If a bin has >2000 counts, and if more than 50% of those come from <1% of pixels, then it is considered to be noise-dominated and hence unusable.
| Quadrant | # 1 sec bins | Bins with >0 counts | Bins with >2000 counts | High rate bins dominated by noise | Noise dominated (total time) | Noise dominated (detector-on time) | Marked lightcurve |
|---|---|---|---|---|---|---|---|
| A | 7084 | 5323 | 0 | 0 | 0.00% | 0.00% | 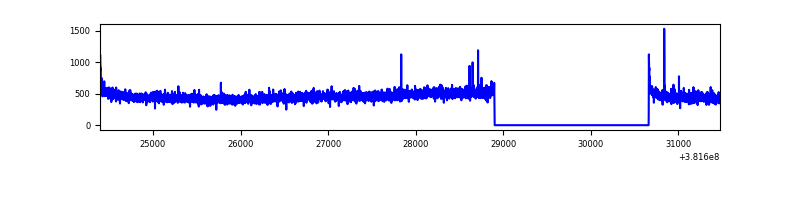 |
| B | 7084 | 5323 | 219 | 219 | 3.09% | 4.11% | 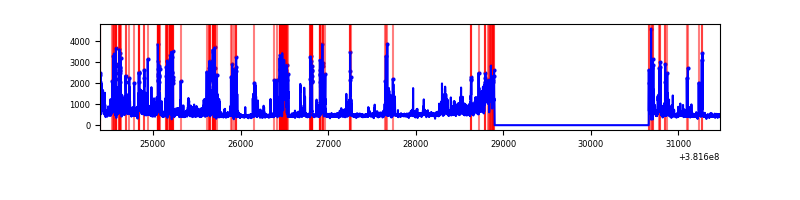 |
| C | 7084 | 5323 | 41 | 41 | 0.58% | 0.77% | 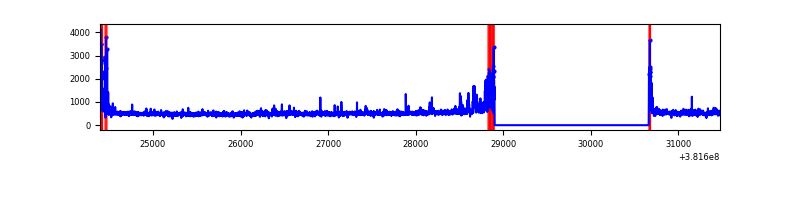 |
| D | 7084 | 5323 | 3284 | 3284 | 46.36% | 61.69% | 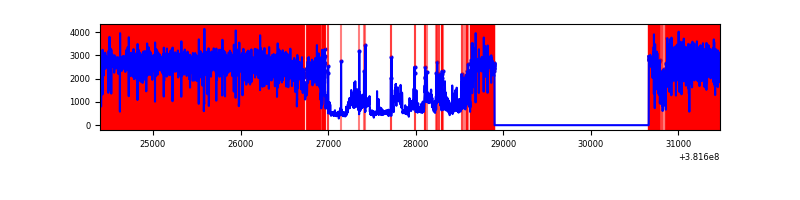 |
Top three noisy pixels from each quadrant. If the there are fewer than three noisy pixels in the level2.evt file, extra rows are filled as -1
| Pixel properties | Quadrant properties | ||||||
|---|---|---|---|---|---|---|---|
| Quadrant | DetID | PixID | Counts | Sigma | Mean | Median | Sigma |
| A | 10 | 83 | 30749 | 242.71 | 613 | 601 | 124.2 |
| A | 13 | 6 | 14009 | 107.94 | 613 | 601 | 124.2 |
| A | 13 | 254 | 9319 | 70.19 | 613 | 601 | 124.2 |
| B | 5 | 172 | 937825 | 8101.57 | 600 | 584 | 115.7 |
| B | 5 | 31 | 166562 | 1434.72 | 600 | 584 | 115.7 |
| B | 0 | 219 | 161923 | 1394.62 | 600 | 584 | 115.7 |
| C | 15 | 214 | 223031 | 1591.74 | 600 | 604 | 139.7 |
| C | 3 | 233 | 177781 | 1267.92 | 600 | 604 | 139.7 |
| C | 0 | 10 | 119138 | 848.26 | 600 | 604 | 139.7 |
| D | 7 | 223 | 6621800 | 61017.09 | 440 | 428 | 108.5 |
| D | 8 | 195 | 1174079 | 10815.4 | 440 | 428 | 108.5 |
| D | 12 | 235 | 593794 | 5467.97 | 440 | 428 | 108.5 |
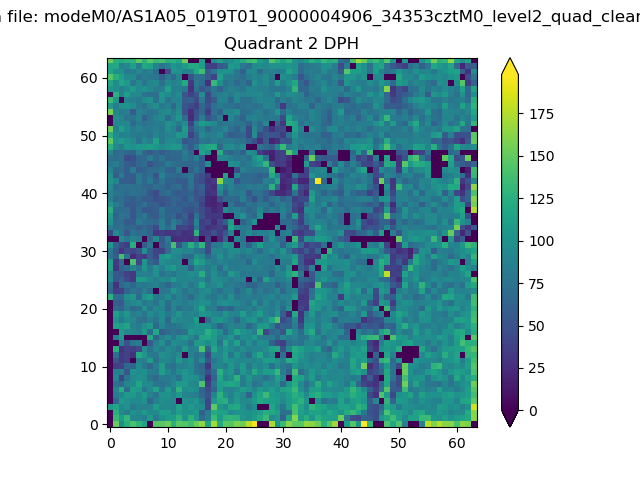
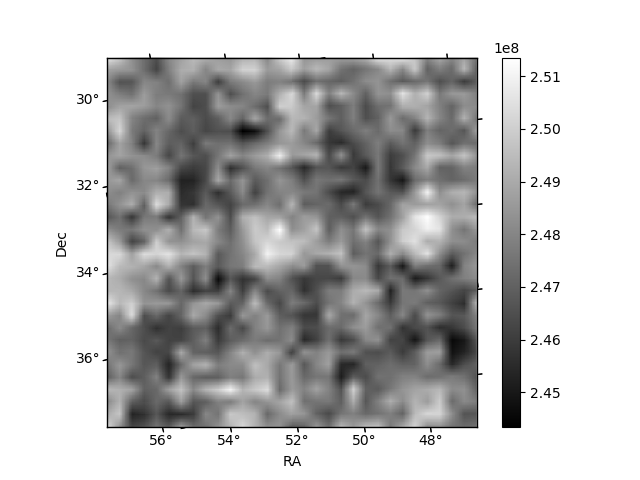
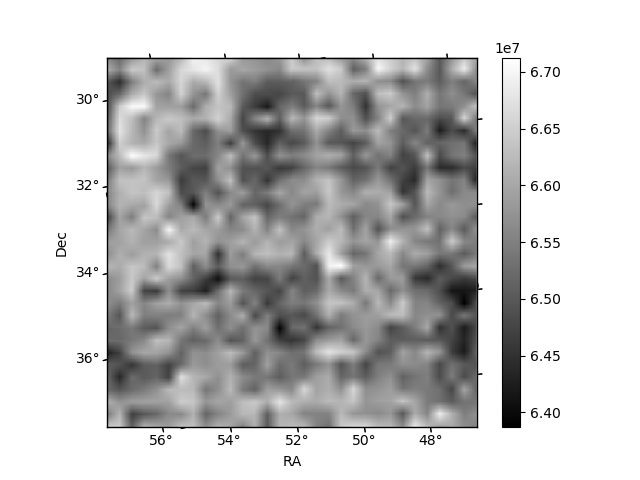
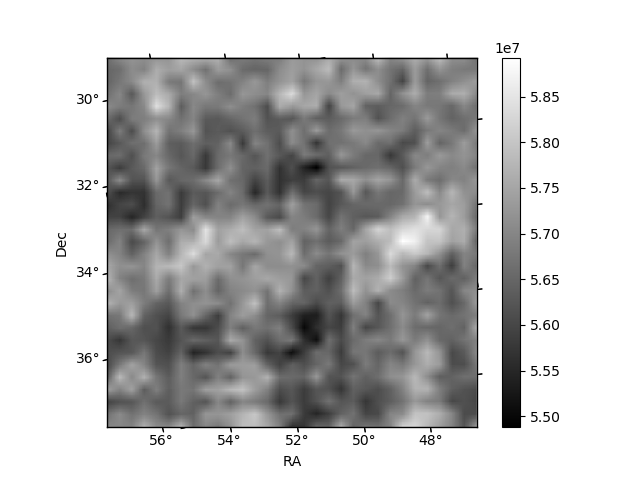
Histogram calculated using DETX and DETY for each event in the final _common_clean file
| Quadrant A | 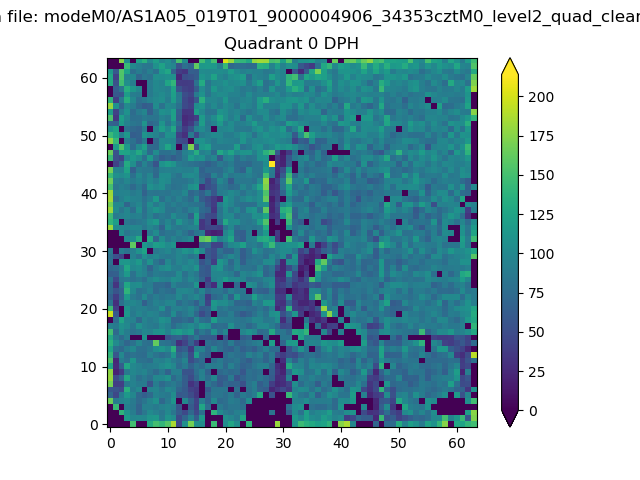 |
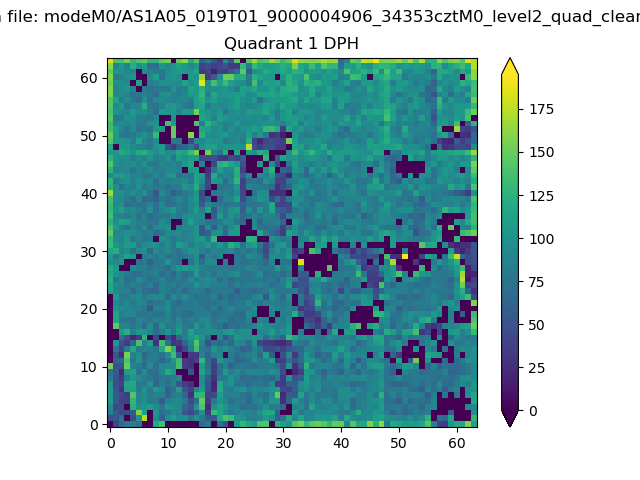 |
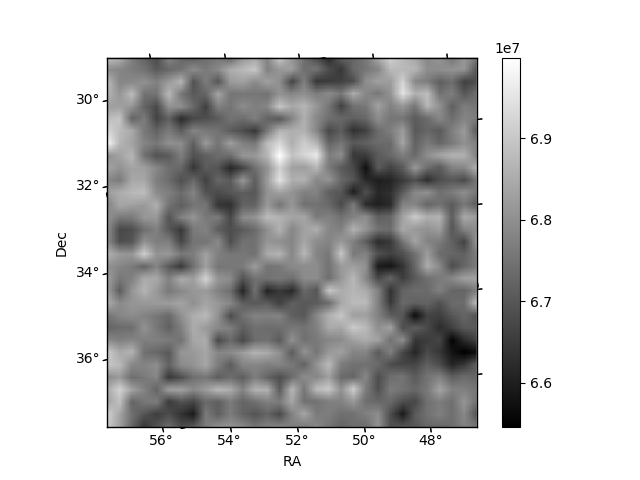
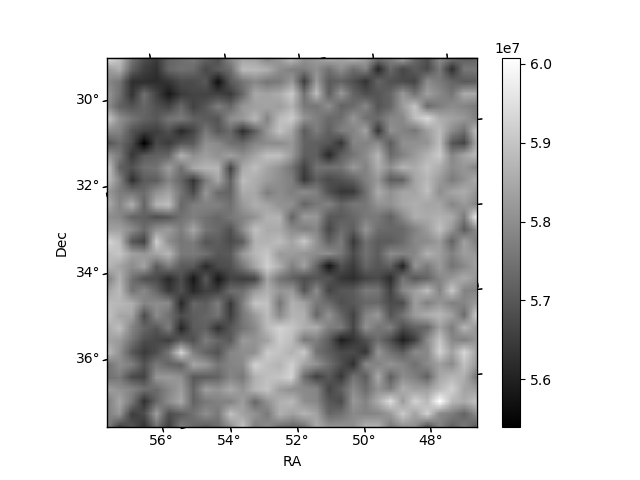
Quadrant B |
|---|---|---|---|
| Quadrant D | 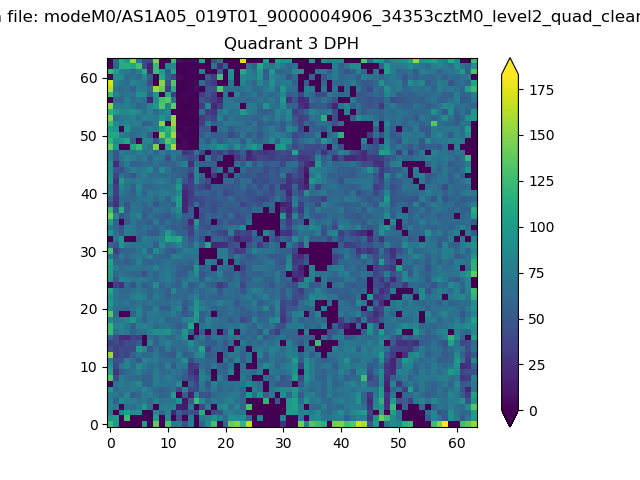 |
 |
Quadrant C |
| Plot type | Count rate plots | Images |
|---|---|---|
| Comparison with Poisson distribution Blue bars denote a histogram of data divided into 1 sec bins. Red curve is a Poisson curve with rate = median count rate of data. |
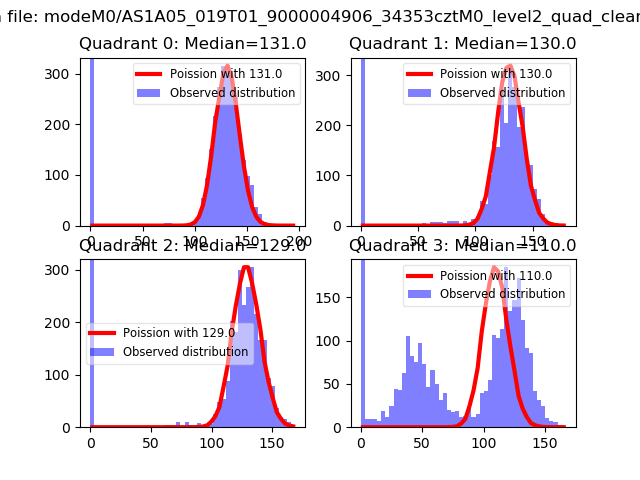 |
 |
| Quadrant-wise count rates Data is divided into 100 sec bins |
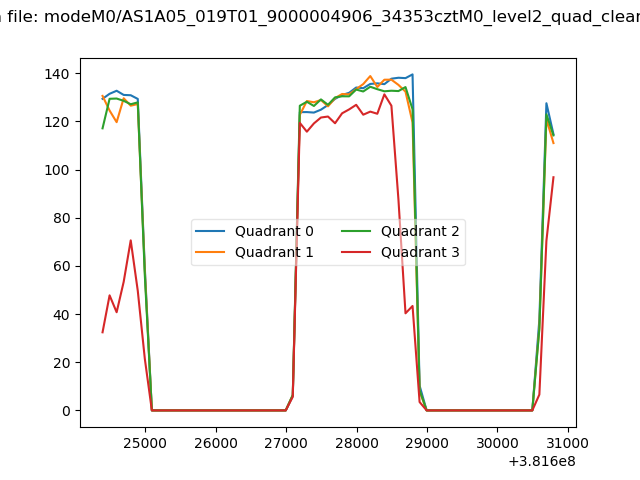 |
|
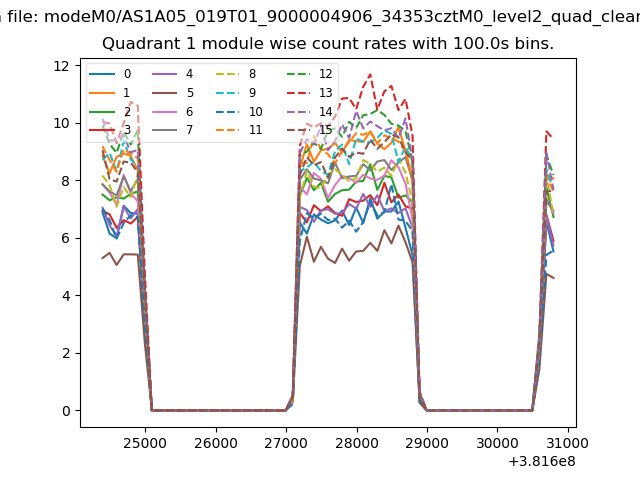
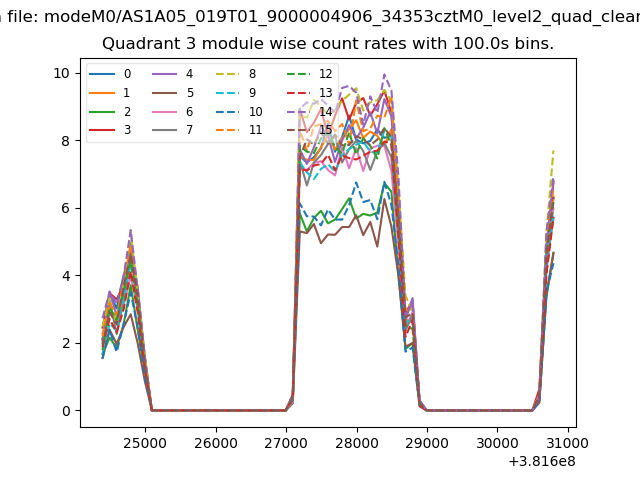
| Module-wise count rates for Quadrant A Data is divided into 100 sec bins |
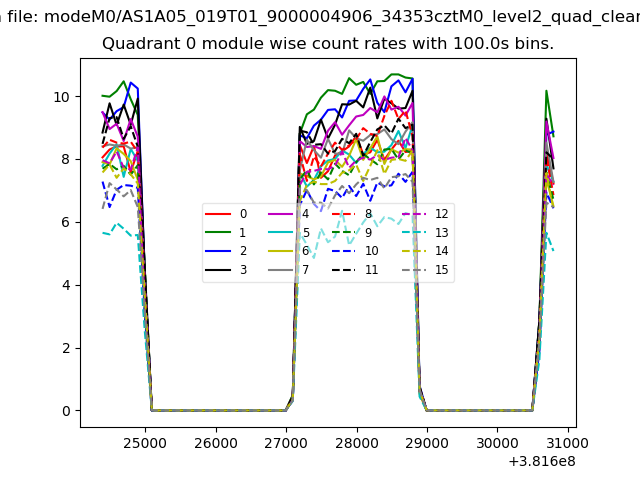 |
 |
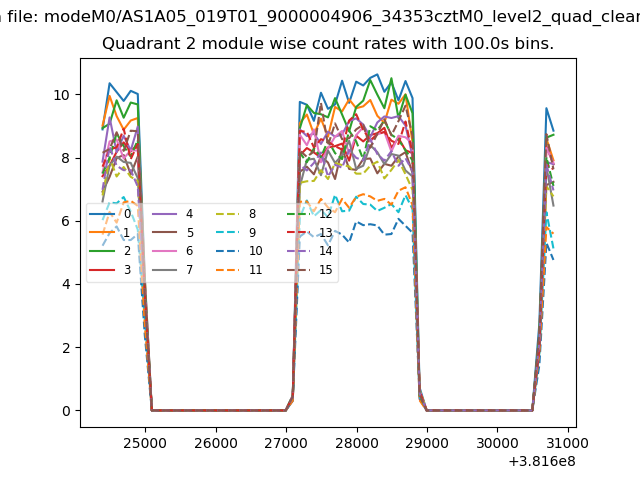
| Module-wise count rates for Quadrant B Data is divided into 100 sec bins |
 |
 |
| Module-wise count rates for Quadrant C Data is divided into 100 sec bins |
 |
 |
| Module-wise count rates for Quadrant D Data is divided into 100 sec bins |
 |
 |
| Parameter | Plot |
|---|---|
| CZT HV Monitor | 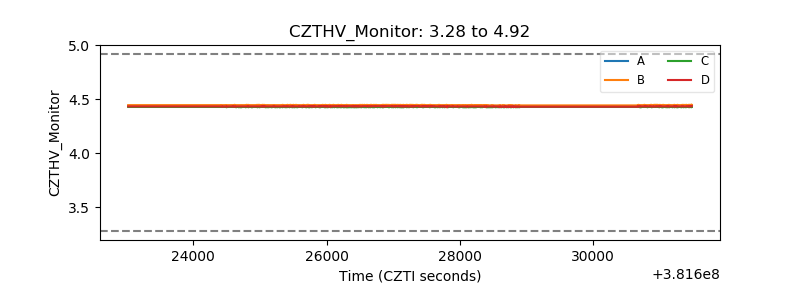 |
| D_VDD | 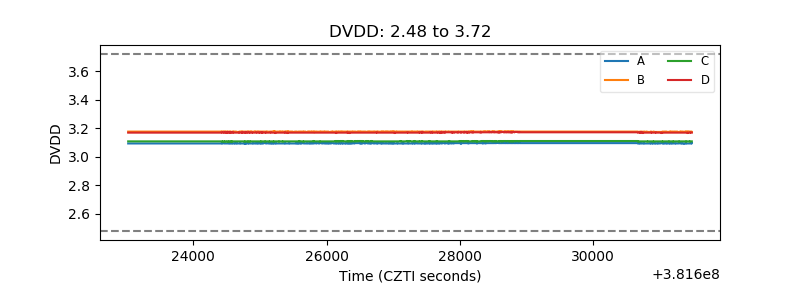 |
| Temperature 1 | 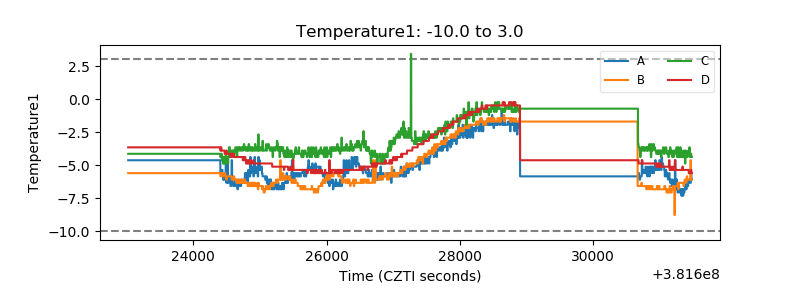 |
| Veto HV Monitor |  |
| Veto LLD | 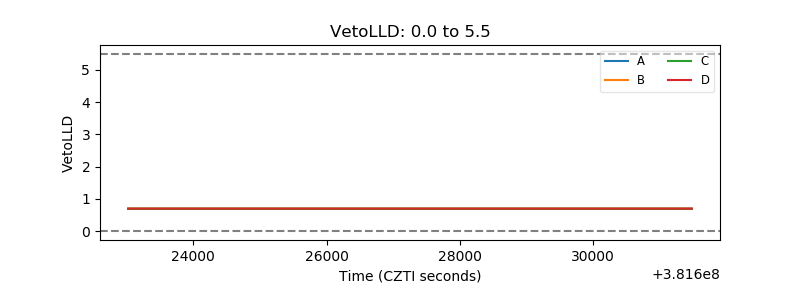 |
| Alpha Counter | 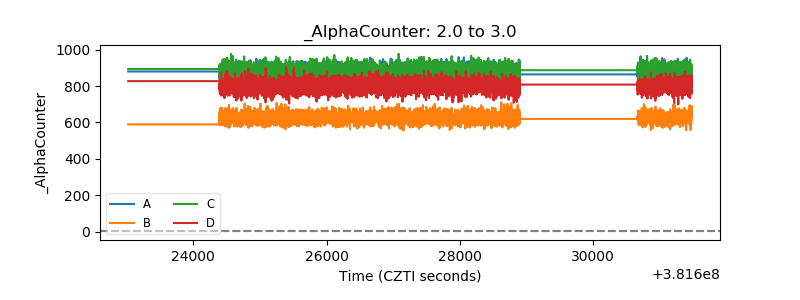 |
| _CPM_Rate | 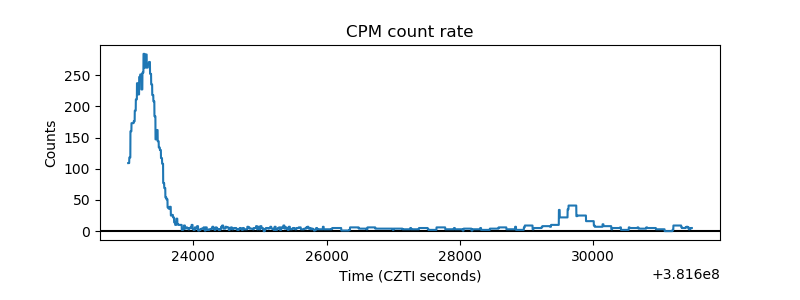 |
| CZT Counter | 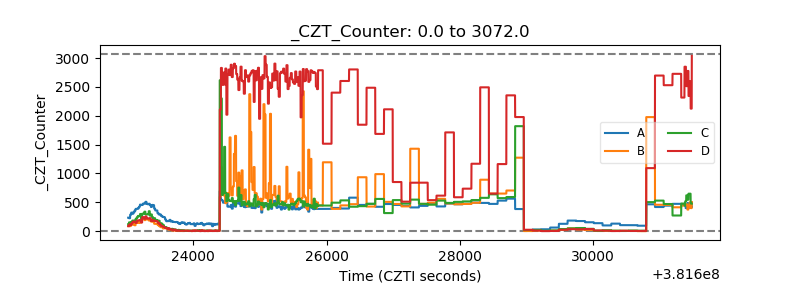 |
| +2.5 Volts monitor | 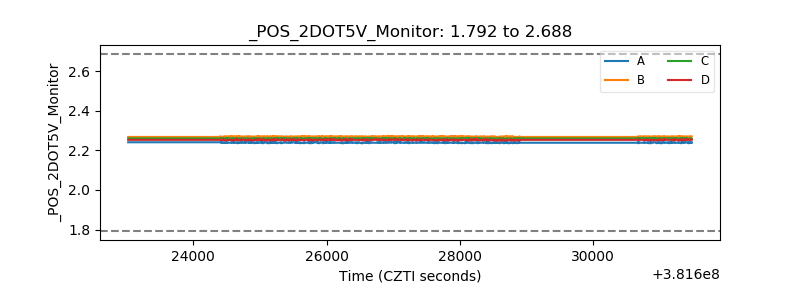 |
| +5 Volts monitor | 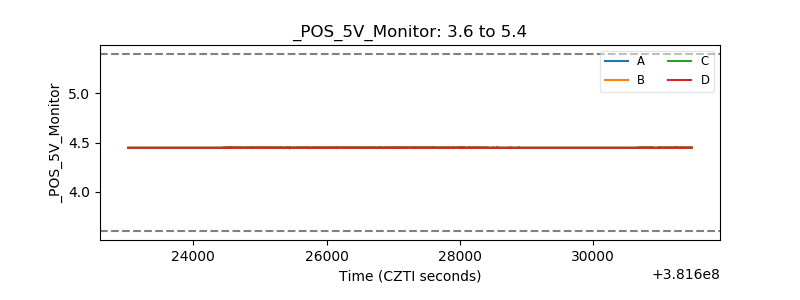 |
| _ROLL_ROT | 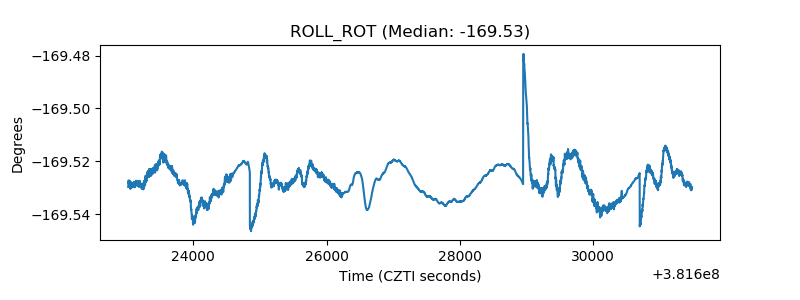 |
| _Roll_DEC | 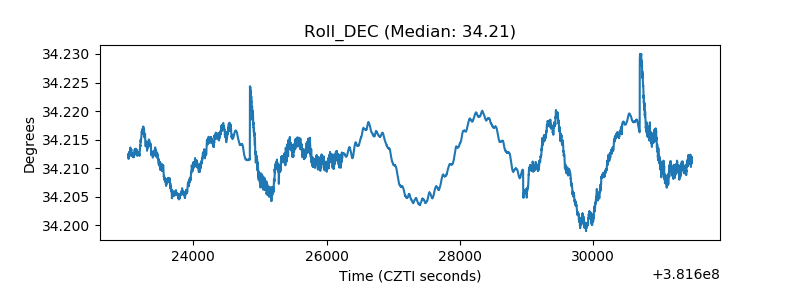 |
| _Roll_RA | 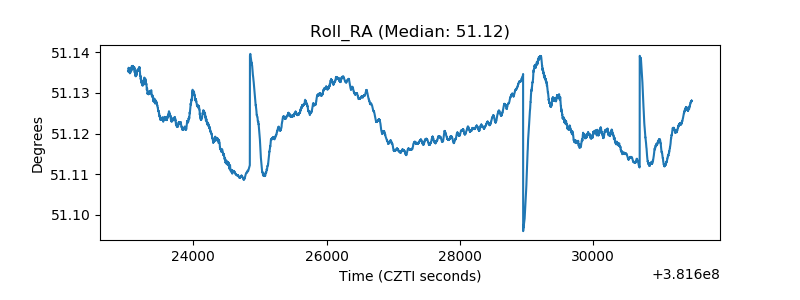 |
| Veto Counter | 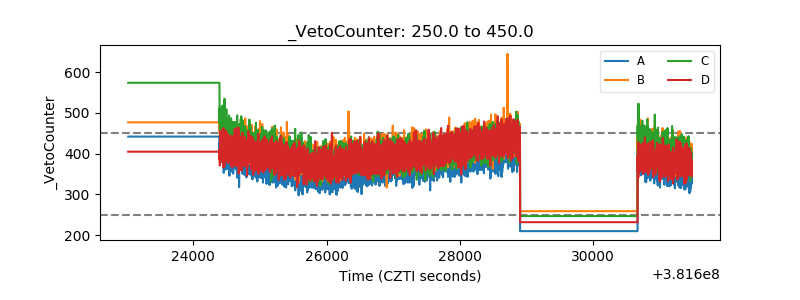 |