| Param | Original file | Final file |
|---|---|---|
| Filename | modeM0/AS1A05_019T01_9000004906_34352cztM0_level2.evt | modeM0/AS1A05_019T01_9000004906_34352cztM0_level2_quad_clean.evt |
| Size (bytes) | 637,116,480 | 54,460,800 |
| Size | 607.6 MB | 51.9 MB |
| Events in quadrant A | 2,317,382 | 369,765 |
| Events in quadrant B | 3,266,881 | 369,684 |
| Events in quadrant C | 3,049,063 | 359,661 |
| Events in quadrant D | 10,323,380 | 198,448 |
| Mode SS | |||
|---|---|---|---|
| Quadrant | BADHDUFLAG | Total packets | Discarded packets |
| A | 0 | 102 | 0 |
| B | 0 | 102 | 0 |
| C | 0 | 102 | 0 |
| D | 0 | 102 | 0 |
| Mode M0 | |||
|---|---|---|---|
| Quadrant | BADHDUFLAG | Total packets | Discarded packets |
| A | 0 | 10142 | 2 |
| B | 0 | 12847 | 1 |
| C | 0 | 12031 | 1 |
| D | 0 | 34088 | 1 |
| Mode M9 | |||
|---|---|---|---|
| Quadrant | BADHDUFLAG | Total packets | Discarded packets |
| A | 0 | 37 | 0 |
| B | 0 | 37 | 0 |
| C | 0 | 37 | 0 |
| D | 0 | 38 | 0 |
| Quadrant | Total seconds | Saturated seconds | Saturation percentage |
|---|---|---|---|
| A | 4997 | 7 | 0.140084% |
| B | 4997 | 158 | 3.161897% |
| C | 4997 | 140 | 2.801681% |
| D | 4997 | 3141 | 62.857715% |
Noise dominated data is calculated using 1-second bins in cleaned event files. If a bin has >2000 counts, and if more than 50% of those come from <1% of pixels, then it is considered to be noise-dominated and hence unusable.
| Quadrant | # 1 sec bins | Bins with >0 counts | Bins with >2000 counts | High rate bins dominated by noise | Noise dominated (total time) | Noise dominated (detector-on time) | Marked lightcurve |
|---|---|---|---|---|---|---|---|
| A | 7029 | 4998 | 0 | 0 | 0.00% | 0.00% | 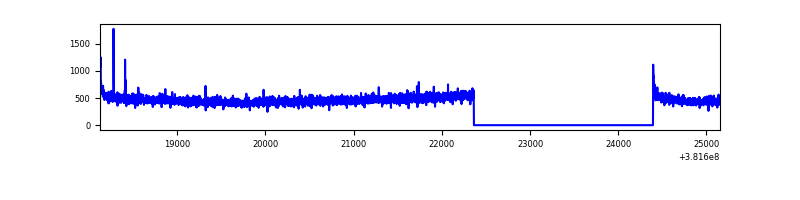 |
| B | 7029 | 4998 | 118 | 118 | 1.68% | 2.36% | 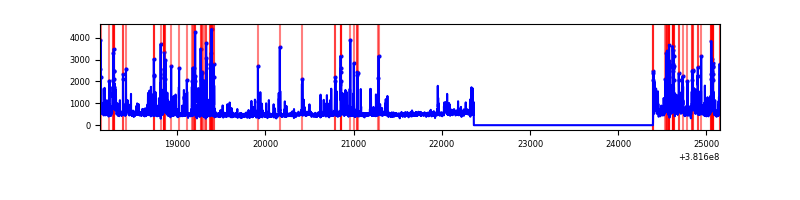 |
| C | 7029 | 4998 | 117 | 117 | 1.66% | 2.34% | 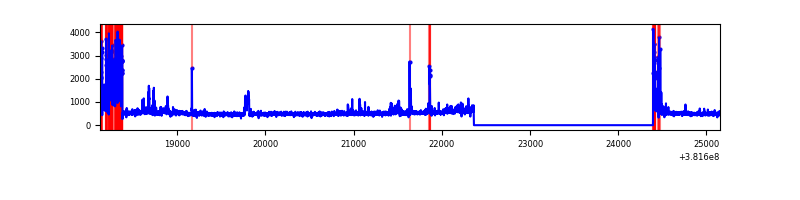 |
| D | 7029 | 4998 | 3200 | 3200 | 45.53% | 64.03% | 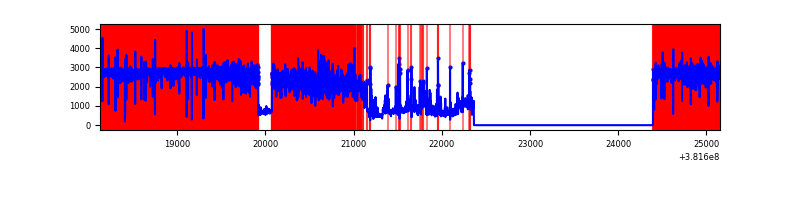 |
Top three noisy pixels from each quadrant. If the there are fewer than three noisy pixels in the level2.evt file, extra rows are filled as -1
| Pixel properties | Quadrant properties | ||||||
|---|---|---|---|---|---|---|---|
| Quadrant | DetID | PixID | Counts | Sigma | Mean | Median | Sigma |
| A | 10 | 83 | 31380 | 259.03 | 586 | 574 | 118.9 |
| A | 13 | 6 | 13835 | 111.5 | 586 | 574 | 118.9 |
| A | 13 | 254 | 8471 | 66.4 | 586 | 574 | 118.9 |
| B | 5 | 172 | 638671 | 5689.66 | 582 | 567 | 112.2 |
| B | 5 | 31 | 133111 | 1181.83 | 582 | 567 | 112.2 |
| B | 15 | 201 | 33037 | 289.52 | 582 | 567 | 112.2 |
| C | 14 | 254 | 320163 | 2408.26 | 571 | 576 | 132.7 |
| C | 15 | 214 | 209689 | 1575.78 | 571 | 576 | 132.7 |
| C | 0 | 10 | 151959 | 1140.75 | 571 | 576 | 132.7 |
| D | 7 | 223 | 7187231 | 65954.56 | 399 | 391 | 109.0 |
| D | 8 | 195 | 797952 | 7319.32 | 399 | 391 | 109.0 |
| D | 12 | 235 | 323567 | 2965.83 | 399 | 391 | 109.0 |
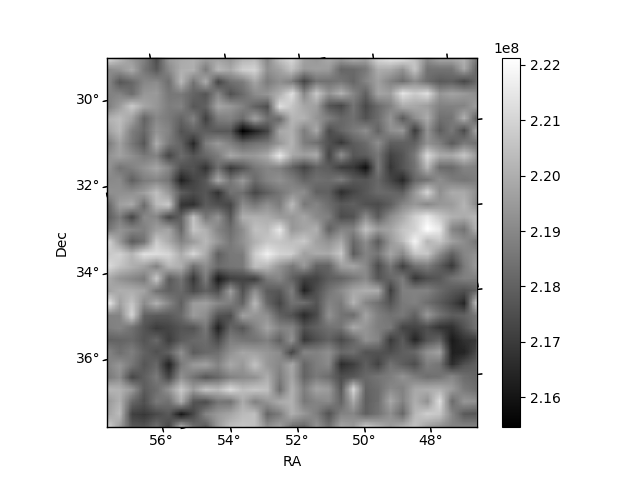
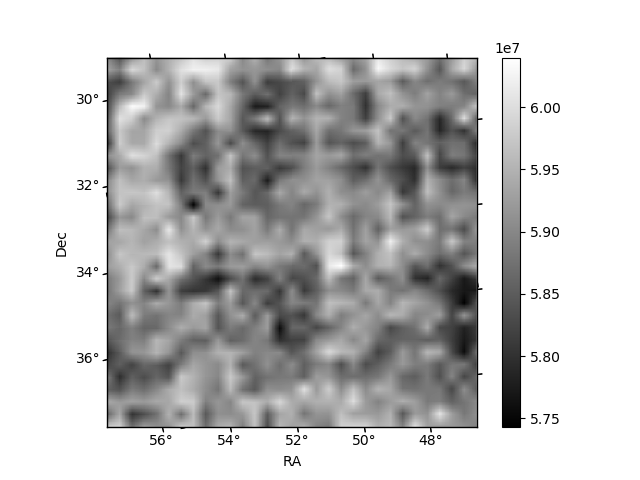
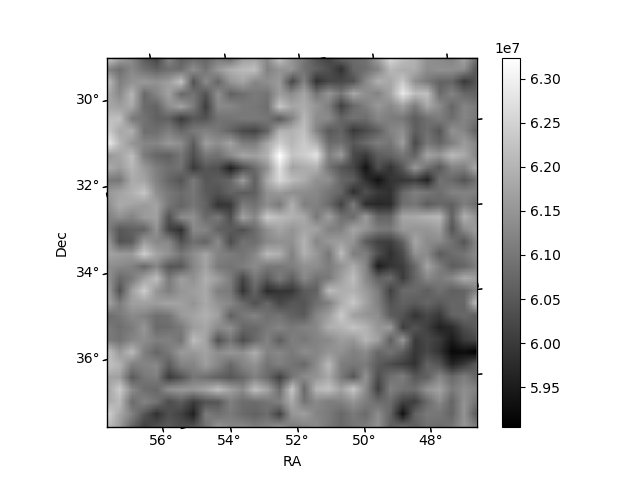
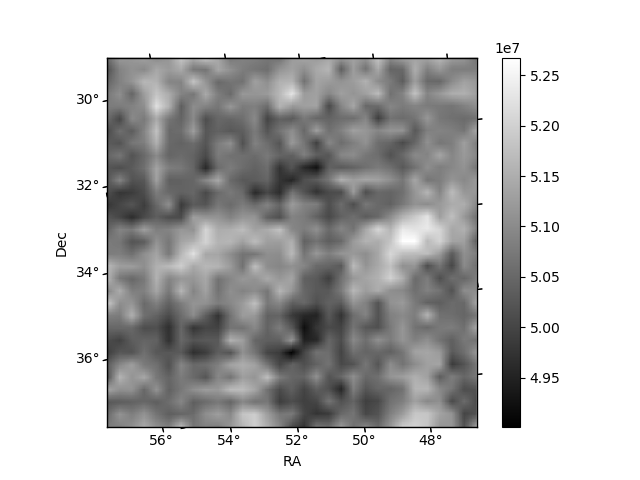
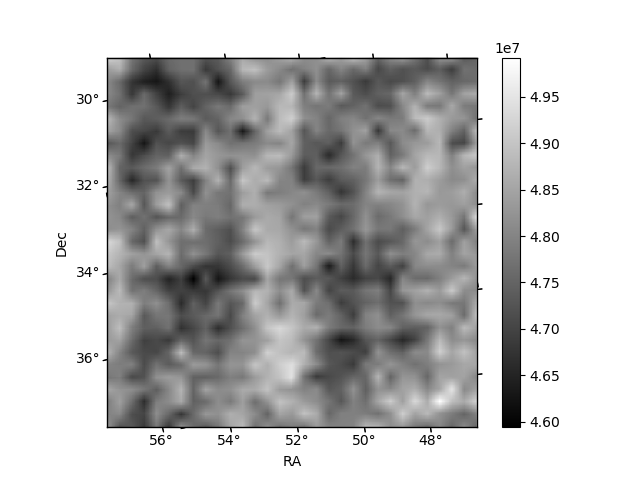
Histogram calculated using DETX and DETY for each event in the final _common_clean file
| Quadrant A | 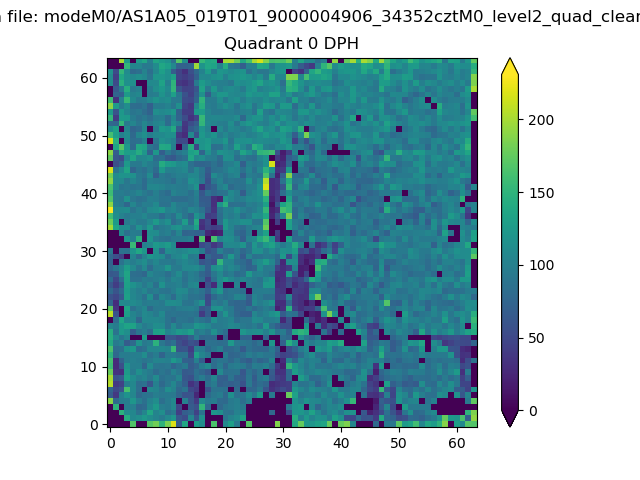 |
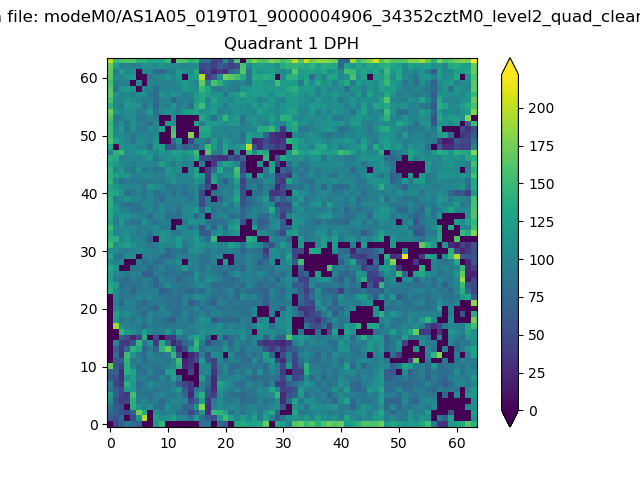 |
Quadrant B |
|---|---|---|---|
| Quadrant D | 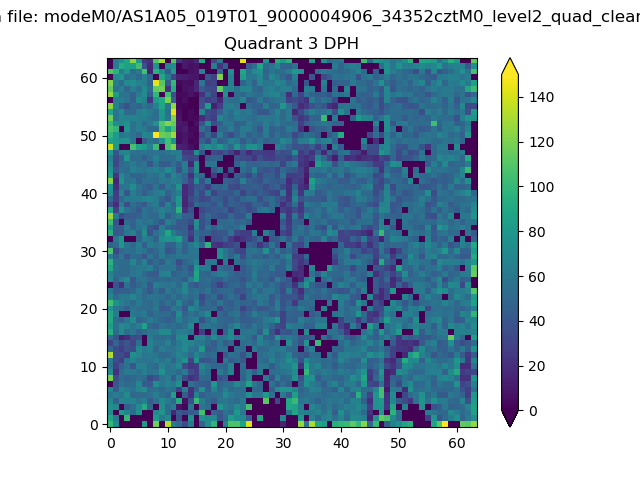 |
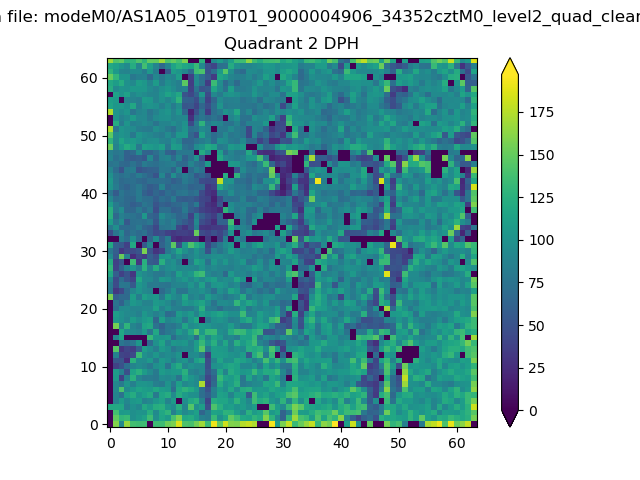 |
Quadrant C |
| Plot type | Count rate plots | Images |
|---|---|---|
| Comparison with Poisson distribution Blue bars denote a histogram of data divided into 1 sec bins. Red curve is a Poisson curve with rate = median count rate of data. |
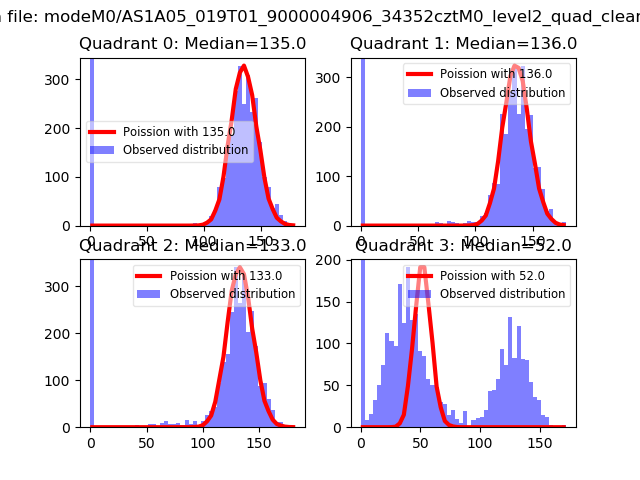 |
 |
| Quadrant-wise count rates Data is divided into 100 sec bins |
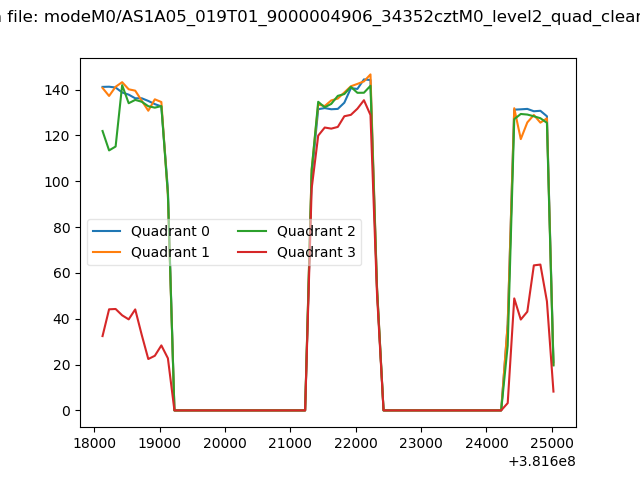 |
|
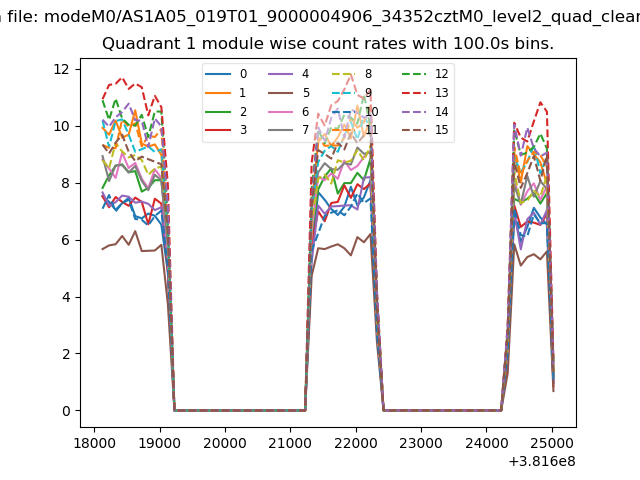
| Module-wise count rates for Quadrant A Data is divided into 100 sec bins |
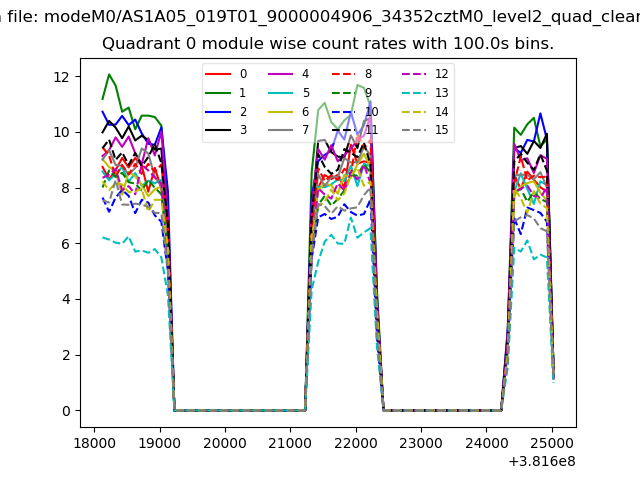 |
 |
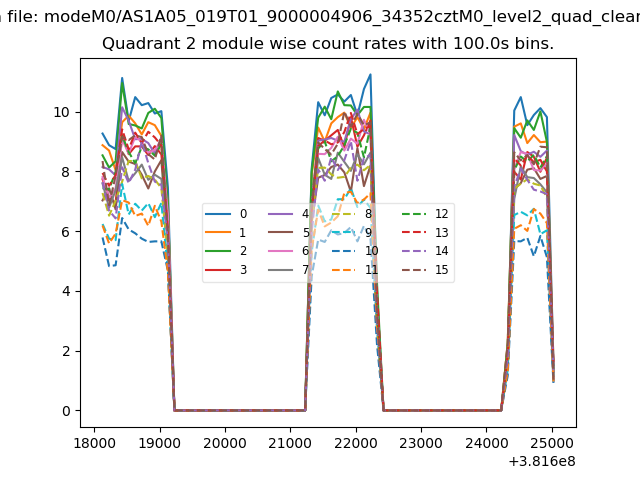
| Module-wise count rates for Quadrant B Data is divided into 100 sec bins |
 |
 |
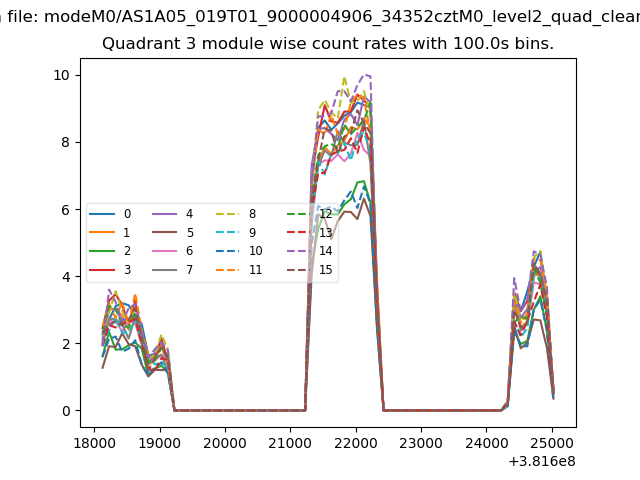
| Module-wise count rates for Quadrant C Data is divided into 100 sec bins |
 |
 |
| Module-wise count rates for Quadrant D Data is divided into 100 sec bins |
 |
 |
| Parameter | Plot |
|---|---|
| CZT HV Monitor | 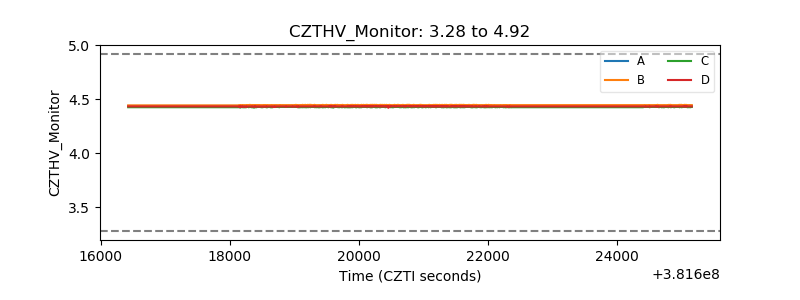 |
| D_VDD | 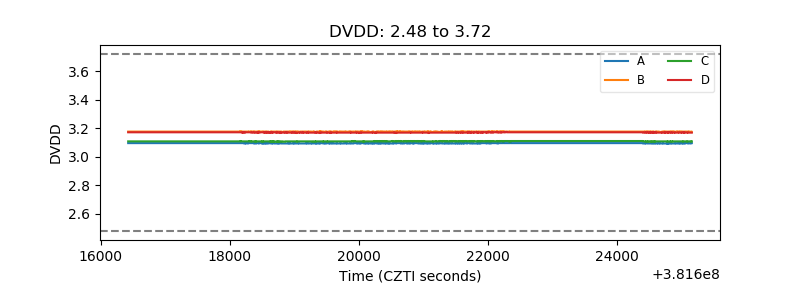 |
| Temperature 1 | 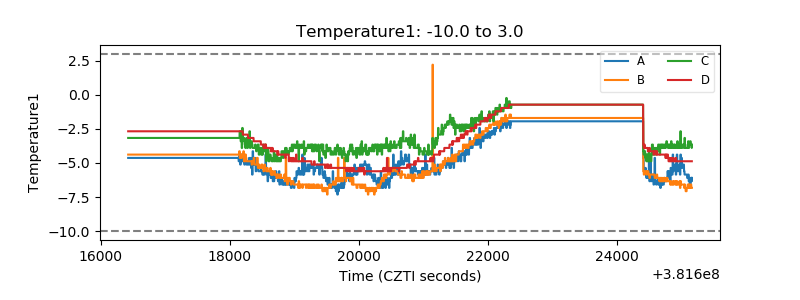 |
| Veto HV Monitor | 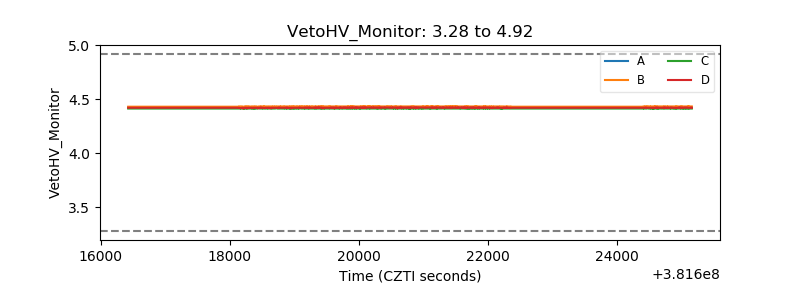 |
| Veto LLD | 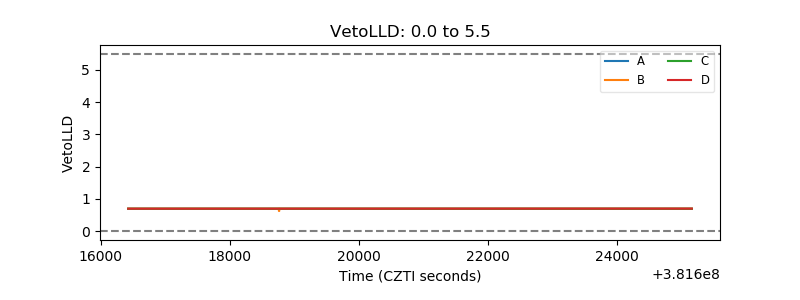 |
| Alpha Counter | 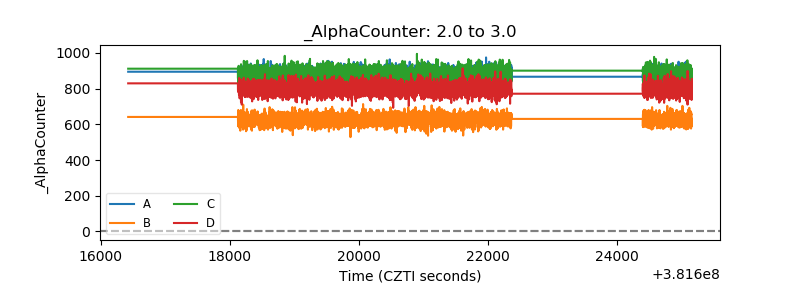 |
| _CPM_Rate | 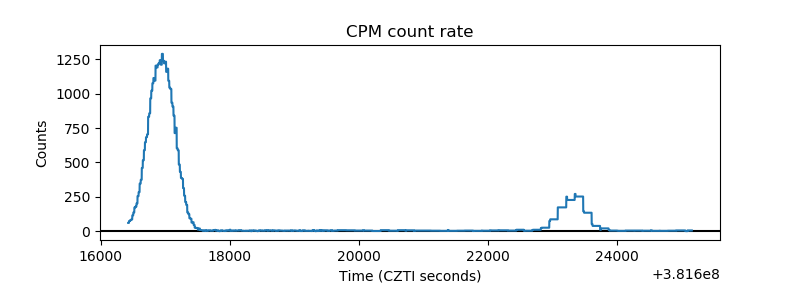 |
| CZT Counter | 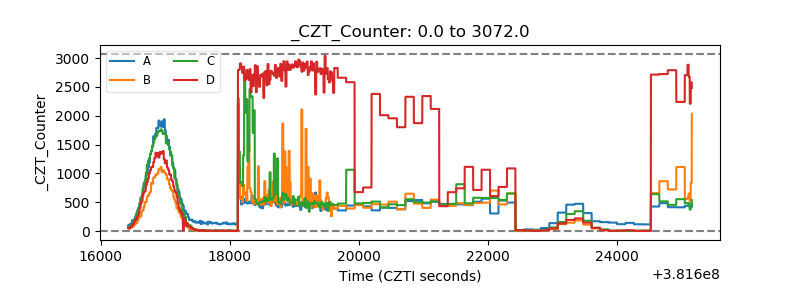 |
| +2.5 Volts monitor | 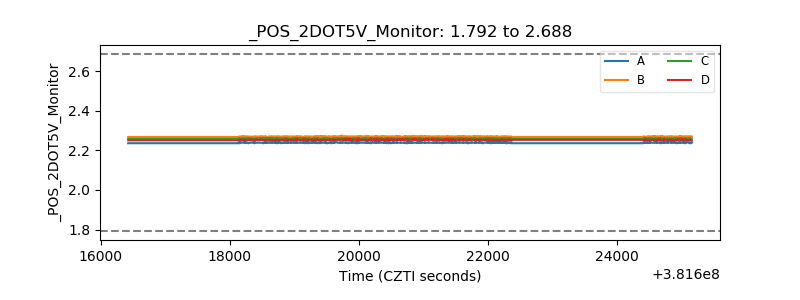 |
| +5 Volts monitor | 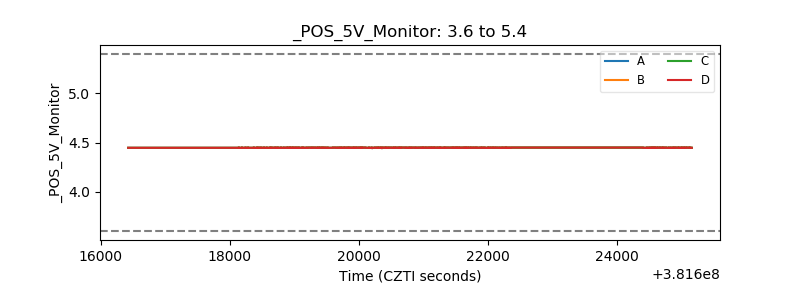 |
| _ROLL_ROT | 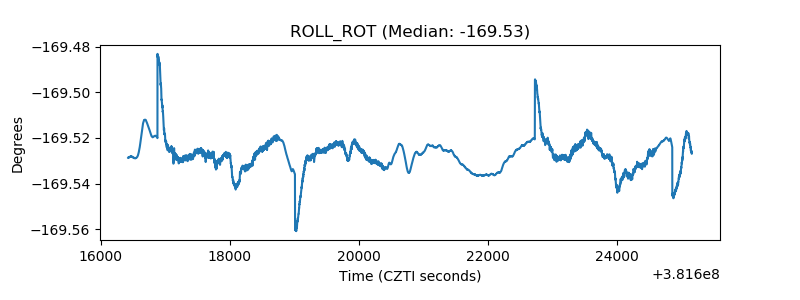 |
| _Roll_DEC | 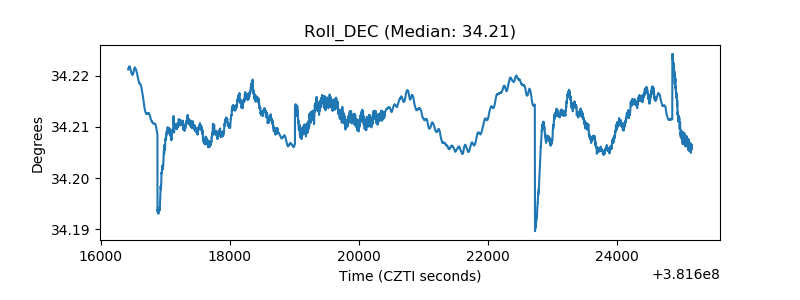 |
| _Roll_RA | 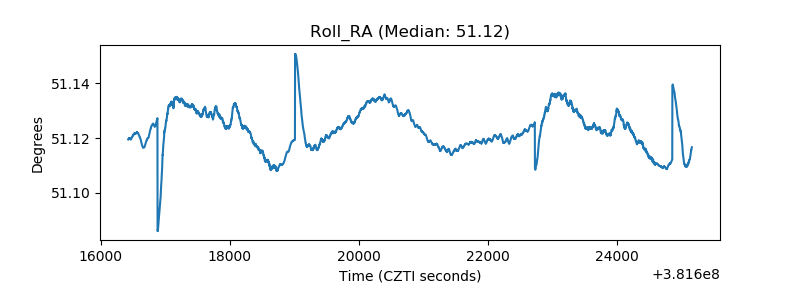 |
| Veto Counter | 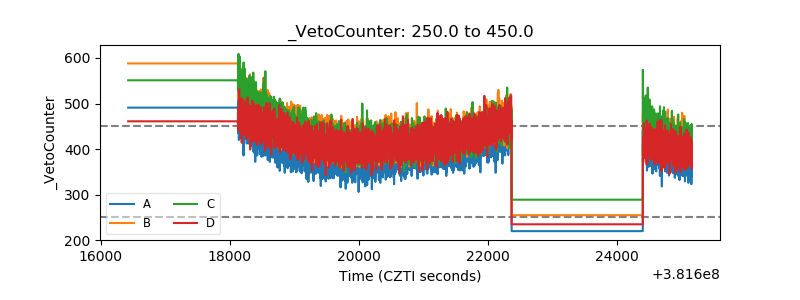 |