| Param | Original file | Final file |
|---|---|---|
| Filename | modeM0/AS1A05_019T01_9000004906_34351cztM0_level2.evt | modeM0/AS1A05_019T01_9000004906_34351cztM0_level2_quad_clean.evt |
| Size (bytes) | 686,283,840 | 58,161,600 |
| Size | 654.5 MB | 55.5 MB |
| Events in quadrant A | 2,375,333 | 396,255 |
| Events in quadrant B | 3,101,654 | 397,050 |
| Events in quadrant C | 4,000,436 | 382,904 |
| Events in quadrant D | 10,974,008 | 238,557 |
| Mode SS | |||
|---|---|---|---|
| Quadrant | BADHDUFLAG | Total packets | Discarded packets |
| A | 0 | 100 | 0 |
| B | 0 | 100 | 0 |
| C | 0 | 100 | 0 |
| D | 0 | 100 | 0 |
| Mode M0 | |||
|---|---|---|---|
| Quadrant | BADHDUFLAG | Total packets | Discarded packets |
| A | 0 | 10102 | 2 |
| B | 0 | 12283 | 1 |
| C | 0 | 14840 | 1 |
| D | 0 | 35981 | 1 |
| Mode M9 | |||
|---|---|---|---|
| Quadrant | BADHDUFLAG | Total packets | Discarded packets |
| A | 0 | 32 | 0 |
| B | 0 | 32 | 0 |
| C | 0 | 32 | 0 |
| D | 0 | 33 | 0 |
| Quadrant | Total seconds | Saturated seconds | Saturation percentage |
|---|---|---|---|
| A | 4922 | 13 | 0.264120% |
| B | 4922 | 137 | 2.783421% |
| C | 4922 | 454 | 9.223893% |
| D | 4922 | 3491 | 70.926453% |
Noise dominated data is calculated using 1-second bins in cleaned event files. If a bin has >2000 counts, and if more than 50% of those come from <1% of pixels, then it is considered to be noise-dominated and hence unusable.
| Quadrant | # 1 sec bins | Bins with >0 counts | Bins with >2000 counts | High rate bins dominated by noise | Noise dominated (total time) | Noise dominated (detector-on time) | Marked lightcurve |
|---|---|---|---|---|---|---|---|
| A | 7074 | 4923 | 6 | 6 | 0.08% | 0.12% | 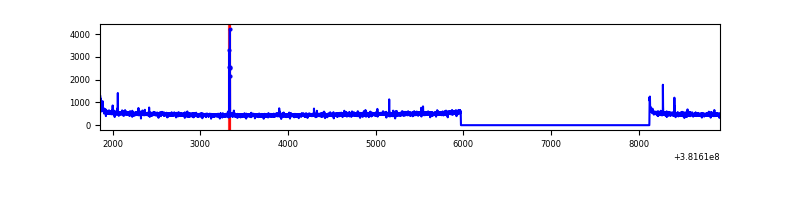 |
| B | 7074 | 4923 | 93 | 93 | 1.31% | 1.89% | 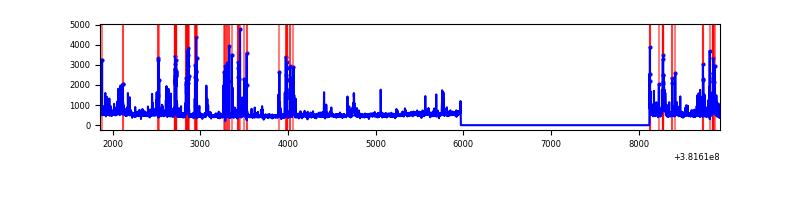 |
| C | 7074 | 4923 | 388 | 388 | 5.48% | 7.88% | 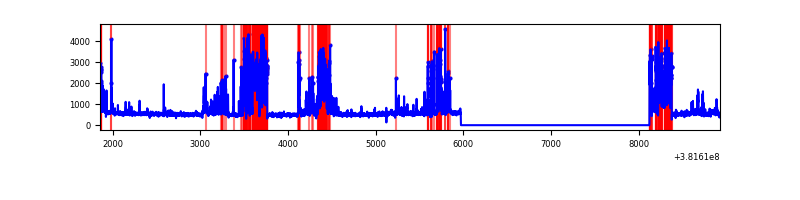 |
| D | 7073 | 4922 | 3404 | 3404 | 48.13% | 69.16% | 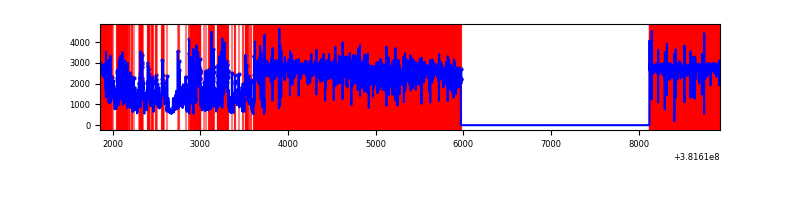 |
Top three noisy pixels from each quadrant. If the there are fewer than three noisy pixels in the level2.evt file, extra rows are filled as -1
| Pixel properties | Quadrant properties | ||||||
|---|---|---|---|---|---|---|---|
| Quadrant | DetID | PixID | Counts | Sigma | Mean | Median | Sigma |
| A | 10 | 83 | 32231 | 266.51 | 594 | 583 | 118.8 |
| A | 9 | 143 | 25504 | 209.86 | 594 | 583 | 118.8 |
| A | 13 | 6 | 14737 | 119.19 | 594 | 583 | 118.8 |
| B | 5 | 172 | 577089 | 5130.92 | 591 | 576 | 112.4 |
| B | 5 | 255 | 43098 | 378.44 | 591 | 576 | 112.4 |
| B | 4 | 251 | 42680 | 374.72 | 591 | 576 | 112.4 |
| C | 14 | 254 | 1405557 | 10809.23 | 565 | 571 | 130.0 |
| C | 15 | 214 | 202136 | 1550.74 | 565 | 571 | 130.0 |
| C | 0 | 10 | 131432 | 1006.78 | 565 | 571 | 130.0 |
| D | 7 | 223 | 6725704 | 66544.72 | 382 | 374 | 101.1 |
| D | 12 | 235 | 1401967 | 13868.26 | 382 | 374 | 101.1 |
| D | 8 | 195 | 808482 | 7995.94 | 382 | 374 | 101.1 |
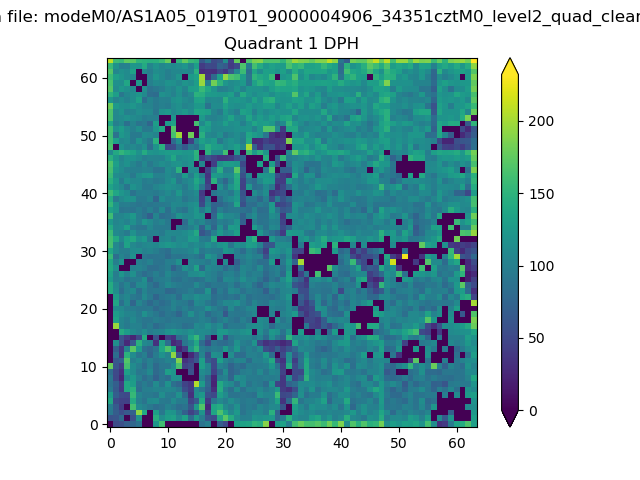
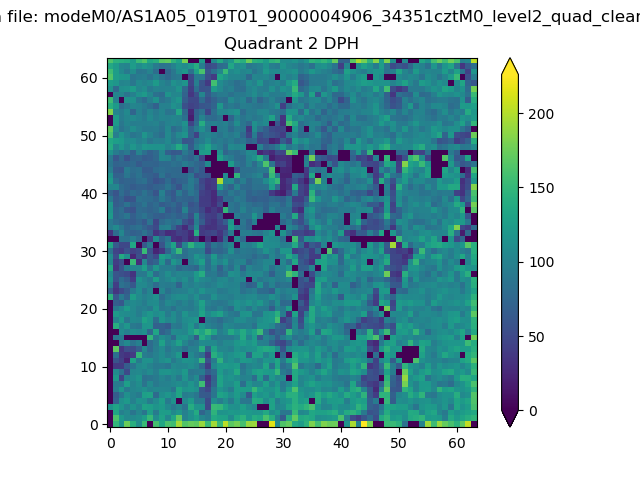
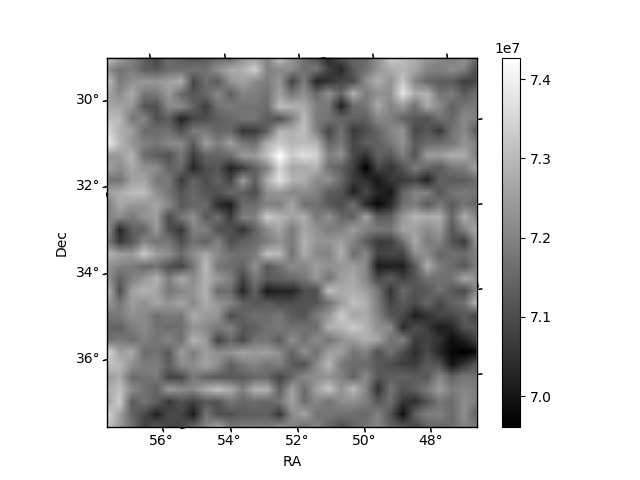
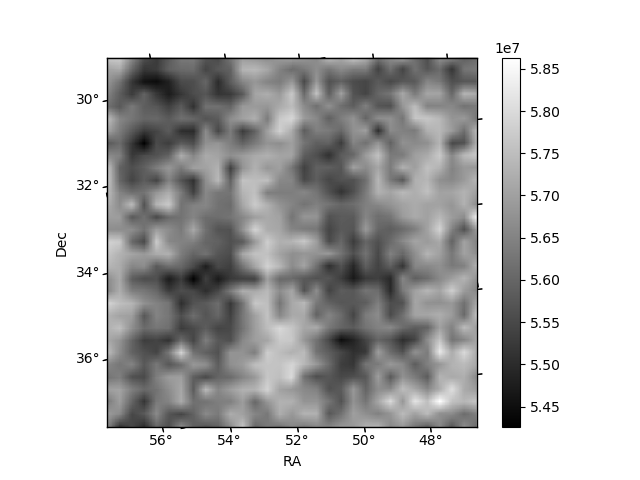
Histogram calculated using DETX and DETY for each event in the final _common_clean file
| Quadrant A |  |
 |
Quadrant B |
|---|---|---|---|
| Quadrant D | 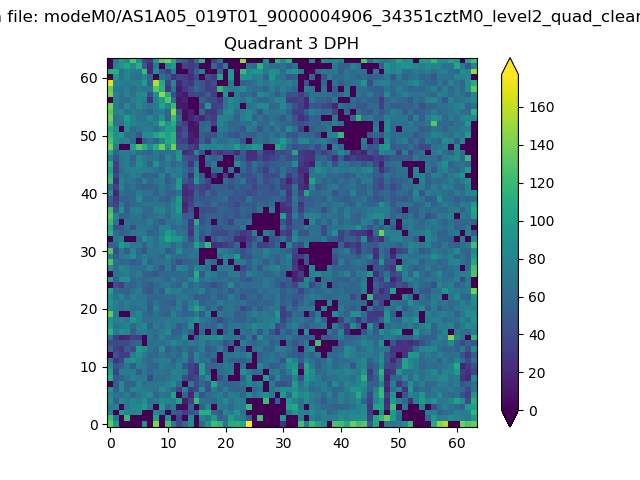 |
 |
Quadrant C |
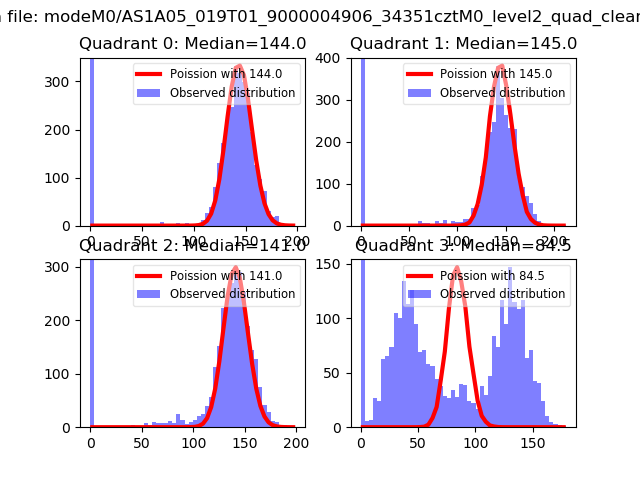
| Plot type | Count rate plots | Images |
|---|---|---|
| Comparison with Poisson distribution Blue bars denote a histogram of data divided into 1 sec bins. Red curve is a Poisson curve with rate = median count rate of data. |
 |
 |
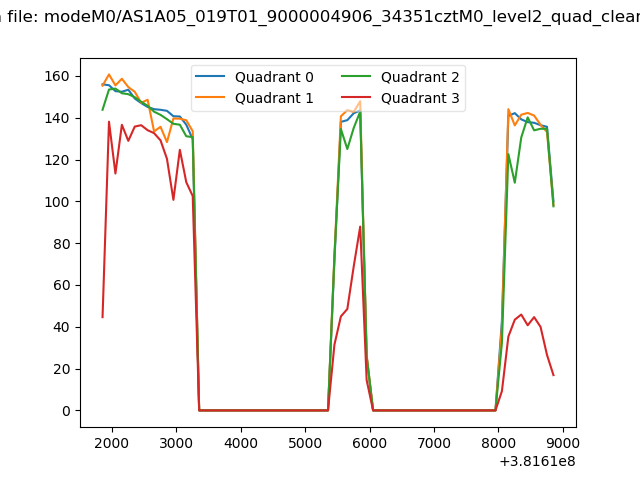
| Quadrant-wise count rates Data is divided into 100 sec bins |
 |
|
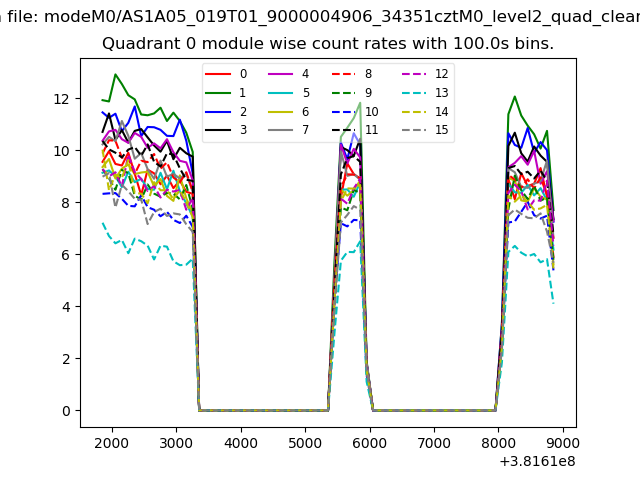
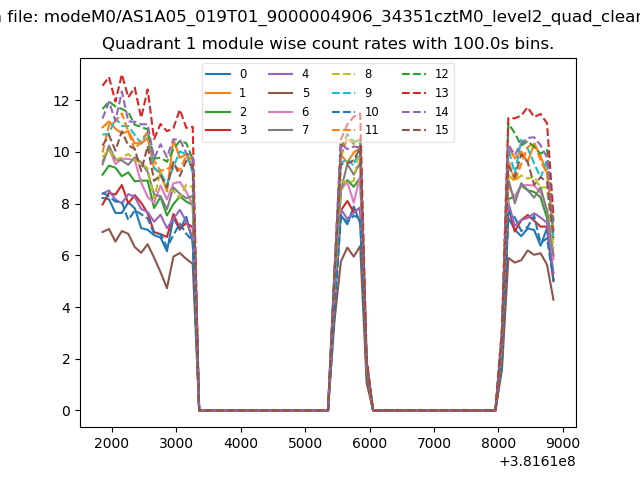
| Module-wise count rates for Quadrant A Data is divided into 100 sec bins |
 |
 |
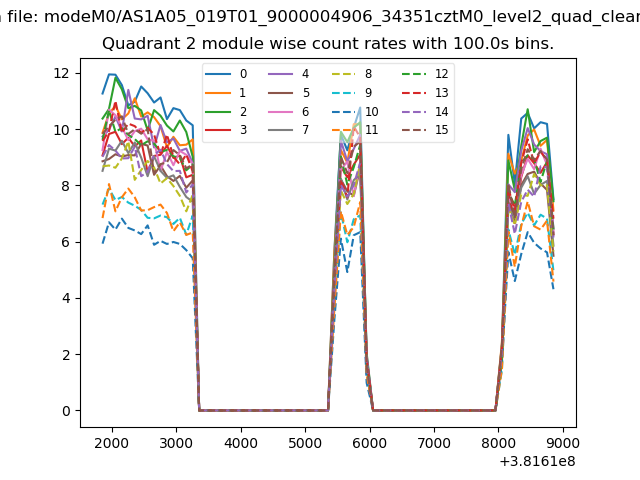
| Module-wise count rates for Quadrant B Data is divided into 100 sec bins |
 |
 |
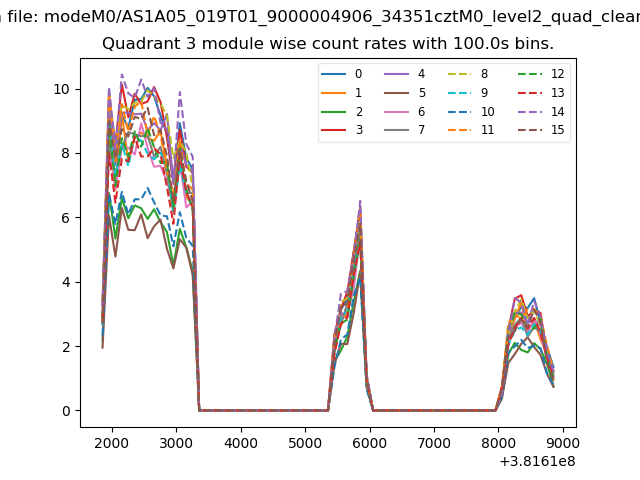
| Module-wise count rates for Quadrant C Data is divided into 100 sec bins |
 |
 |
| Module-wise count rates for Quadrant D Data is divided into 100 sec bins |
 |
 |
| Parameter | Plot |
|---|---|
| CZT HV Monitor | 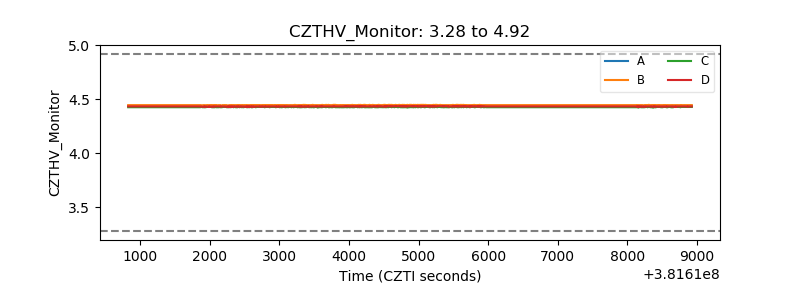 |
| D_VDD | 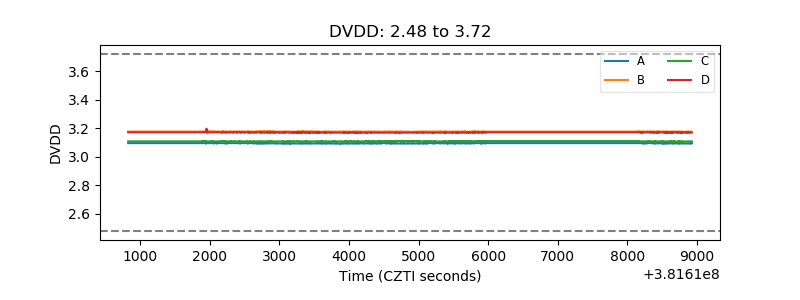 |
| Temperature 1 | 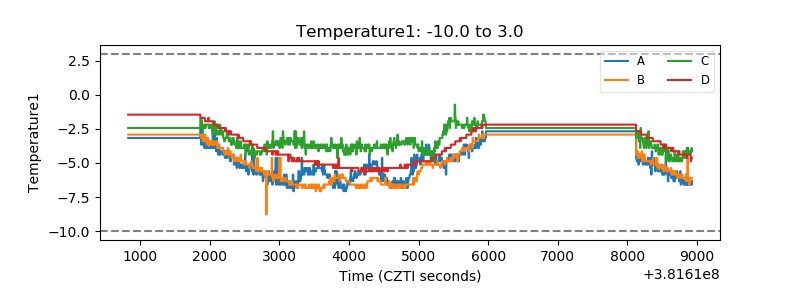 |
| Veto HV Monitor | 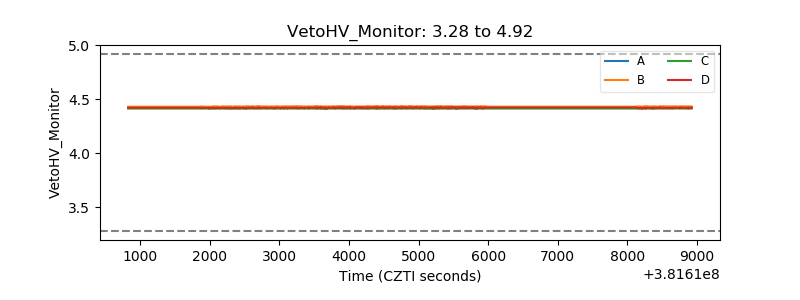 |
| Veto LLD | 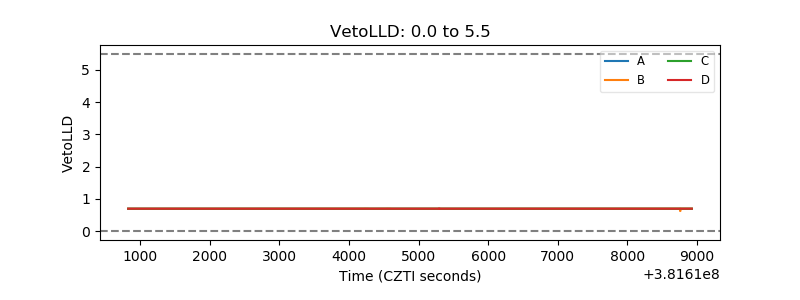 |
| Alpha Counter | 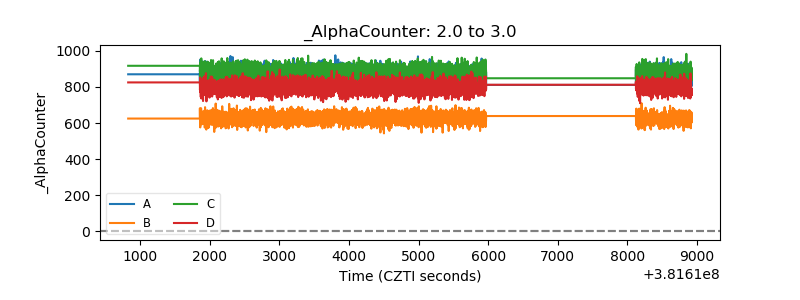 |
| _CPM_Rate | 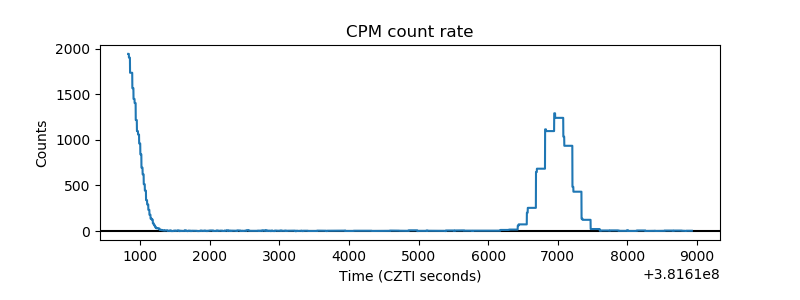 |
| CZT Counter | 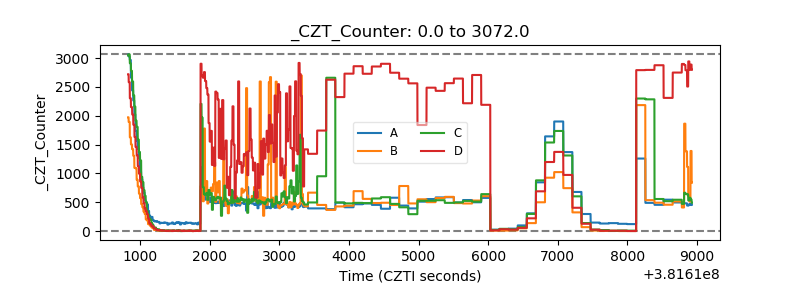 |
| +2.5 Volts monitor | 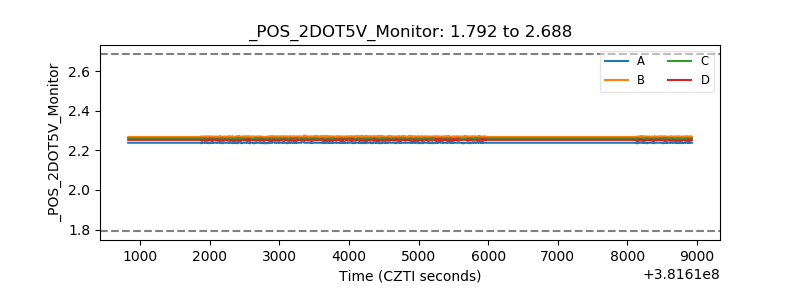 |
| +5 Volts monitor | 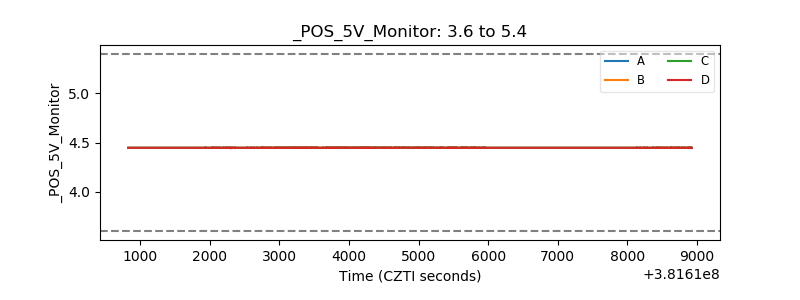 |
| _ROLL_ROT | 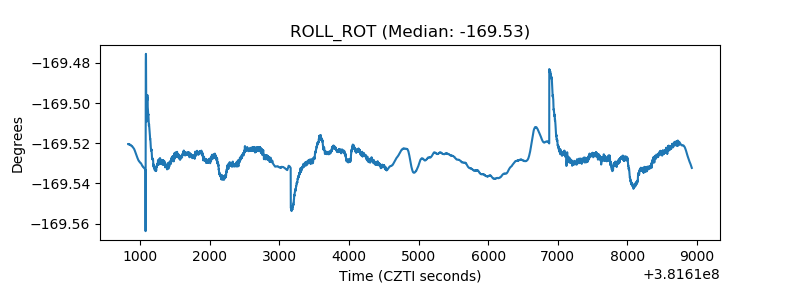 |
| _Roll_DEC | 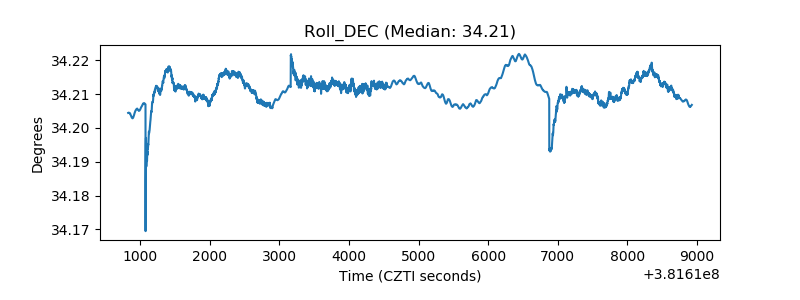 |
| _Roll_RA | 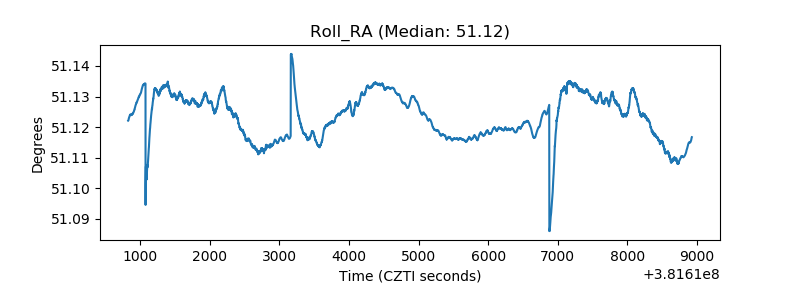 |
| Veto Counter | 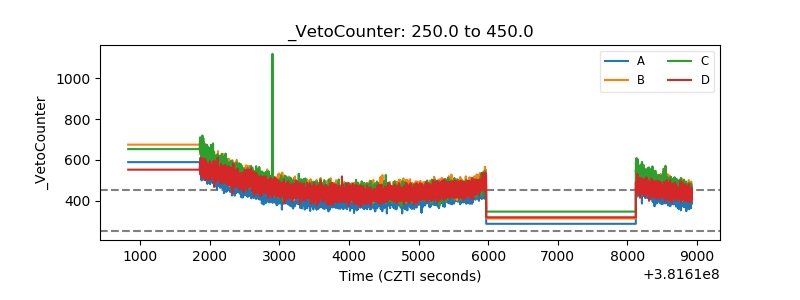 |