| Param | Original file | Final file |
|---|---|---|
| Filename | modeM0/AS1A05_019T01_9000004906_34349cztM0_level2.evt | modeM0/AS1A05_019T01_9000004906_34349cztM0_level2_quad_clean.evt |
| Size (bytes) | 741,781,440 | 66,490,560 |
| Size | 707.4 MB | 63.4 MB |
| Events in quadrant A | 2,567,613 | 500,735 |
| Events in quadrant B | 3,822,912 | 483,632 |
| Events in quadrant C | 3,059,648 | 477,641 |
| Events in quadrant D | 12,670,768 | 193,360 |
| Mode SS | |||
|---|---|---|---|
| Quadrant | BADHDUFLAG | Total packets | Discarded packets |
| A | 0 | 104 | 0 |
| B | 0 | 104 | 0 |
| C | 0 | 104 | 0 |
| D | 0 | 104 | 0 |
| Mode M0 | |||
|---|---|---|---|
| Quadrant | BADHDUFLAG | Total packets | Discarded packets |
| A | 0 | 10682 | 3 |
| B | 0 | 14676 | 2 |
| C | 0 | 12037 | 2 |
| D | 0 | 41062 | 2 |
| Mode M9 | |||
|---|---|---|---|
| Quadrant | BADHDUFLAG | Total packets | Discarded packets |
| A | 0 | 24 | 0 |
| B | 0 | 24 | 0 |
| C | 0 | 24 | 0 |
| D | 0 | 25 | 0 |
| Quadrant | Total seconds | Saturated seconds | Saturation percentage |
|---|---|---|---|
| A | 5086 | 13 | 0.255604% |
| B | 5086 | 296 | 5.819898% |
| C | 5086 | 109 | 2.143138% |
| D | 5086 | 4593 | 90.306724% |
Noise dominated data is calculated using 1-second bins in cleaned event files. If a bin has >2000 counts, and if more than 50% of those come from <1% of pixels, then it is considered to be noise-dominated and hence unusable.
| Quadrant | # 1 sec bins | Bins with >0 counts | Bins with >2000 counts | High rate bins dominated by noise | Noise dominated (total time) | Noise dominated (detector-on time) | Marked lightcurve |
|---|---|---|---|---|---|---|---|
| A | 7149 | 5087 | 4 | 4 | 0.06% | 0.08% | 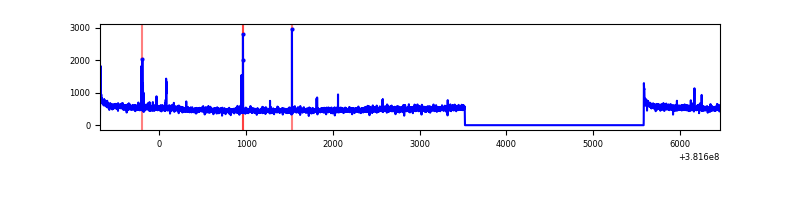 |
| B | 7149 | 5087 | 226 | 226 | 3.16% | 4.44% | 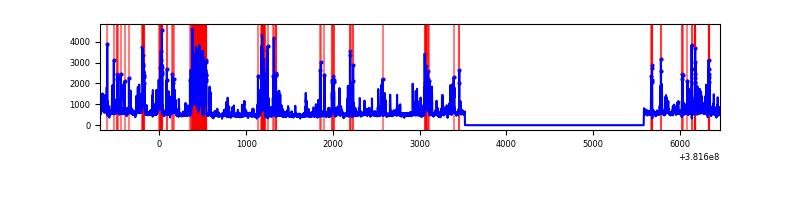 |
| C | 7149 | 5087 | 63 | 63 | 0.88% | 1.24% | 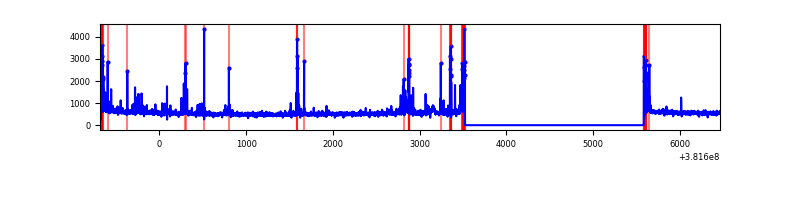 |
| D | 7149 | 5087 | 4416 | 4416 | 61.77% | 86.81% | 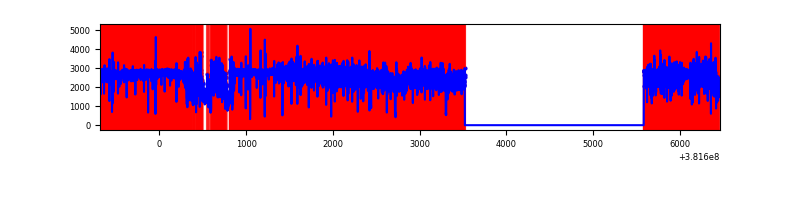 |
Top three noisy pixels from each quadrant. If the there are fewer than three noisy pixels in the level2.evt file, extra rows are filled as -1
| Pixel properties | Quadrant properties | ||||||
|---|---|---|---|---|---|---|---|
| Quadrant | DetID | PixID | Counts | Sigma | Mean | Median | Sigma |
| A | 10 | 83 | 33046 | 255.58 | 644 | 632 | 126.8 |
| A | 9 | 143 | 29421 | 227.0 | 644 | 632 | 126.8 |
| A | 13 | 6 | 11239 | 83.63 | 644 | 632 | 126.8 |
| B | 5 | 172 | 972782 | 8319.15 | 624 | 609 | 116.9 |
| B | 0 | 229 | 163030 | 1389.88 | 624 | 609 | 116.9 |
| B | 5 | 31 | 81925 | 695.84 | 624 | 609 | 116.9 |
| C | 14 | 254 | 248816 | 1738.99 | 621 | 628 | 142.7 |
| C | 15 | 214 | 213389 | 1490.76 | 621 | 628 | 142.7 |
| C | 0 | 10 | 137787 | 961.04 | 621 | 628 | 142.7 |
| D | 7 | 223 | 8915309 | 98332.96 | 360 | 348 | 90.7 |
| D | 2 | 249 | 752731 | 8298.86 | 360 | 348 | 90.7 |
| D | 8 | 195 | 656631 | 7238.87 | 360 | 348 | 90.7 |
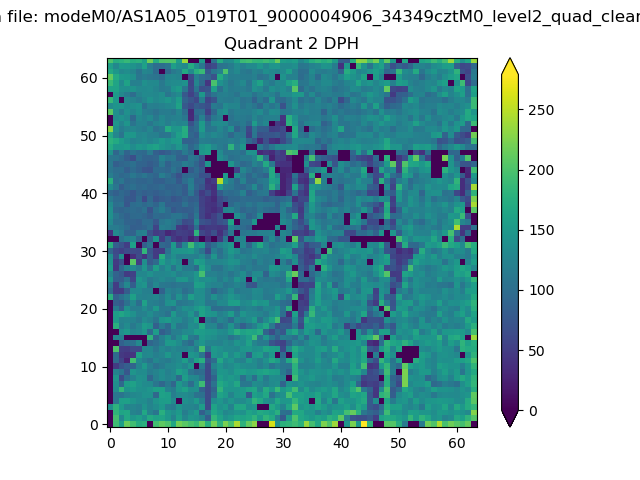
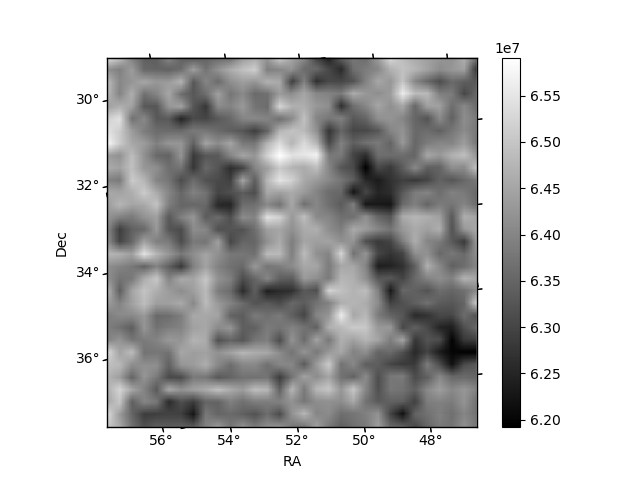
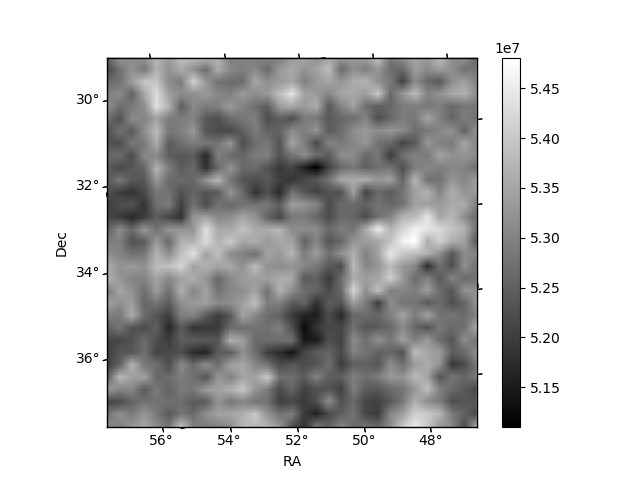
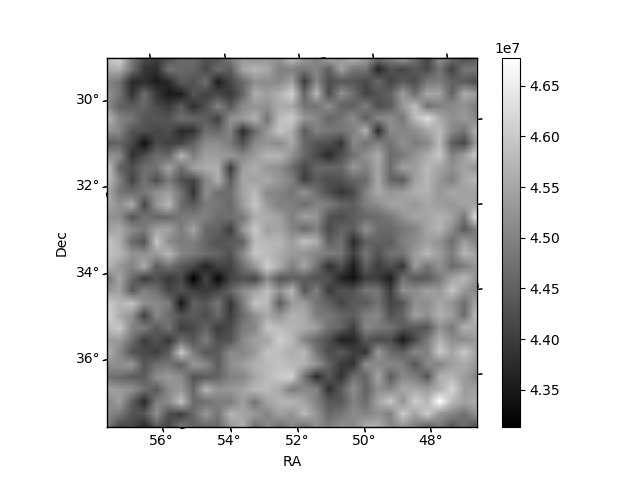
Histogram calculated using DETX and DETY for each event in the final _common_clean file
| Quadrant A | 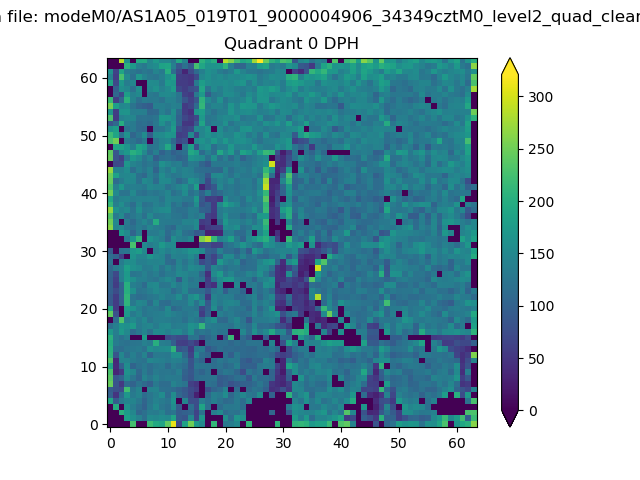 |
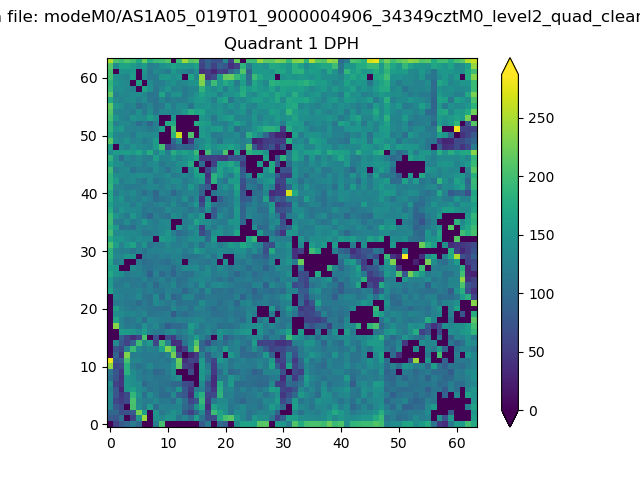 |
Quadrant B |
|---|---|---|---|
| Quadrant D | 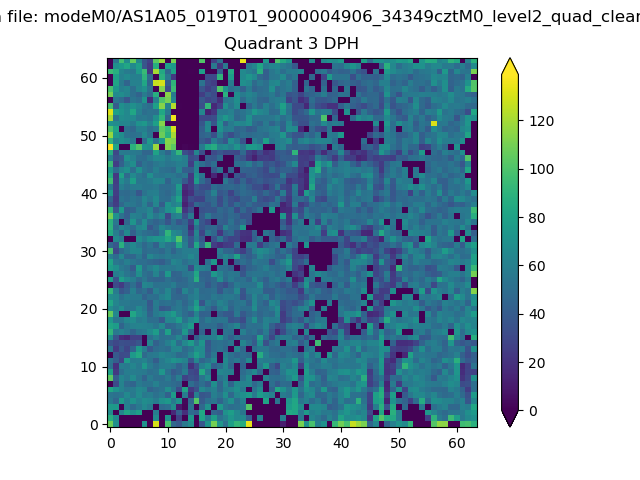 |
 |
Quadrant C |
| Plot type | Count rate plots | Images |
|---|---|---|
| Comparison with Poisson distribution Blue bars denote a histogram of data divided into 1 sec bins. Red curve is a Poisson curve with rate = median count rate of data. |
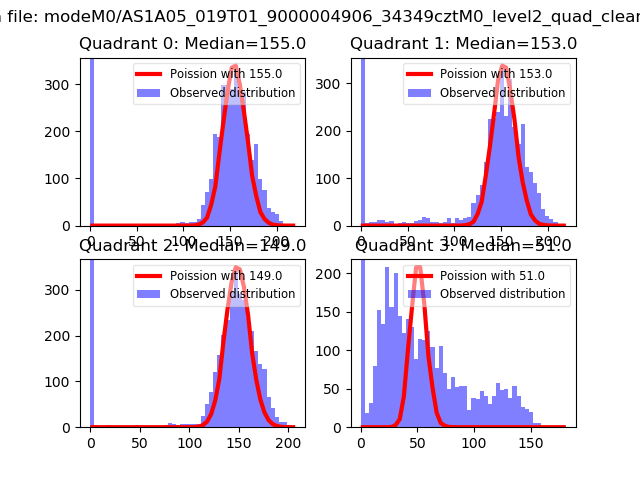 |
 |
| Quadrant-wise count rates Data is divided into 100 sec bins |
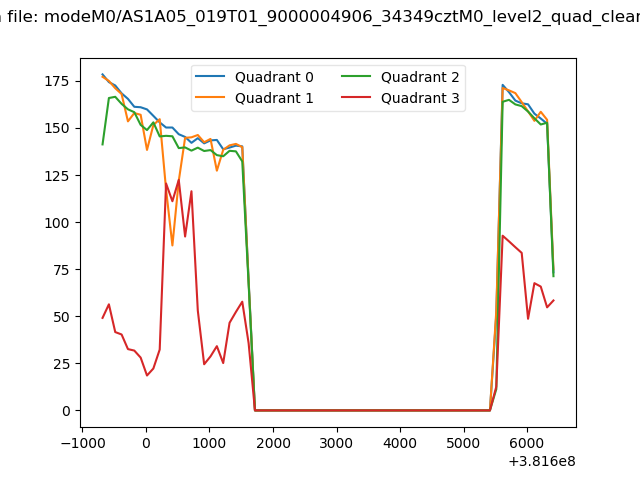 |
|
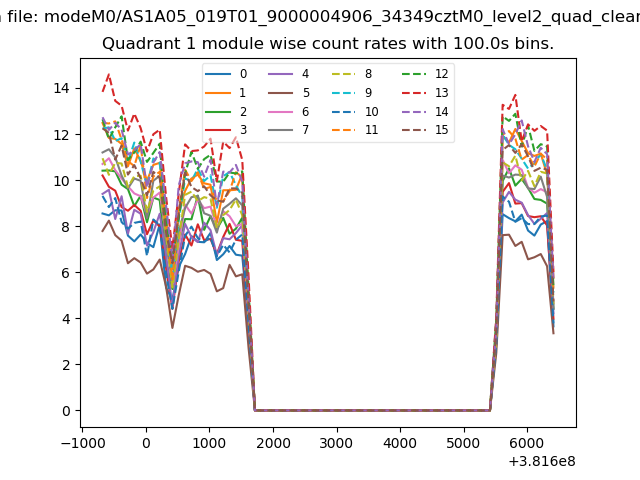
| Module-wise count rates for Quadrant A Data is divided into 100 sec bins |
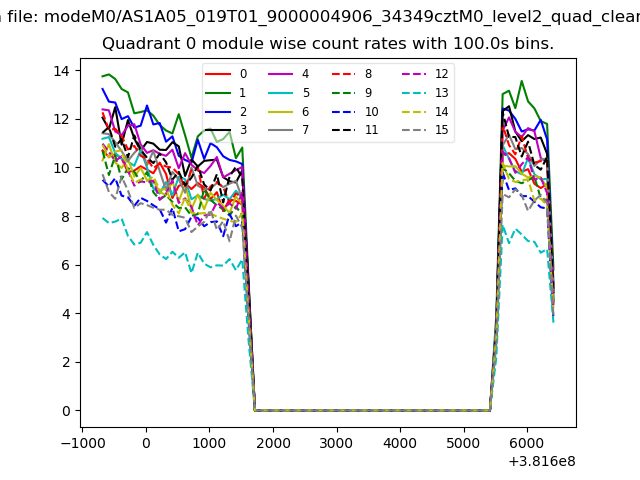 |
 |
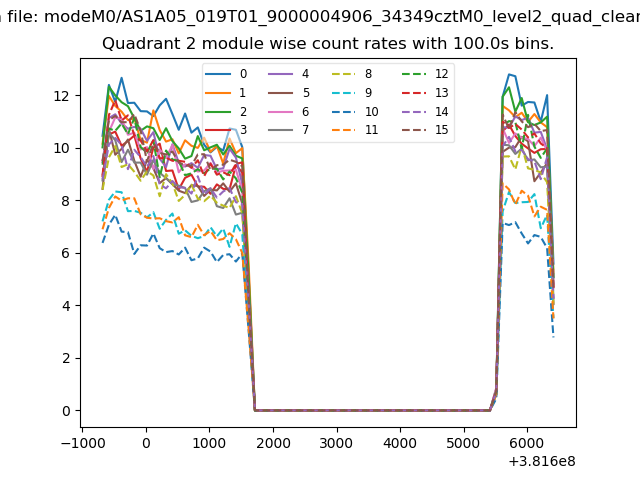
| Module-wise count rates for Quadrant B Data is divided into 100 sec bins |
 |
 |
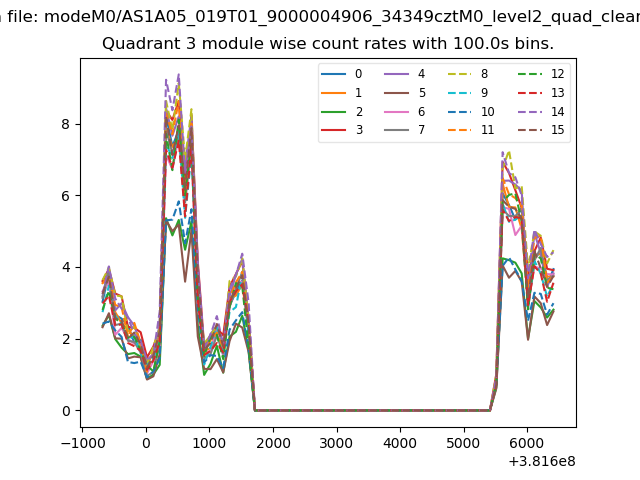
| Module-wise count rates for Quadrant C Data is divided into 100 sec bins |
 |
 |
| Module-wise count rates for Quadrant D Data is divided into 100 sec bins |
 |
 |
| Parameter | Plot |
|---|---|
| CZT HV Monitor | 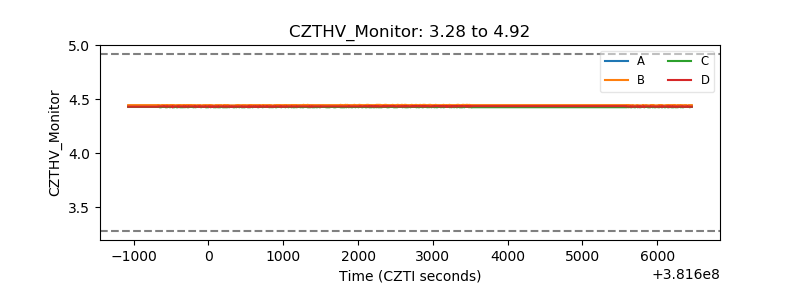 |
| D_VDD | 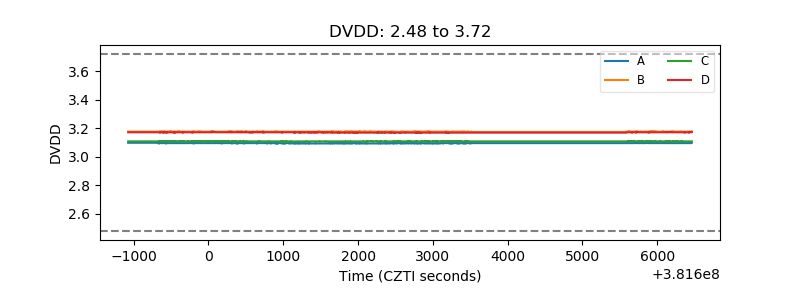 |
| Temperature 1 | 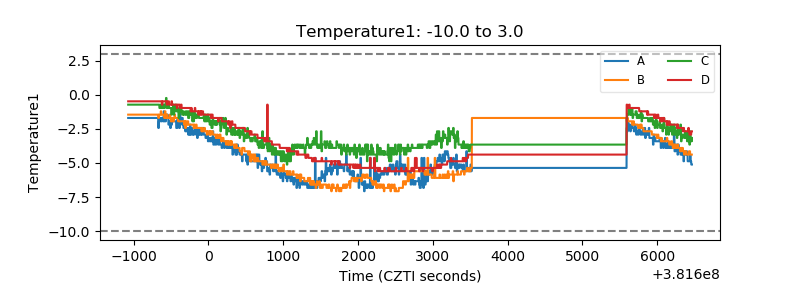 |
| Veto HV Monitor | 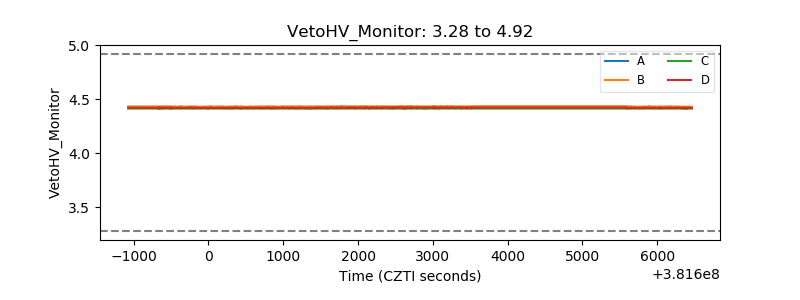 |
| Veto LLD | 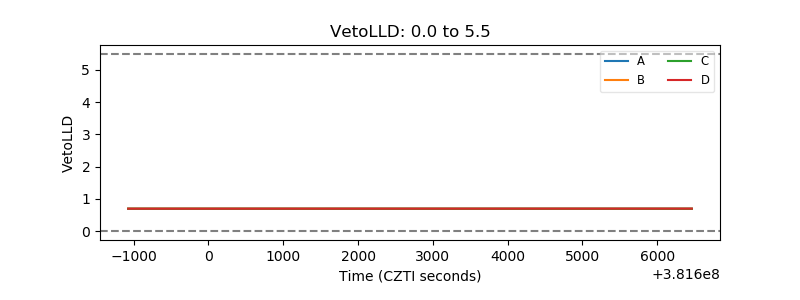 |
| Alpha Counter | 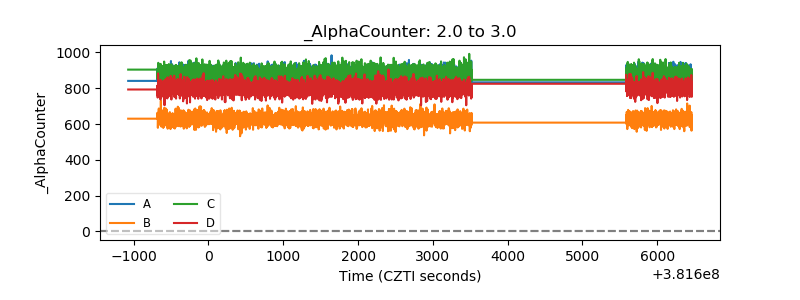 |
| _CPM_Rate | 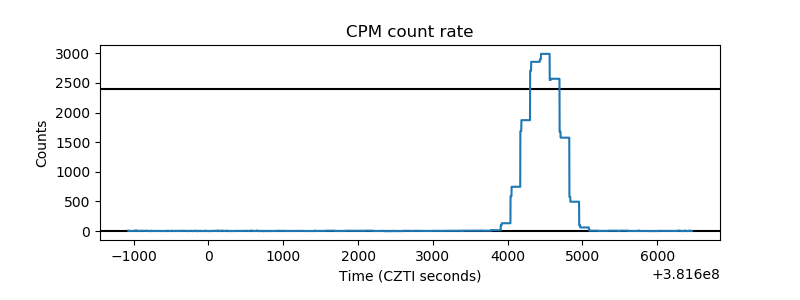 |
| CZT Counter | 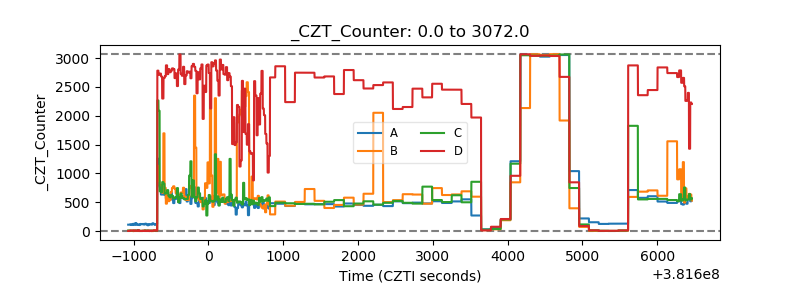 |
| +2.5 Volts monitor | 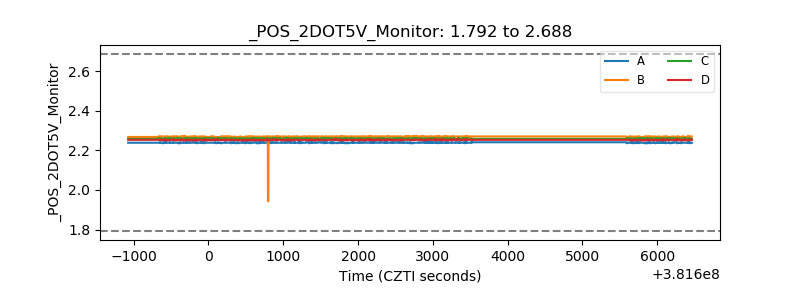 |
| +5 Volts monitor | 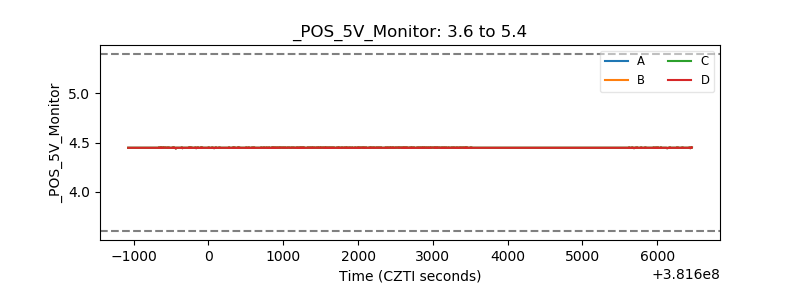 |
| _ROLL_ROT | 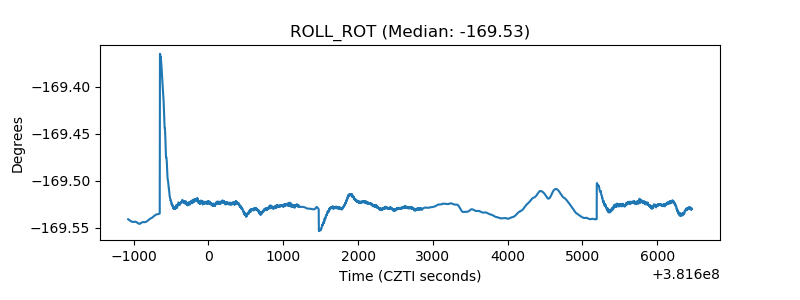 |
| _Roll_DEC | 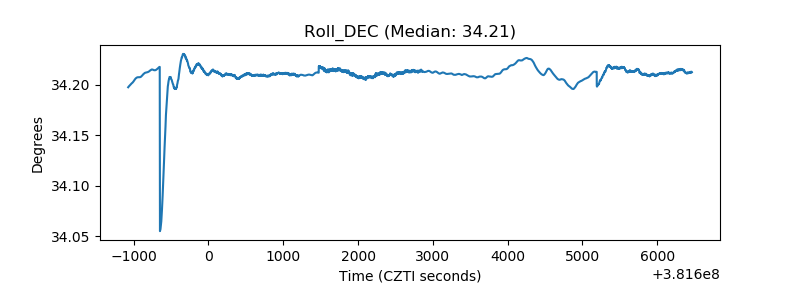 |
| _Roll_RA | 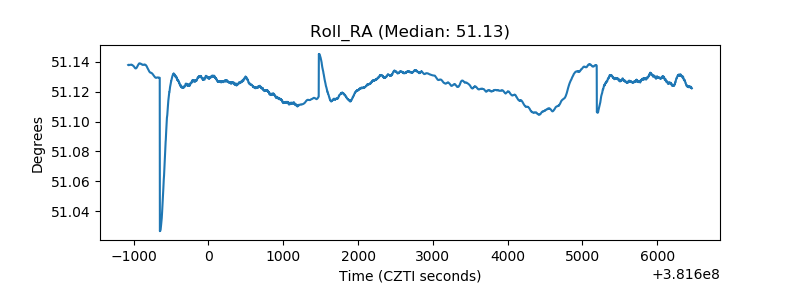 |
| Veto Counter | 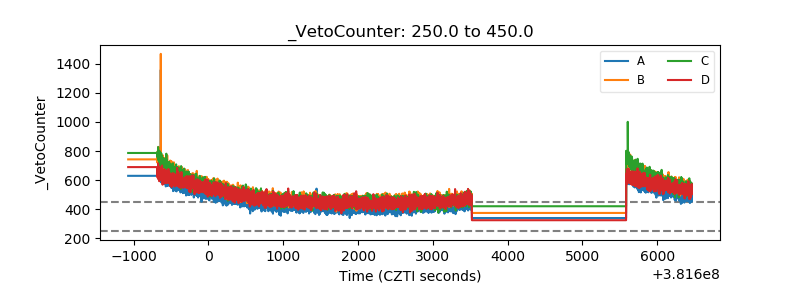 |