| Param | Original file | Final file |
|---|---|---|
| Filename | modeM0/AS1A05_019T01_9000004906_34348cztM0_level2.evt | modeM0/AS1A05_019T01_9000004906_34348cztM0_level2_quad_clean.evt |
| Size (bytes) | 438,206,400 | 29,358,720 |
| Size | 417.9 MB | 28.0 MB |
| Events in quadrant A | 1,465,317 | 214,029 |
| Events in quadrant B | 2,277,410 | 206,240 |
| Events in quadrant C | 1,798,328 | 202,876 |
| Events in quadrant D | 7,531,687 | 56,903 |
| Mode SS | |||
|---|---|---|---|
| Quadrant | BADHDUFLAG | Total packets | Discarded packets |
| A | 0 | 62 | 0 |
| B | 0 | 62 | 0 |
| C | 0 | 62 | 0 |
| D | 0 | 62 | 0 |
| Mode M0 | |||
|---|---|---|---|
| Quadrant | BADHDUFLAG | Total packets | Discarded packets |
| A | 0 | 6105 | 2 |
| B | 0 | 8676 | 1 |
| C | 0 | 7060 | 1 |
| D | 0 | 24365 | 1 |
| Mode M9 | |||
|---|---|---|---|
| Quadrant | BADHDUFLAG | Total packets | Discarded packets |
| A | 0 | 19 | 0 |
| B | 0 | 19 | 0 |
| C | 0 | 19 | 0 |
| D | 0 | 19 | 0 |
| Quadrant | Total seconds | Saturated seconds | Saturation percentage |
|---|---|---|---|
| A | 2904 | 7 | 0.241047% |
| B | 2904 | 210 | 7.231405% |
| C | 2904 | 56 | 1.928375% |
| D | 2904 | 2788 | 96.005510% |
Noise dominated data is calculated using 1-second bins in cleaned event files. If a bin has >2000 counts, and if more than 50% of those come from <1% of pixels, then it is considered to be noise-dominated and hence unusable.
| Quadrant | # 1 sec bins | Bins with >0 counts | Bins with >2000 counts | High rate bins dominated by noise | Noise dominated (total time) | Noise dominated (detector-on time) | Marked lightcurve |
|---|---|---|---|---|---|---|---|
| A | 4847 | 2905 | 1 | 1 | 0.02% | 0.03% | 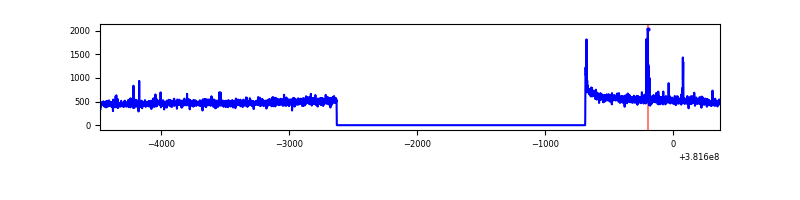 |
| B | 4847 | 2905 | 126 | 126 | 2.60% | 4.34% | 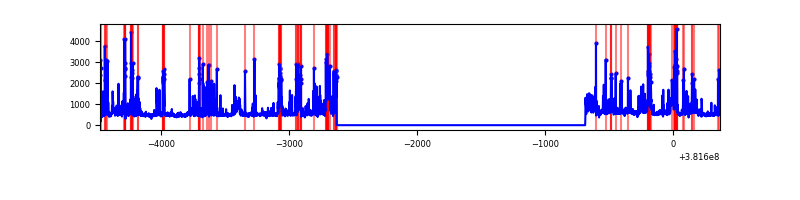 |
| C | 4847 | 2905 | 36 | 36 | 0.74% | 1.24% | 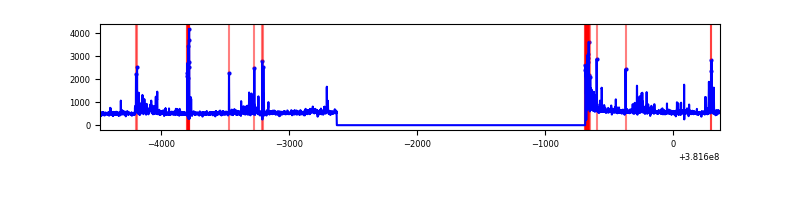 |
| D | 4847 | 2905 | 2719 | 2719 | 56.10% | 93.60% | 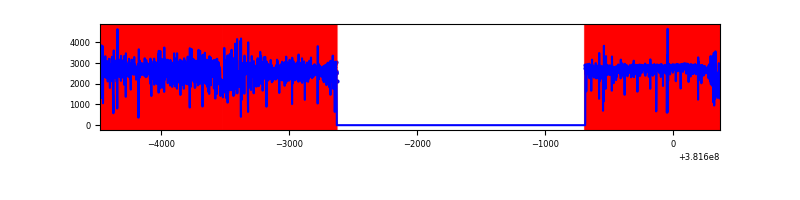 |
Top three noisy pixels from each quadrant. If the there are fewer than three noisy pixels in the level2.evt file, extra rows are filled as -1
| Pixel properties | Quadrant properties | ||||||
|---|---|---|---|---|---|---|---|
| Quadrant | DetID | PixID | Counts | Sigma | Mean | Median | Sigma |
| A | 9 | 143 | 16994 | 224.58 | 368 | 361 | 74.1 |
| A | 10 | 83 | 16689 | 220.46 | 368 | 361 | 74.1 |
| A | 13 | 6 | 6908 | 88.4 | 368 | 361 | 74.1 |
| B | 5 | 172 | 710757 | 10314.93 | 355 | 347 | 68.9 |
| B | 0 | 229 | 70398 | 1017.12 | 355 | 347 | 68.9 |
| B | 4 | 251 | 23565 | 337.12 | 355 | 347 | 68.9 |
| C | 14 | 254 | 194062 | 2329.58 | 356 | 360 | 83.1 |
| C | 15 | 214 | 121351 | 1455.11 | 356 | 360 | 83.1 |
| C | 0 | 10 | 73873 | 884.11 | 356 | 360 | 83.1 |
| D | 7 | 223 | 5758243 | 131323.92 | 171 | 166 | 43.8 |
| D | 12 | 235 | 330418 | 7532.03 | 171 | 166 | 43.8 |
| D | 2 | 249 | 277147 | 6317.08 | 171 | 166 | 43.8 |
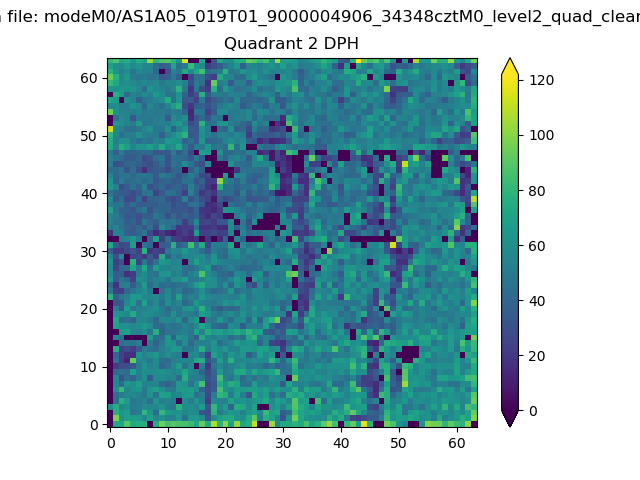
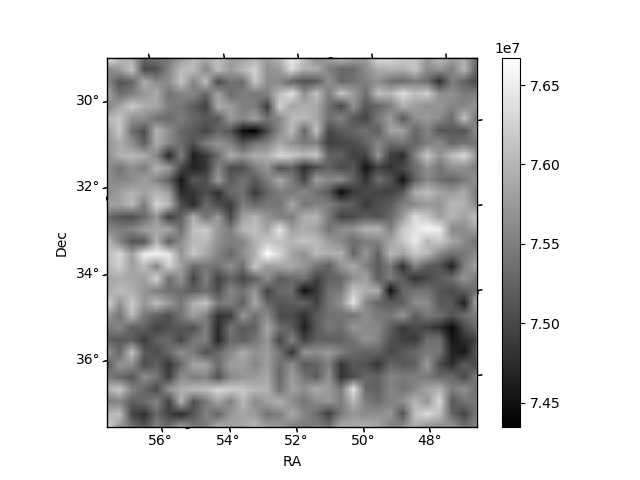
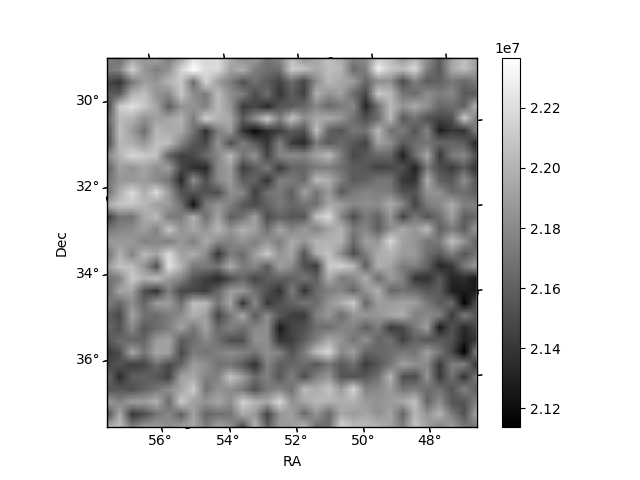
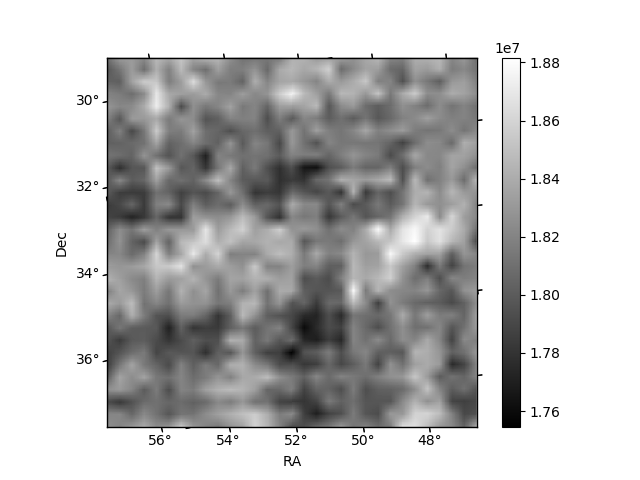
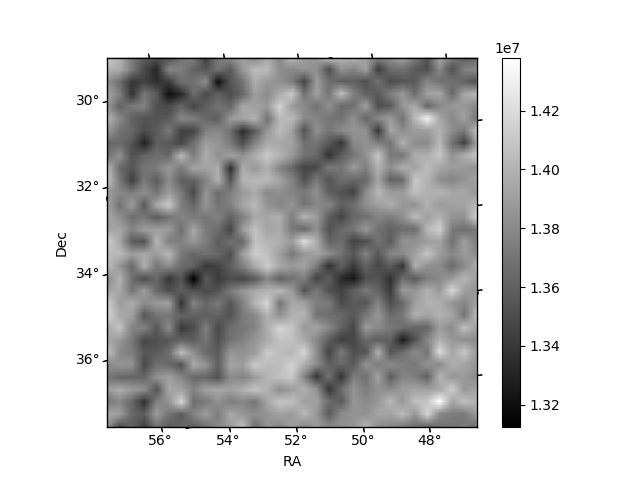
Histogram calculated using DETX and DETY for each event in the final _common_clean file
| Quadrant A | 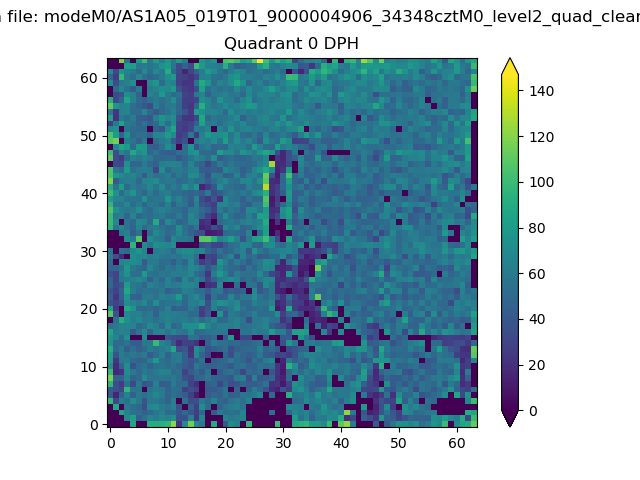 |
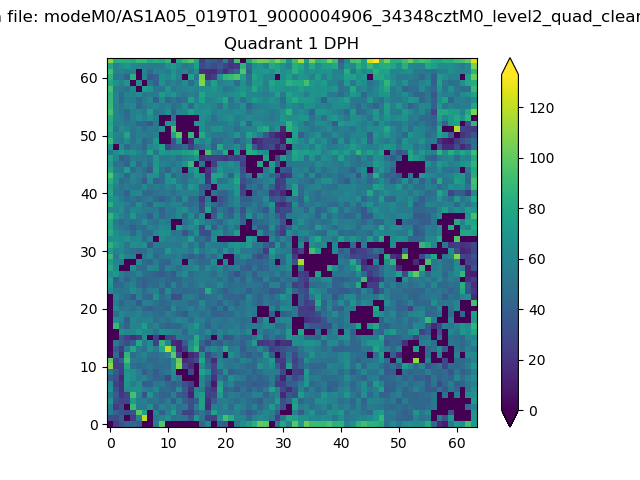 |
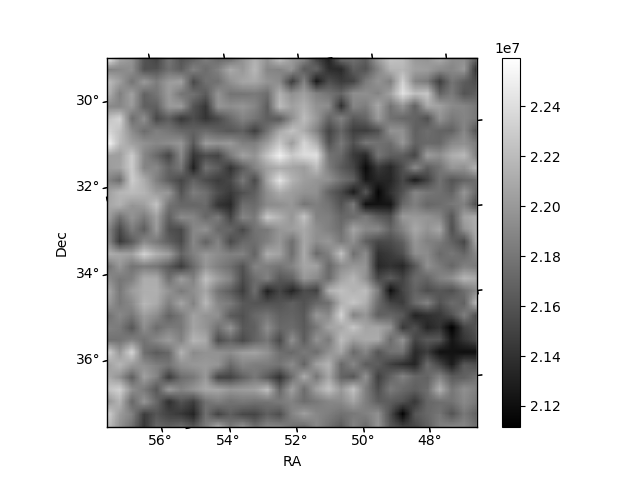
Quadrant B |
|---|---|---|---|
| Quadrant D | 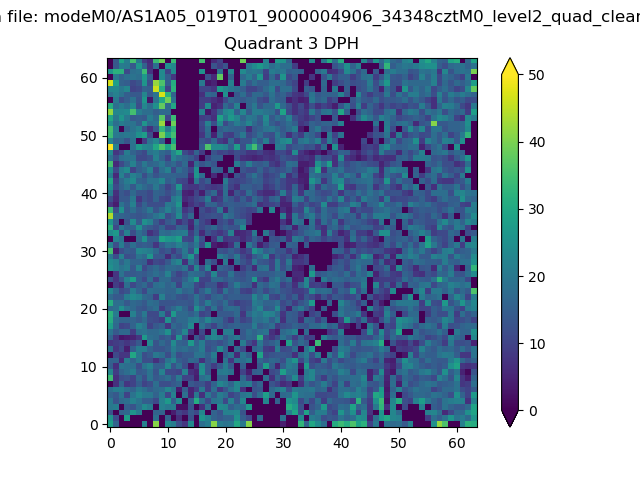 |
 |
Quadrant C |
| Plot type | Count rate plots | Images |
|---|---|---|
| Comparison with Poisson distribution Blue bars denote a histogram of data divided into 1 sec bins. Red curve is a Poisson curve with rate = median count rate of data. |
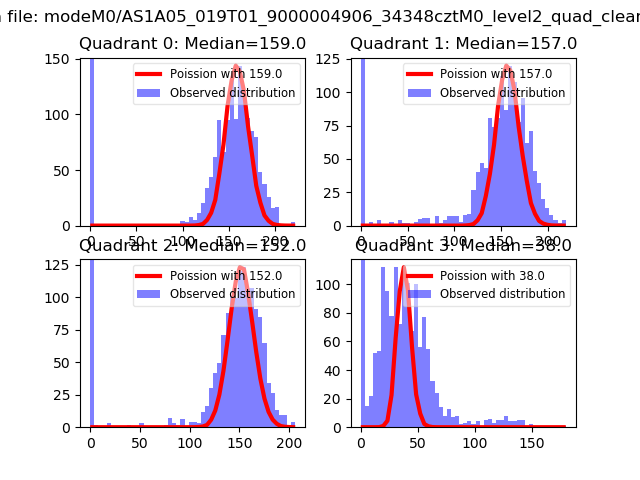 |
 |
| Quadrant-wise count rates Data is divided into 100 sec bins |
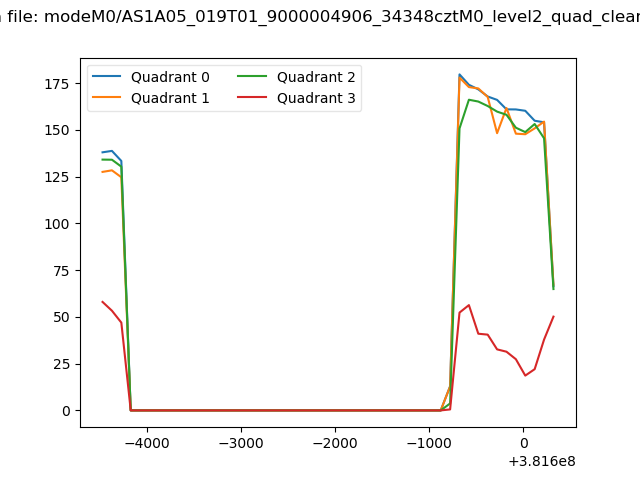 |
|
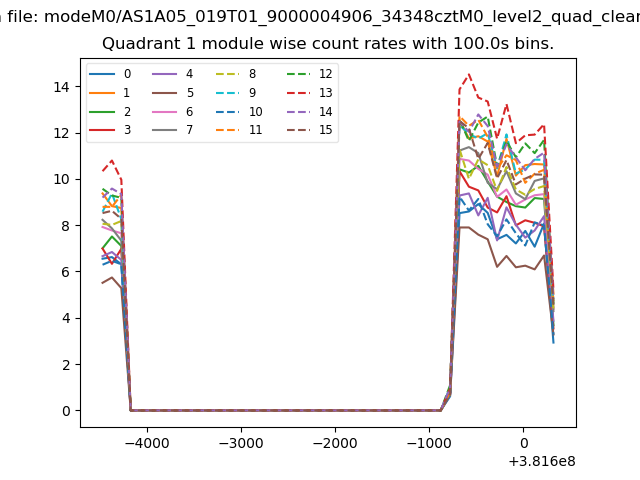
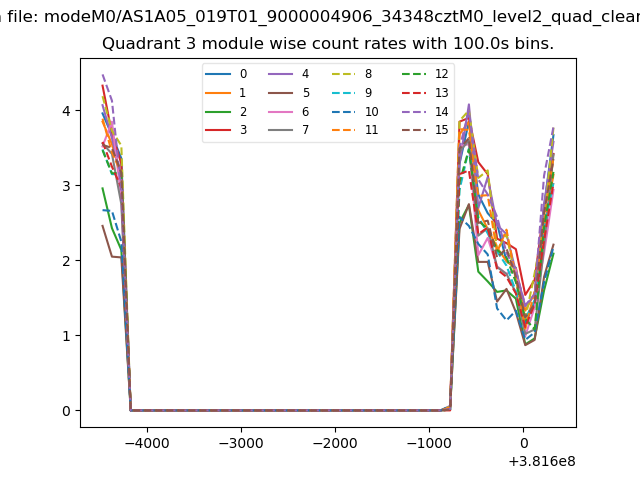
| Module-wise count rates for Quadrant A Data is divided into 100 sec bins |
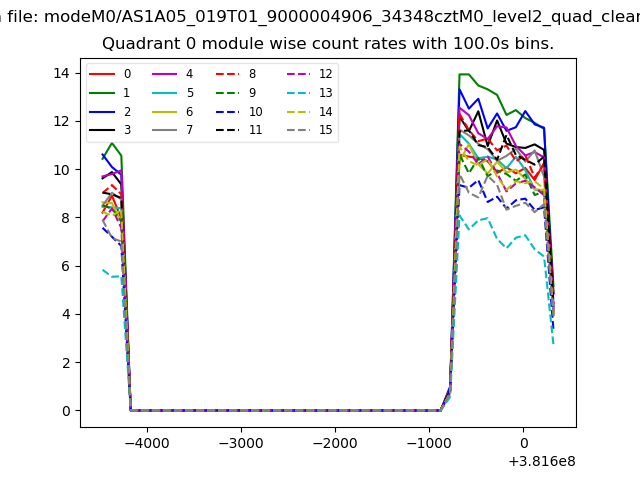 |
 |
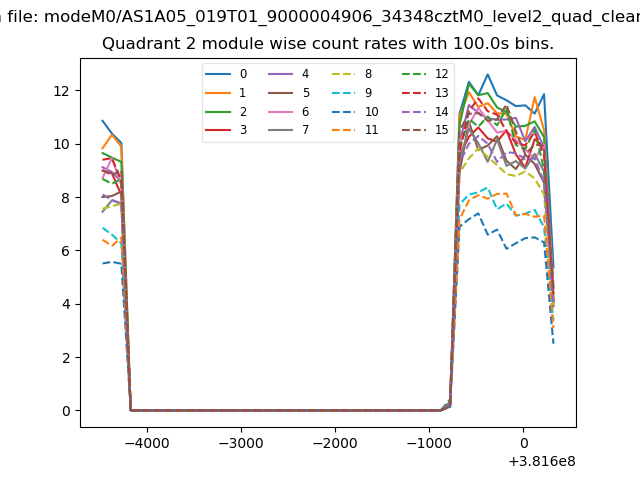
| Module-wise count rates for Quadrant B Data is divided into 100 sec bins |
 |
 |
| Module-wise count rates for Quadrant C Data is divided into 100 sec bins |
 |
 |
| Module-wise count rates for Quadrant D Data is divided into 100 sec bins |
 |
 |
| Parameter | Plot |
|---|---|
| CZT HV Monitor | 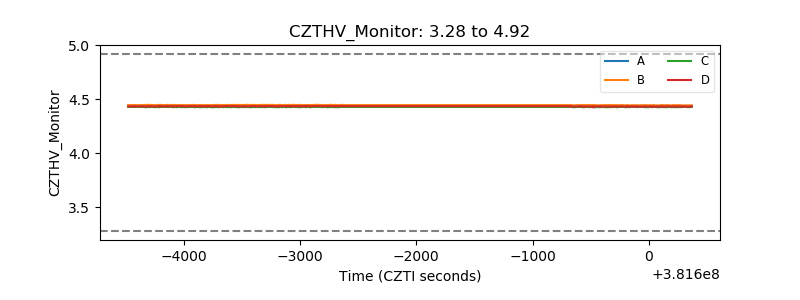 |
| D_VDD | 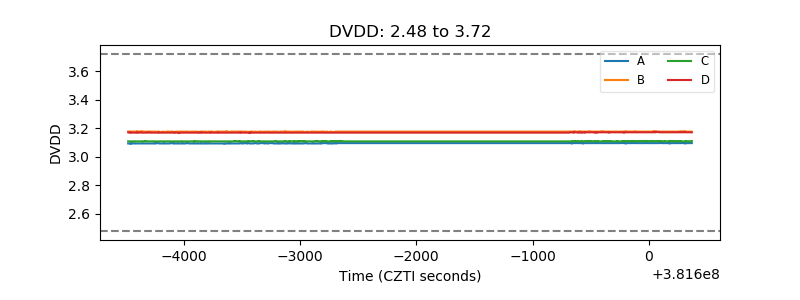 |
| Temperature 1 | 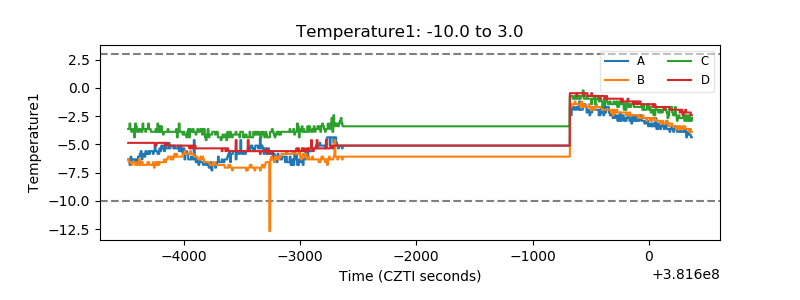 |
| Veto HV Monitor | 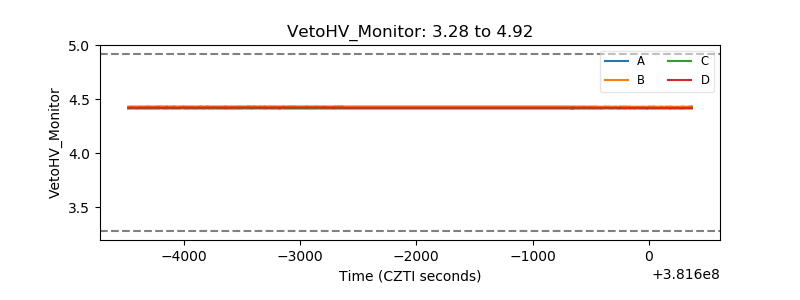 |
| Veto LLD | 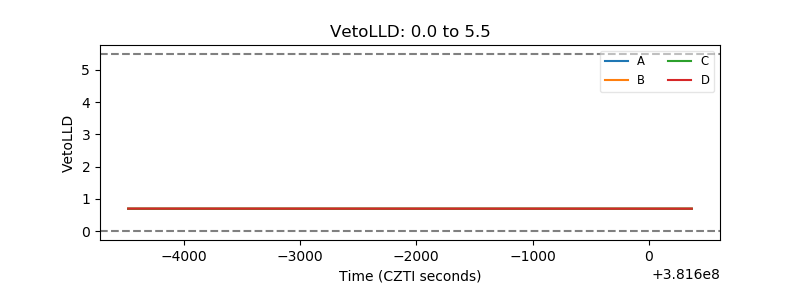 |
| Alpha Counter | 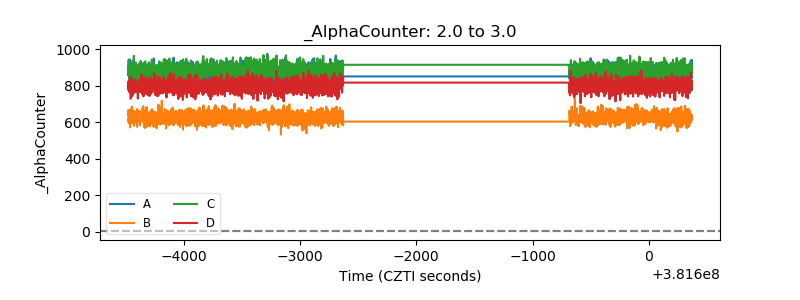 |
| _CPM_Rate | 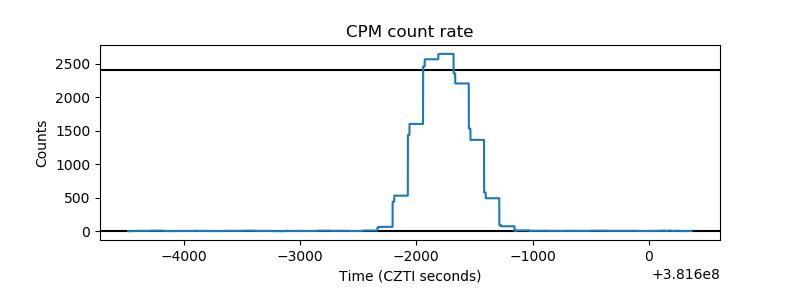 |
| CZT Counter | 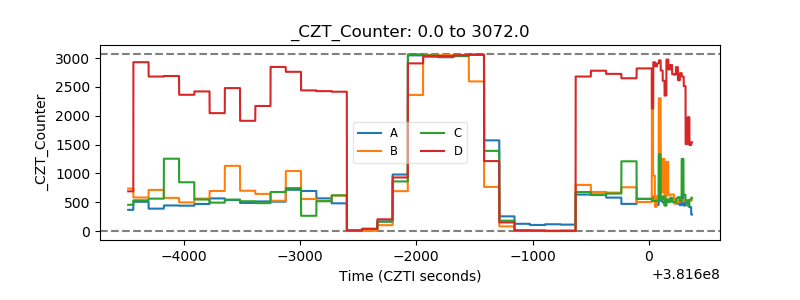 |
| +2.5 Volts monitor | 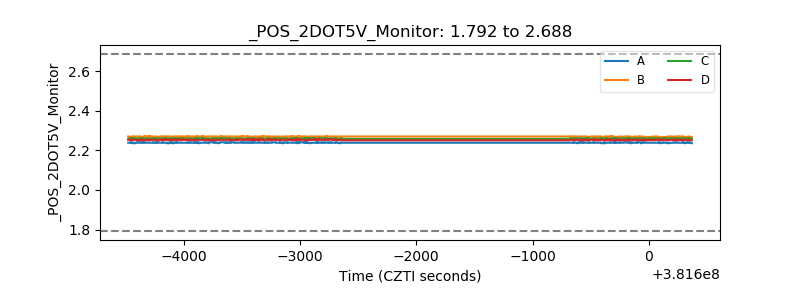 |
| +5 Volts monitor | 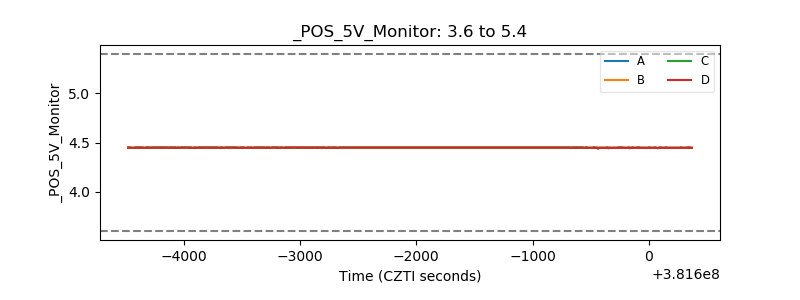 |
| _ROLL_ROT | 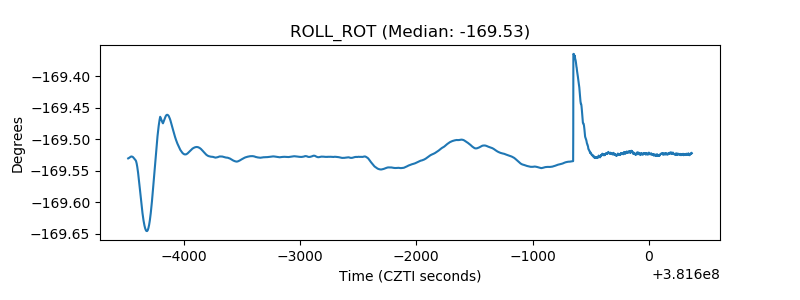 |
| _Roll_DEC | 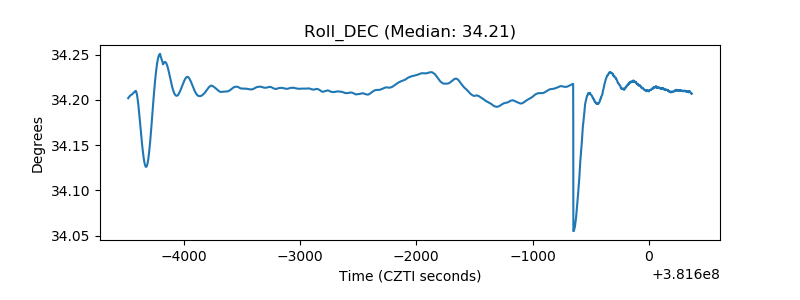 |
| _Roll_RA | 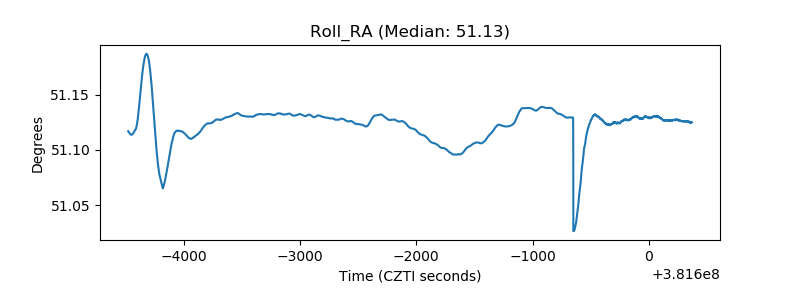 |
| Veto Counter | 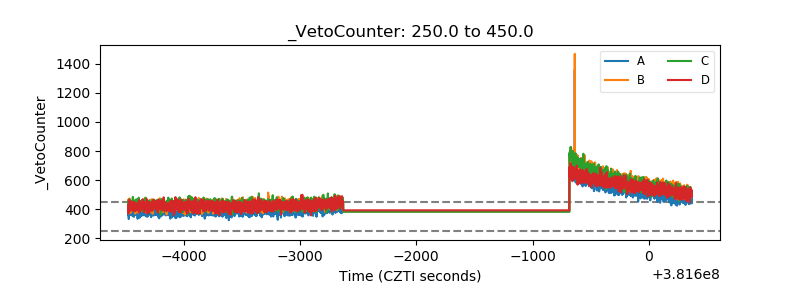 |