| Param | Original file | Final file |
|---|---|---|
| Filename | modeM0/AS1C07_001T05_9000004902_34340cztM0_level2.evt | modeM0/AS1C07_001T05_9000004902_34340cztM0_level2_quad_clean.evt |
| Size (bytes) | 484,686,720 | 101,620,800 |
| Size | 462.2 MB | 96.9 MB |
| Events in quadrant A | 2,666,278 | 671,307 |
| Events in quadrant B | 3,186,492 | 680,930 |
| Events in quadrant C | 3,126,931 | 675,649 |
| Events in quadrant D | 5,292,304 | 630,848 |
| Mode SS | |||
|---|---|---|---|
| Quadrant | BADHDUFLAG | Total packets | Discarded packets |
| A | 0 | 122 | 0 |
| B | 0 | 122 | 0 |
| C | 0 | 122 | 0 |
| D | 0 | 122 | 0 |
| Mode M9 | |||
|---|---|---|---|
| Quadrant | BADHDUFLAG | Total packets | Discarded packets |
| A | 0 | 30 | 0 |
| B | 0 | 30 | 0 |
| C | 0 | 30 | 0 |
| D | 0 | 30 | 0 |
| Mode M0 | |||
|---|---|---|---|
| Quadrant | BADHDUFLAG | Total packets | Discarded packets |
| A | 0 | 12148 | 2 |
| B | 0 | 13602 | 1 |
| C | 0 | 13049 | 1 |
| D | 0 | 19967 | 1 |
| Quadrant | Total seconds | Saturated seconds | Saturation percentage |
|---|---|---|---|
| A | 6003 | 9 | 0.149925% |
| B | 6003 | 91 | 1.515909% |
| C | 6003 | 47 | 0.782942% |
| D | 6003 | 311 | 5.180743% |
Noise dominated data is calculated using 1-second bins in cleaned event files. If a bin has >2000 counts, and if more than 50% of those come from <1% of pixels, then it is considered to be noise-dominated and hence unusable.
| Quadrant | # 1 sec bins | Bins with >0 counts | Bins with >2000 counts | High rate bins dominated by noise | Noise dominated (total time) | Noise dominated (detector-on time) | Marked lightcurve |
|---|---|---|---|---|---|---|---|
| A | 8928 | 6005 | 5 | 5 | 0.06% | 0.08% | 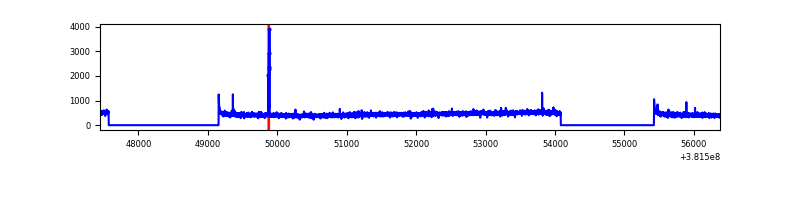 |
| B | 8928 | 6005 | 54 | 54 | 0.60% | 0.90% | 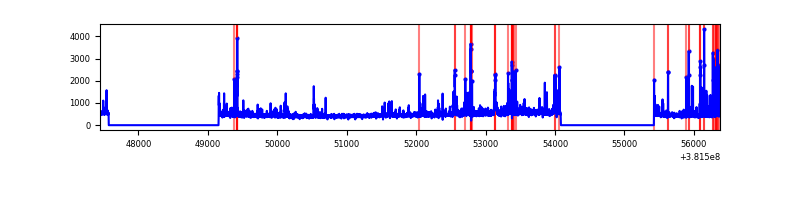 |
| C | 8928 | 6005 | 37 | 37 | 0.41% | 0.62% | 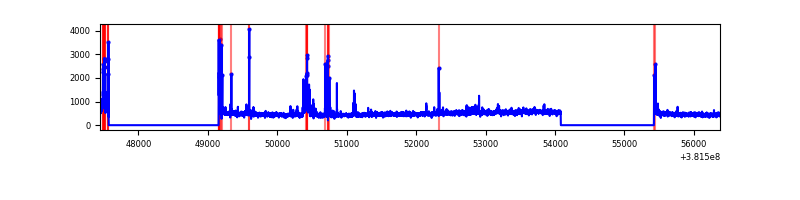 |
| D | 8928 | 6005 | 264 | 264 | 2.96% | 4.40% | 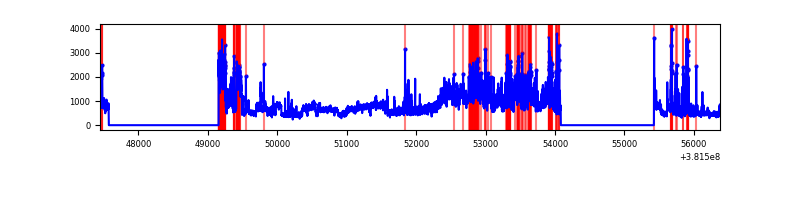 |
Top three noisy pixels from each quadrant. If the there are fewer than three noisy pixels in the level2.evt file, extra rows are filled as -1
| Pixel properties | Quadrant properties | ||||||
|---|---|---|---|---|---|---|---|
| Quadrant | DetID | PixID | Counts | Sigma | Mean | Median | Sigma |
| A | 10 | 83 | 31011 | 227.38 | 672 | 659 | 133.5 |
| A | 9 | 143 | 28956 | 211.98 | 672 | 659 | 133.5 |
| A | 13 | 254 | 8903 | 61.76 | 672 | 659 | 133.5 |
| B | 5 | 172 | 282429 | 2203.62 | 668 | 651 | 127.9 |
| B | 4 | 251 | 85875 | 666.49 | 668 | 651 | 127.9 |
| B | 0 | 229 | 70137 | 543.41 | 668 | 651 | 127.9 |
| C | 15 | 214 | 248046 | 1630.23 | 657 | 661 | 151.7 |
| C | 14 | 254 | 210079 | 1380.04 | 657 | 661 | 151.7 |
| C | 0 | 10 | 60177 | 392.2 | 657 | 661 | 151.7 |
| D | 12 | 227 | 1029618 | 6524.47 | 646 | 628 | 157.7 |
| D | 8 | 195 | 860590 | 5452.72 | 646 | 628 | 157.7 |
| D | 12 | 235 | 427057 | 2703.84 | 646 | 628 | 157.7 |
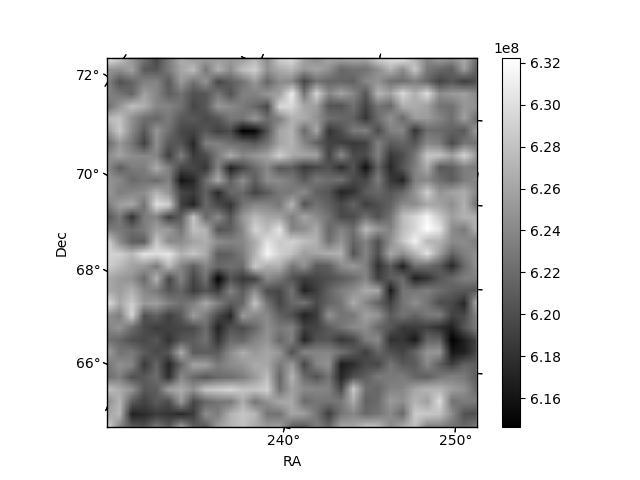
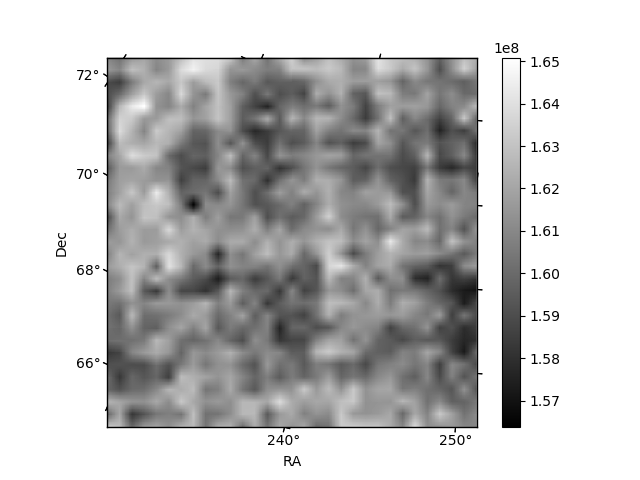
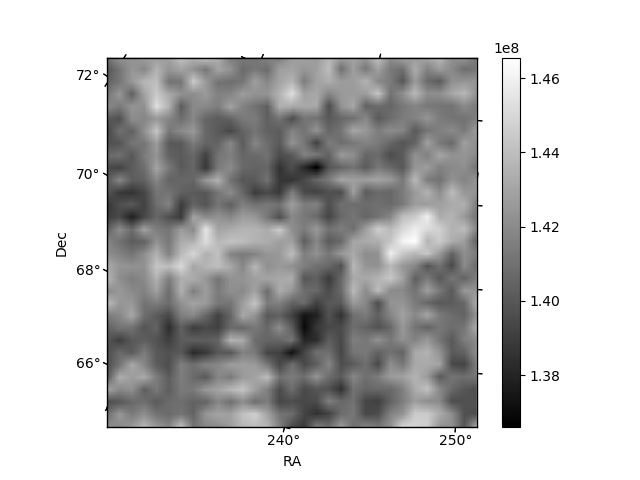
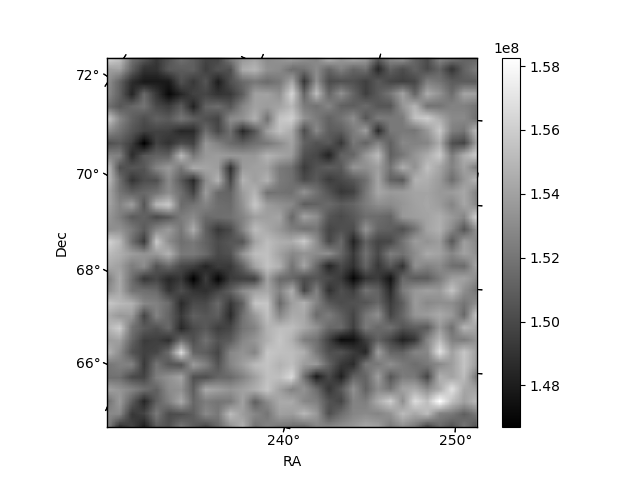
Histogram calculated using DETX and DETY for each event in the final _common_clean file
| Quadrant A | 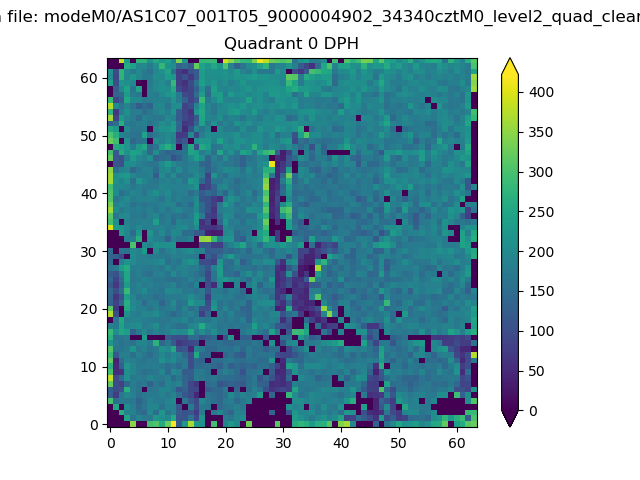 |
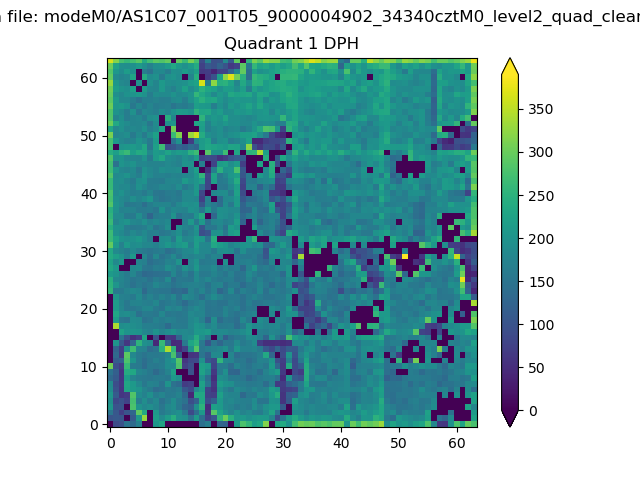 |
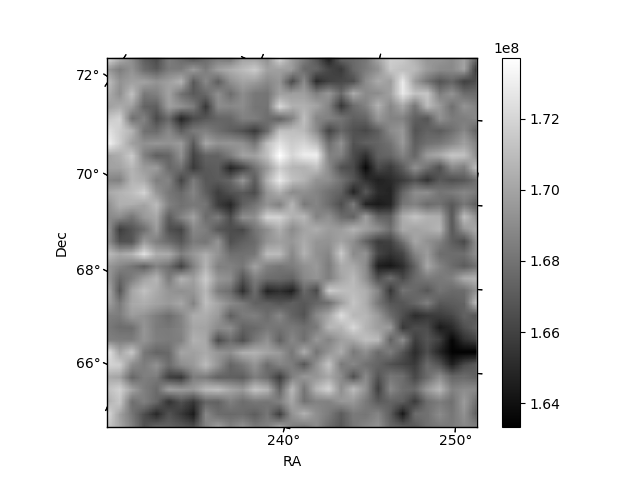
Quadrant B |
|---|---|---|---|
| Quadrant D | 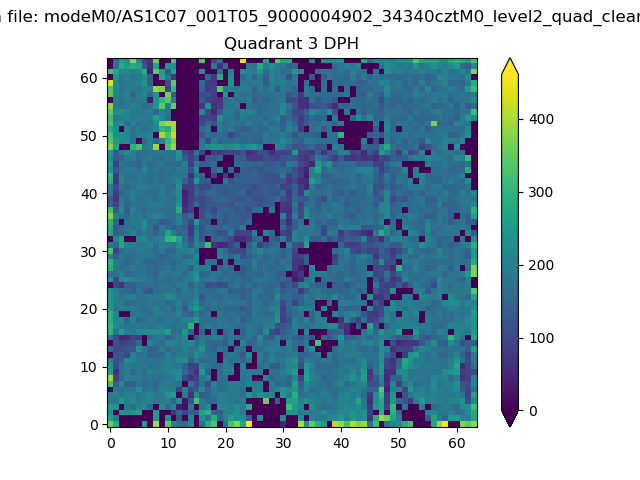 |
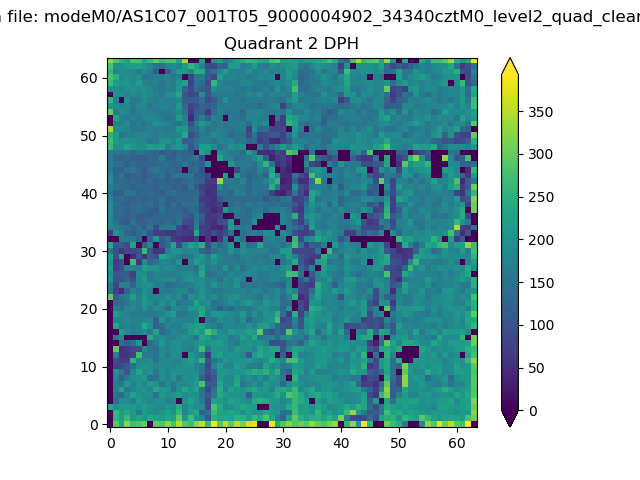 |
Quadrant C |
| Plot type | Count rate plots | Images |
|---|---|---|
| Comparison with Poisson distribution Blue bars denote a histogram of data divided into 1 sec bins. Red curve is a Poisson curve with rate = median count rate of data. |
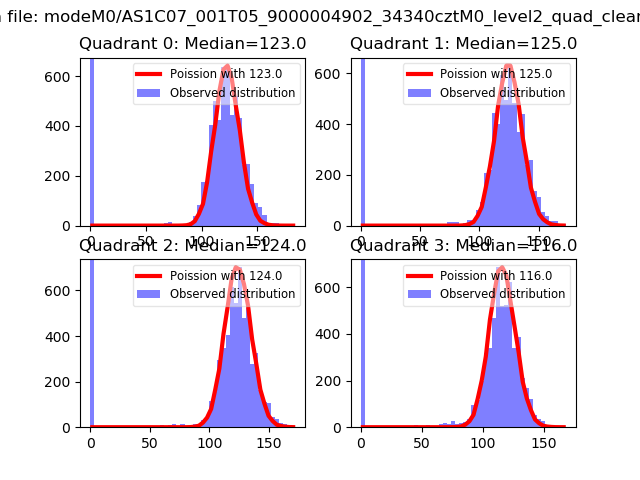 |
 |
| Quadrant-wise count rates Data is divided into 100 sec bins |
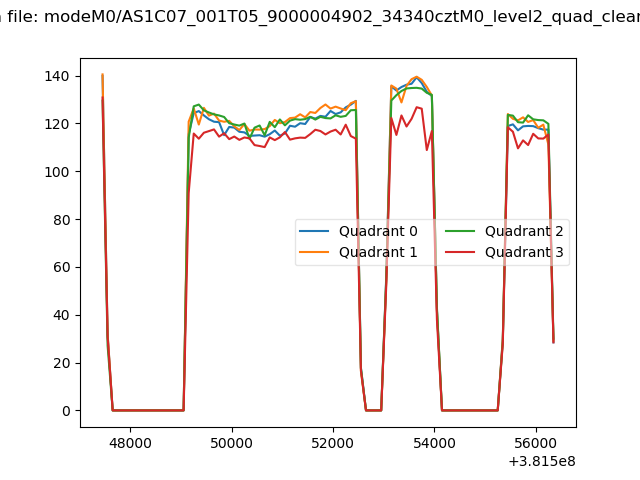 |
|
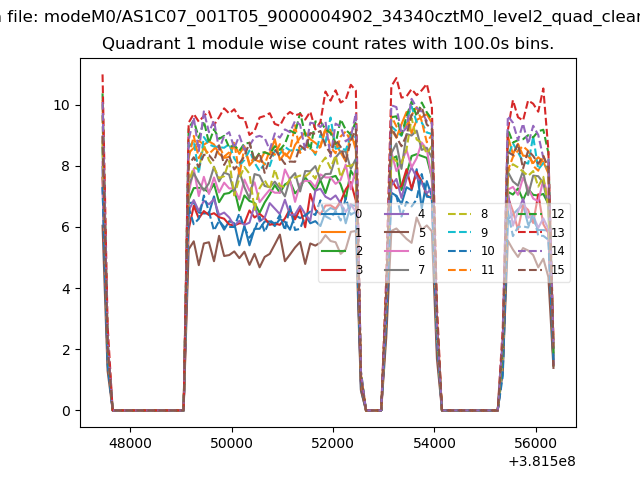
| Module-wise count rates for Quadrant A Data is divided into 100 sec bins |
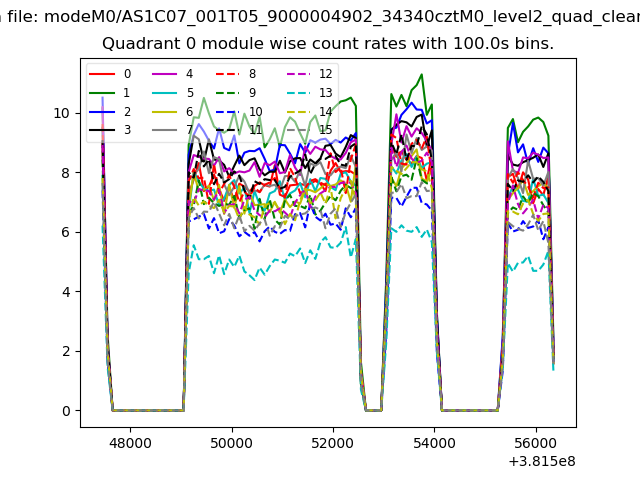 |
 |
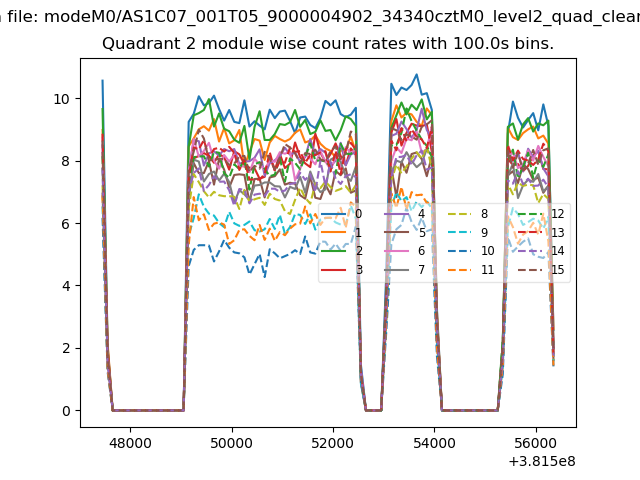
| Module-wise count rates for Quadrant B Data is divided into 100 sec bins |
 |
 |
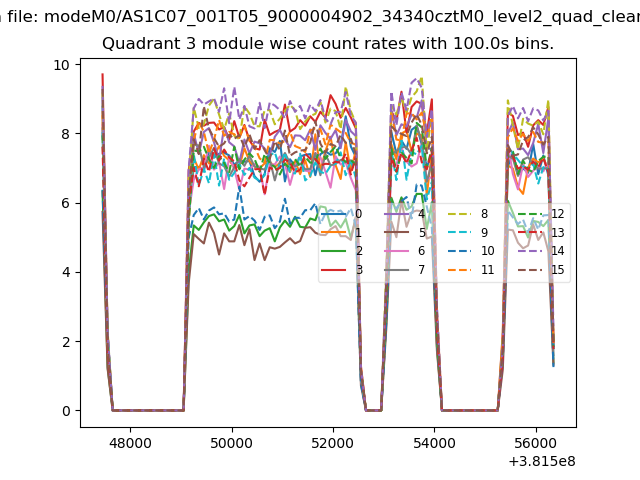
| Module-wise count rates for Quadrant C Data is divided into 100 sec bins |
 |
 |
| Module-wise count rates for Quadrant D Data is divided into 100 sec bins |
 |
 |
| Parameter | Plot |
|---|---|
| CZT HV Monitor | 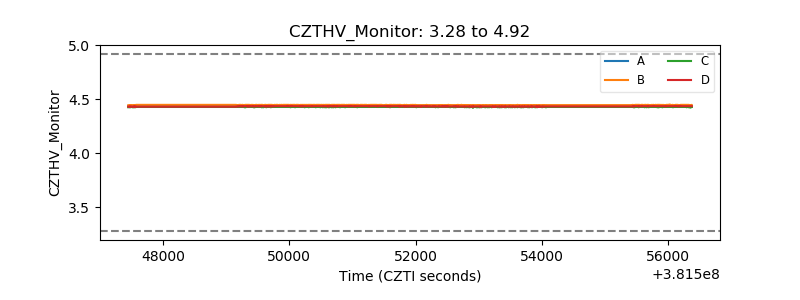 |
| D_VDD | 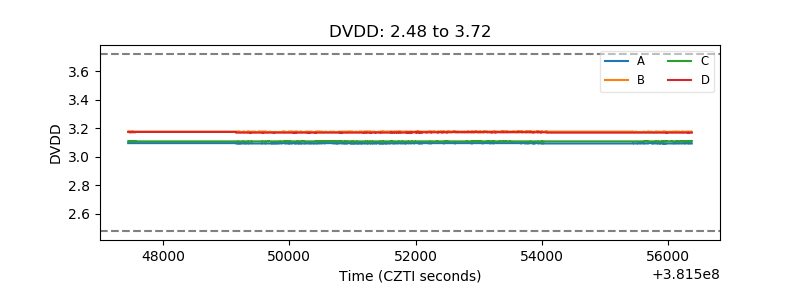 |
| Temperature 1 | 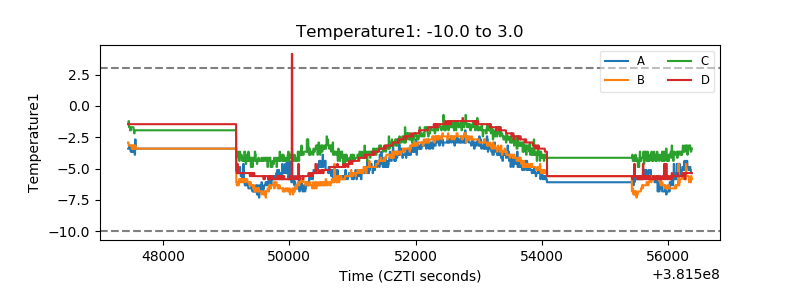 |
| Veto HV Monitor | 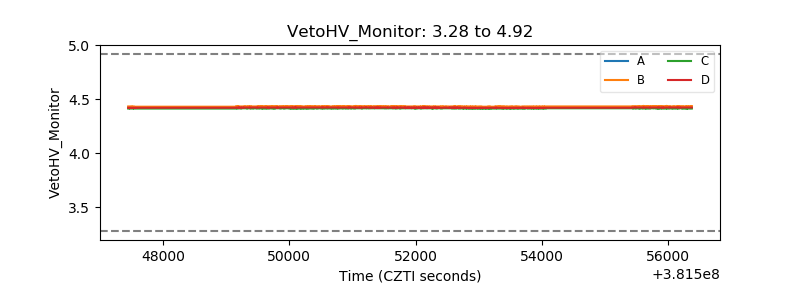 |
| Veto LLD | 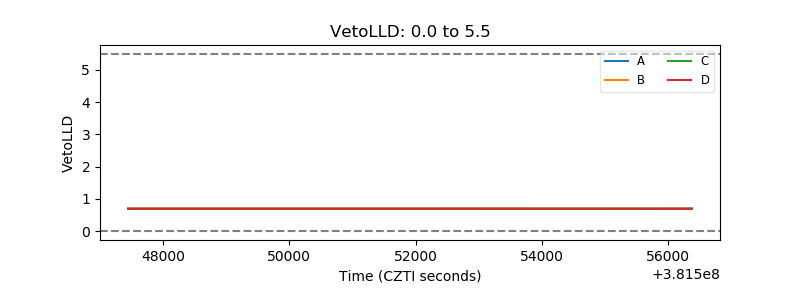 |
| Alpha Counter | 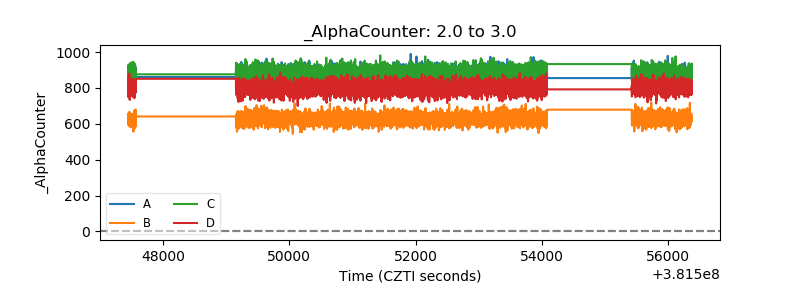 |
| _CPM_Rate | 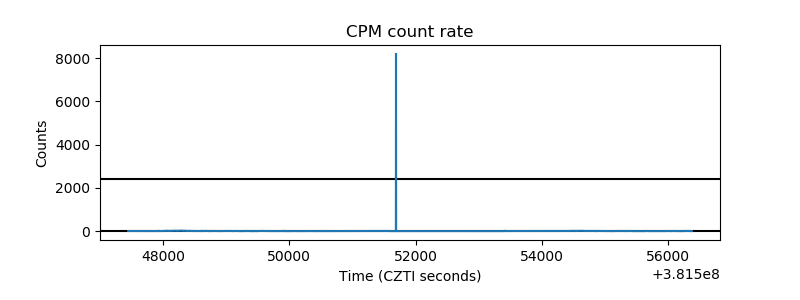 |
| CZT Counter | 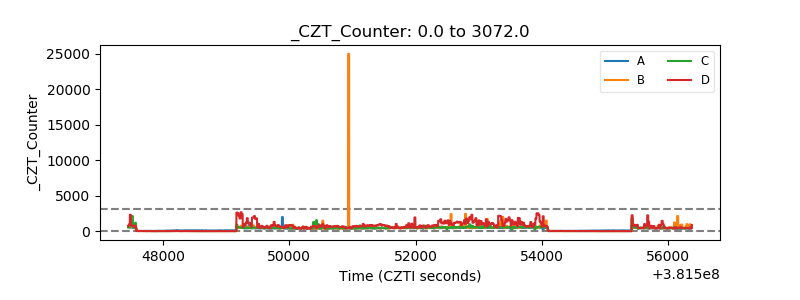 |
| +2.5 Volts monitor | 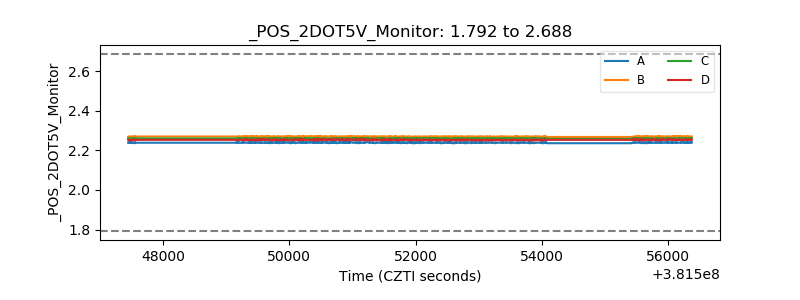 |
| +5 Volts monitor |  |
| _ROLL_ROT | 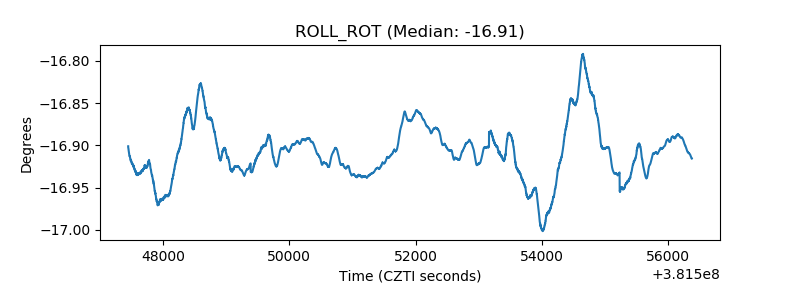 |
| _Roll_DEC | 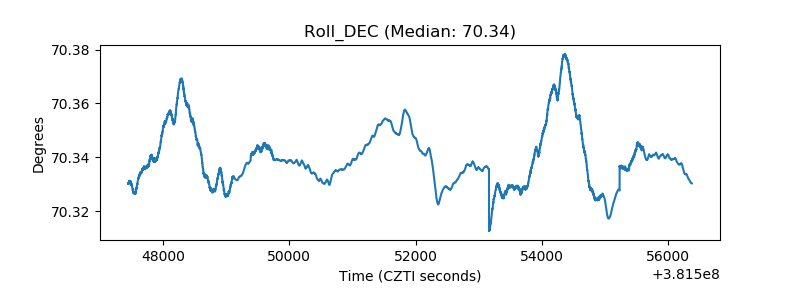 |
| _Roll_RA | 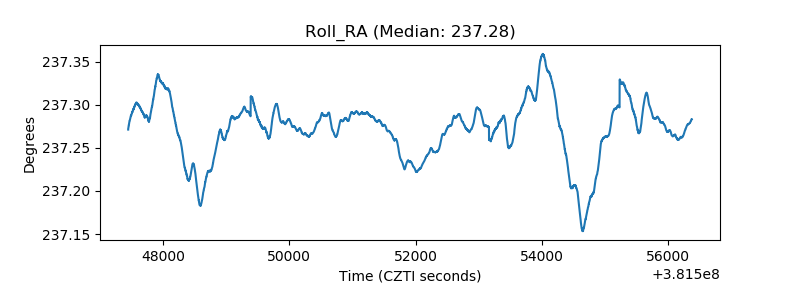 |
| Veto Counter | 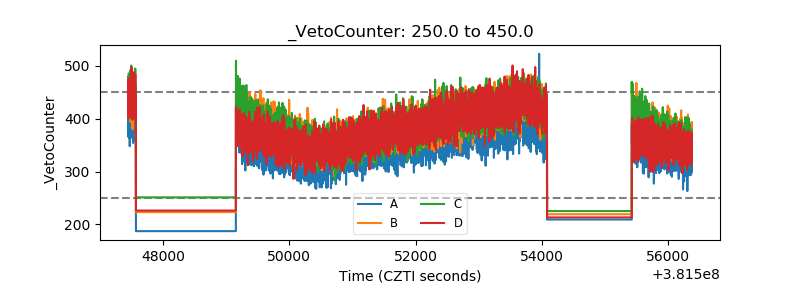 |